3:30 p.m. New York time
Half an hour before the closing bell. The S&P 500 futures zigzagged from the 5840s to the 5810s and back during the session.
The pause in the rise that began on October 2, when Elliott Wave Theory is applied, is a 4th-degree subwave within a 5th-wave uptrend. The 4th wave will be followed by a final rising subwave.
9:35 a.m. New York time
What’s happening now? The S&P 500 E-mini futures traded sideways in a narrow range overnight, whipsawing briefly with the release of the latest Consumer Price Index data, and ending up with a net downward movement.
What does it mean? Elliott Wave Theory sees the largely sideways movement as an uptrending 3rd subwave within a the final subwave, wave 5, within a larger uptrending 5th wave that began on September 6.
A revised analysis. The main impact of Yesterday afternoon’s revision of the analysis is to strengthen the uptrendng nature of the market. The prior analysis, knocked out by a couple of violations of Elliott Wave Theory rules, had seen any rise as an upward correction within a downtrending 5th wave. The current analysis is an uptrending 5th wave, pure and simple.
The bigger picture. As part of my analytical revision, I also revised the labeling of some of the larger waves, which are listed on the chart in the upper-right. I’ve also posted, below, a list of ongoing waves still underway, up to the S&P 500 index 5th wave that began on on July 8, 1932. and is in its final subwave.
Yes, the chart is looking bullish over the past couple of months. Yes, the index has been in an uptrend for 92 years, beginning during the Great Depression of the 1930s. But it’s also clear, based on the number of 5th and final waves within the wave structure, that the bullish trend will be gradually unwindng over tme.
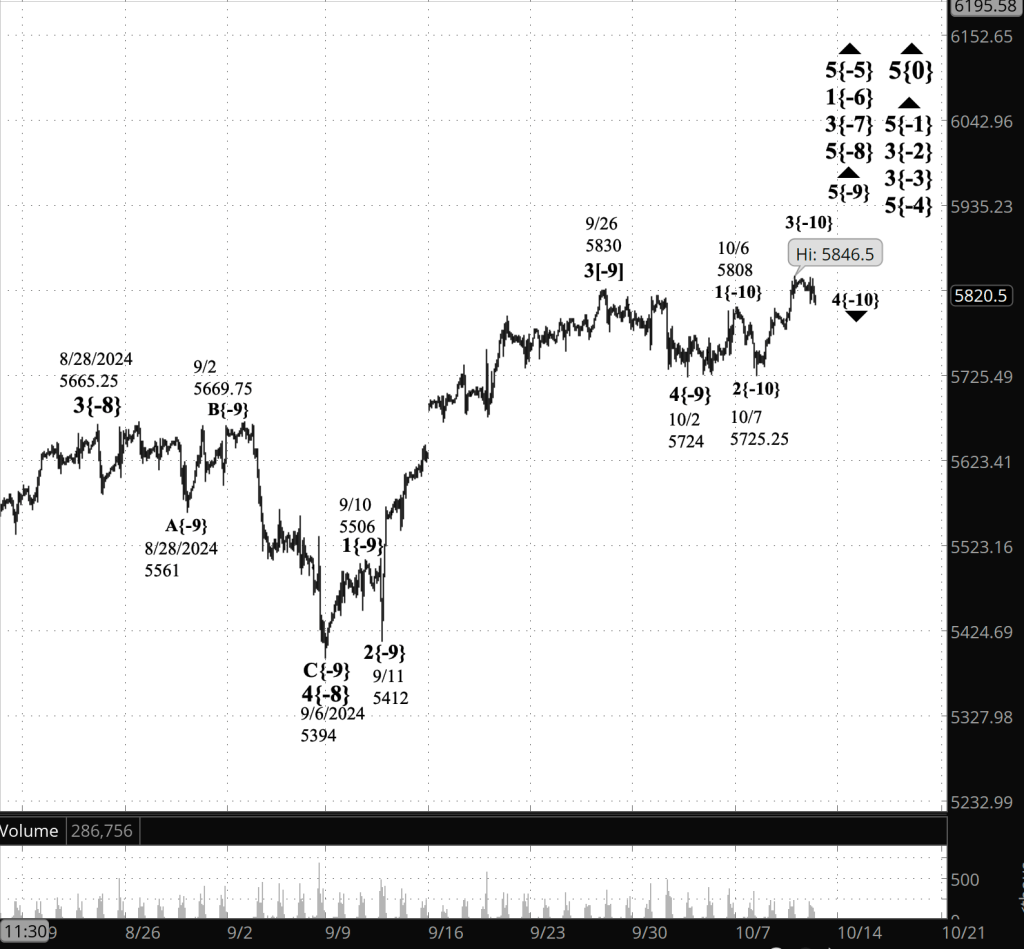
[S&P 500 E-mini futures at 3:30 p.m., 90-minute bars, with volume]
What are the alternatives?
What does Elliott wave theory say? Here are the waves that underly the analyses.
Principal Analysis:
- Rising wave 5{0} is underway. It is a wave of Intermediate degree that began in December 2018.
- It is in its final subwave, wave 5{-1}.
- Within wave 5{-1}, rising waves 5{-2}, 5{-3} and 5{-4} are underway, as is wave 5{-5}.
- Wave 5{-5} is in its initial subwave, wave 1{-6}, which in turn is in its middle subwave, wave 3{-7}.
- Wave 3{-7} is in its final; subwave, uptrending wave 5{-8}.
- Wave 5{-8} is in its final subwave, wave 5{-9}, which is in its next-to-the-last subwave, wave 4{-10}.
Long-term Waves.
These are the waves currently in progress under my principal analysis. Each line on the list shows the wave number, with the subscript in curly brackets, the traditional degree name, the starting date, the starting price of the S&P 500 E-mini futures, and the direction of the wave.
- S&P 500 Index:
- 5{+3} Supercycle, 7/8/1932, 4.40 (up)
- 5{+2} Cycle, 12/9/1974, 60.96 (up)
- 5{+1} Primary, 3/6/2009, 666.79 (up)
- 5{0} Intermediate, 12/26/2018, 2346.58 (up)
- S&P 500 Futures
- 5{-1} Minor, 10/27/2023, 4127.25 (up)
- 3{-2} Minute, 10/27/23, 4127.75 (up)
- 3{-3} Minuette, 10/27/23, 4127.75 (up)
- 5{-4} Subminuette, 4/18/2024, 4963.50 (up)
- 5{-5} Micro, 8/5/2024, 5120 (up)
- 1{-6} Submicro, 8/5/2024, 5120 (up)
- 3{-7} Minuscule, 8/7/2024, 5182 (up)
- 5{-8} (unnamed), 9/6/2024, 5394 (up)
Reading the chart. Price movements — waves – – in Elliott wave analysis are labeled with numbers within trending waves and letters with corrective waves. The subscripts — numbers in curly brackets — designate the wave’s degree, which, in Elliott wave analysis, means the relative position of a wave within the larger and smaller structures that make up the chart. R.N. Elliott, who in the 1930s developed the form of analysis that bears his name, viewed the chart as a complex structure of smaller waves nested within larger waves, which in turn are nested within still larger waves. In mathematics it’s called a fractal structure, where at every scale the pattern is similar to the others.
Learning and other resources. Elliott wave analysis provides context, not prophecy. As the 20th century semanticist Alfred Korzybski put it in his book Science and Sanity (1933), “The map is not the territory … The only usefulness of a map depends on similarity of structure between the empirical world and the map.” And I would add, in the ever-changing markets, we can judge that similarity of structure only after the fact.
See the menu page Analytical Methods for a rundown on where to go for information on Elliott wave analysis.
By Tim Bovee, Portland, Oregon, October 10, 2024
Disclaimer
Tim Bovee, Private Trader tracks the analysis and trades of a private trader for his own accounts. Nothing in this blog constitutes a recommendation to buy or sell stocks, options or any other financial instrument. The only purpose of this blog is to provide education and entertainment.
No trader is ever 100 percent successful in his or her trades. Trading in the stock and option markets is risky and uncertain. Each trader must make trading decisions for his or her own account, and take responsibility for the consequences.
License
All content on Tim Bovee, Private Trader by Timothy K. Bovee is licensed under a Creative Commons Attribution-ShareAlike 4.0 International License.
Based on a work at www.timbovee.com.

You must be logged in to post a comment.