After my charting software failed this morning, forcing a quick workaround, I talked to team about the status. It’s a problem in the system, not particular to my computer, they’re working on it. It’s not fixed yet, so another workaround with a better chart have smaller bars: The iPhone app version, using SPY rather than the futures.
3:30 p.m. New York time
Half an hour before the closing bell. The S&P 500 family of spinoffs continued to fall during the session, reaching a low of 582.07 so far on the exchange-traded fund SPY and 5844.50 on the futures. Elliott Wave Theory analysis: No change to speak of from this morning. The added decline added a bit more weight to the downward scenario, but it’s all up in the air.
Here’s hoping for better charting and greater clarity tomorrow.
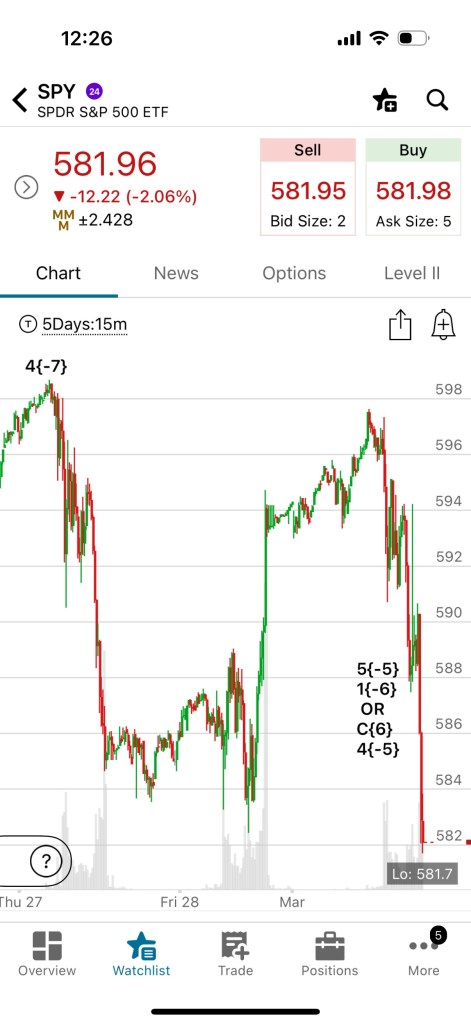
[S&P 500 E-mini futures at 3:26 p.m., 3/3/2025, 15-minute bars, with volume]
9:35 a.m. New York time
What’s happening now? The S&P 500 E-mini futures rose when trading resumed overnight, a continuation of a rise that began Friday, February 28, as the closing bell approached.
Friday’s bar is a green bar immediately to the left of the rightmost bar, also green, which is this morning’s opening bar.
Friday’s low was 5848, and the close was 5958. When trading resumed overnight, it opened at 5967.50 and then worked its way higher, so far having peaked at 6000.50.
What does it mean?
Elliott Wave Theory sees the chart this way: The present rise lies at the heart what we knew at Friday’s close. The price was bottom fishing, and any lower low could be the end of one wave and the start of the next.
In the discussion that follows, I’ll use the labeling that appears on yesterday’s chart, in which each wave has a wave number, followed by an indicator of its distance from Intermediate degree in the Elliott Wave system. Intermediate degree began in 2018 as wave 5{0}, and wave 4{-5}, the downtrending correction, is five degrees lower than wave 5{0}.
The decline that reached Friday’s low is labeled wave C{-6}, the final subwave within the larger wave B{-5}, the middle wave 4{-5}, a downward correction that began on February 19 from 6166.50. Wave C and its parent, wave 4 may have ended at that point, 5848, and the following wave 5{-6} may have begun.
Unless it hasn’t ended. the price hasn’t risen very far and could easily whipsaw back to a lower low, wave 6 within wave 4.
Today’s Chart
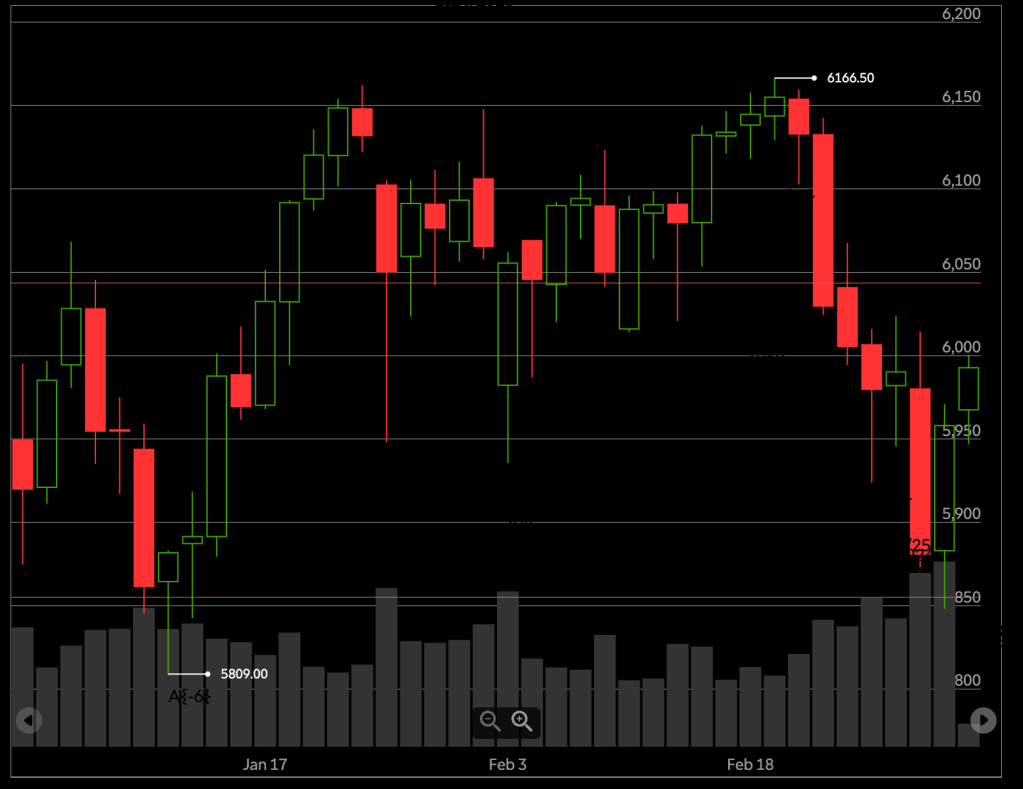
[S&P 500 E-mini futures at 9:35 a.m., dailybars, with volume]
Yesterday’s Chart

[S&P 500 E-mini futures at 3:30 p.m., 2/28/2025, 2-hour bars, with volume]
What are the alternatives? I’m staying with the wave 4 continues scenario. I want to see a further rise before I’m persuaded that wave 5 has begun
What does Elliott Wave Theory say? Here are the waves that underlie the morning’s analyses as they appeared on the chart.
Alternative Analysis #1, Wave 4 Scenario:
- Wave C{-6} within wave 4{-5} continues.
Alternative Analysis #2, Wave 5 Scenario
- Wave C{-6} within wave 4{-5} has ended.
- Rising wave 5{-5} has begun.
And there’s another.
Alternative Analysis #3, Wave X Scenario
- Wave 4{-5} is taking a comppund form and the connector subwave, wave X{-6}, has begun.
- A compound form means that the correction has two or three corrective patterns, each connected with the next by an X wave
Long-term Waves.
These are the waves currently in progress under my principal analysis. Each line on the list shows the wave number, with the subscript in curly brackets, the traditional degree name, the starting date, the starting price of the S&P 500 E-mini futures, and the direction of the wave.
- S&P 500 Index:
- 5{+3} Supercycle, 7/8/1932, 4.40 (up)
- 5{+2} Cycle, 12/9/1974, 60.96 (up)
- 5{+1} Primary, 3/6/2009, 666.79 (up)
- 5{0} Intermediate, 2/11/2016, 1810.10 (up)
- 3{-1} Minor, 3/23/2020, 2191.36 (up)
- 3{-2} Minute, 10/13/2022, 3491.58 (up)
- S&P 500 Futures
- 5{-3} Minuette, 4/18/2024, 4963.50 (up)
- 3{-4} Subminuette, 8/7/2024, 5182 (up)
- 4{-5} Micro, 12/16/2025, 6163.75 (down)
- C{-6} Submicro, 2/19/2025, 6166.50 (down)
Or alternatively,
- 5{-5} Micro, 2/27/2025, 5855.50 (up)
- 1{-6} Submicro, 2/27/2025, 5855.50 (up)
And yet another
- Wave X{-6}, 2//27/2025, 5855.50 (up)
Reading the chart. Price movements — waves – – in Elliott Wave Theory analysis are labeled with numbers within trending waves and letters with corrective waves. The subscripts — numbers in curly brackets — designate the wave’s degree, which, in Elliott Wave analysis, means the relative position of a wave within the larger and smaller structures that make up the chart. R.N. Elliott, who in the 1930s developed the form of analysis that bears his name, viewed the chart as a complex structure of smaller waves nested within larger waves, which in turn are nested within still larger waves. In mathematics it’s called a fractal structure, where at every scale the pattern is similar to the others.
Learning and other resources. Elliott Wave analysis provides context, not prophecy. As the 20th century semanticist Alfred Korzybski put it in his book Science and Sanity (1933), “The map is not the territory … The only usefulness of a map depends on similarity of structure between the empirical world and the map.” And I would add, in the ever-changing markets, we can judge that similarity of structure only after the fact.
See the menu page Analytical Methods for a rundown on where to go for information on Elliott Wave analysis.
By Tim Bovee, Portland, Oregon, March 3, 2025
Disclaimer
Tim Bovee, Private Trader tracks the analysis and trades of a private trader for his own accounts. Nothing in this blog constitutes a recommendation to buy or sell stocks, options or any other financial instrument. The only purpose of this blog is to provide education and entertainment.
No trader is ever 100 percent successful in his or her trades. Trading in the stock and option markets is risky and uncertain. Each trader must make trading decisions for his or her own account, and take responsibility for the consequences.
All content on Tim Bovee, Private Trader by Timothy K. Bovee is licensed under a Creative Commons Attribution-ShareAlike 4.0 International License.
Based on a work at www.timbovee.com

You must be logged in to post a comment.