The most capable ThinkOrSwim charting software, which I need for marking Elliott Wave Theory waves,is still down. So the chart will focus on the overnight movement, and I’ll rely on description and an older chart, before the chartng system broke, to clarify the layout.
And my software has been fixed. Here’s an update to the analyses.
5:30 p.m. New York time
[S&P 500 E-mini futures at 5:37 p.m., 2-hour bars, with volume]
The S&P 500 E-mini futures are in the 5820s an hour and a half after the closing bell. With full charting capabilities restored, my analysis leads me to conclude that the day’s low point, at 5744, is the end of the 3rd subwave within the final descending subwave C within the 4th-wave downward correction that began on December 16, 2024.
From this point I’ll refer to the waves as they appear on the chart: A wave number followed by a subscript in brackets telling the wave’s position in relation to Intermediate degree.
Using that nomenclature, the low was the end of wave 3{-7} within wave C{-6} within wave 4{-5}, the downward correction that began in December.
With the restoration of better charting, the subwaves within wave 3{-7} have attained clarity. With wave 3{-7} complete, rising wave 4{-7} is now underway, and it will be followed by downtrending wave 5{-7}, which will carry the price to the end of wave C{-6}, and possibly, of wave 4{-5}.
More tomorrow at the opening bell.
3:30 p.m. New York time
Half an hour before the closing bell. The S&P 500 futures it the low of the day, 5744, early in the session and then rose steadily into the 5680s.
Elliott Wave Theory: The price has reached the neighborhood of lower level of the 4th subwave within the prior 3rd wave. That’s significant because the 4th waves, such as the correction that has been ongoing since December, tend to reach completion within that range. This is the first return to that range since the current 4th wave overshot the lower level of expected completion in late February.
Does this entirely clear the ambiguity about how to level the waves in our chart? Not really. But it’s a bullish step.
9:35 a.m. New York time
What’s happening now? The S&P 500 E-mini futures rose overnight into the 5870s, where it stayedfor the first half of the period before declining into the 5810s.
What does it mean? Elliott Wave Theory: The chart continues bottom fishing, seeking an endpoint to the decline that began on February 19, the left-most peak on the chart..
That declining wave is C{-6}, and so far it is tracing out its final subwave, wave C{-7}, which in turn is tracing out its 5th subwave, according to one scenario. Another scenario has it that the 5th subwave has ended at whatever the latest low is.
When the two subwaves are complete, it will likely be the end of wave 4{-5}, a downward correction that began on December 16, 2024.
Today’s Chart
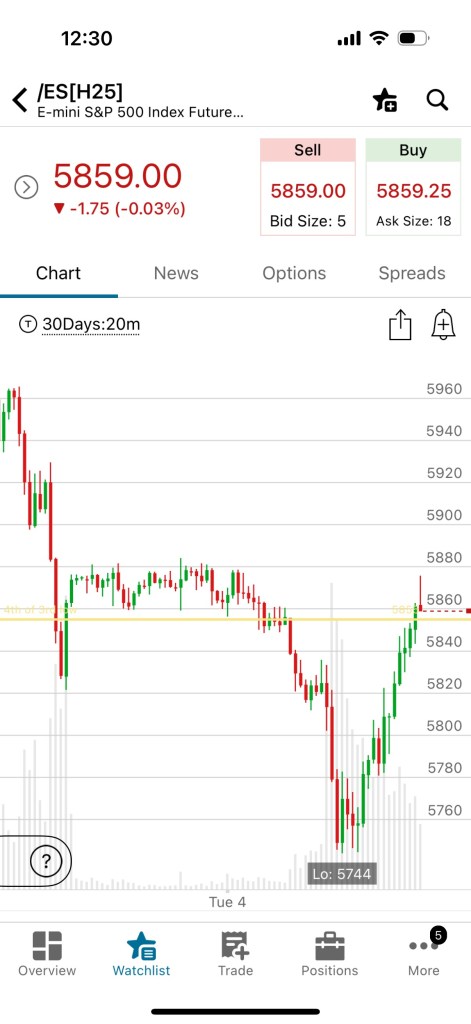
[S&P 500 E-mini futures at 3:30 p.m., 20-minute bars, with volume]
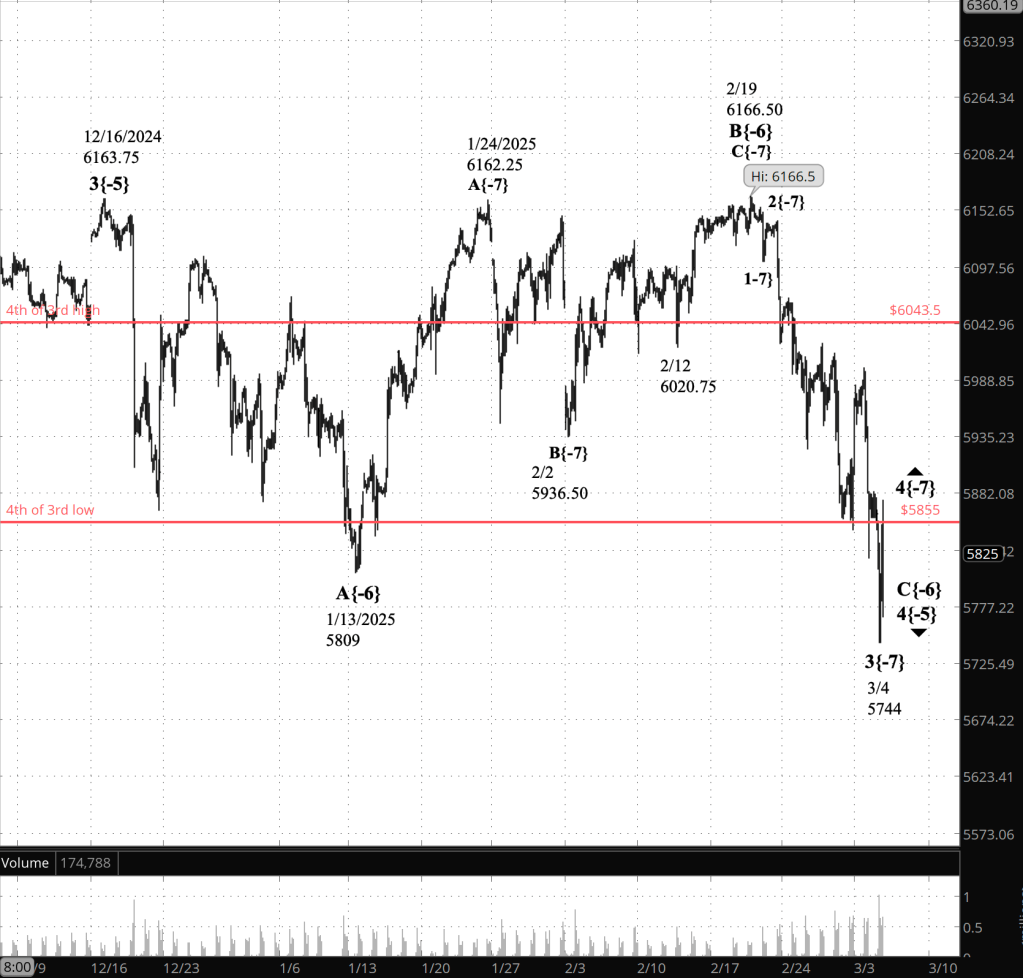
February 28 Chart

[S&P 500 E-mini futures at 3:30 p.m., 2/28/2025, 2-hour bars, with volume]
Reading the chart. Price movements — waves – – in Elliott Wave Theory analysis are labeled with numbers within trending waves and letters with corrective waves. The subscripts — numbers in curly brackets — designate the wave’s degree, which, in Elliott Wave analysis, means the relative position of a wave within the larger and smaller structures that make up the chart. R.N. Elliott, who in the 1930s developed the form of analysis that bears his name, viewed the chart as a complex structure of smaller waves nested within larger waves, which in turn are nested within still larger waves. In mathematics it’s called a fractal structure, where at every scale the pattern is similar to the others.
Learning and other resources. Elliott Wave analysis provides context, not prophecy. As the 20th century semanticist Alfred Korzybski put it in his book Science and Sanity (1933), “The map is not the territory … The only usefulness of a map depends on similarity of structure between the empirical world and the map.” And I would add, in the ever-changing markets, we can judge that similarity of structure only after the fact.
See the menu page Analytical Methods for a rundown on where to go for information on Elliott Wave analysis.
By Tim Bovee, Portland, Oregon, March 4, 2025
Disclaimer
Tim Bovee, Private Trader tracks the analysis and trades of a private trader for his own accounts. Nothing in this blog constitutes a recommendation to buy or sell stocks, options or any other financial instrument. The only purpose of this blog is to provide education and entertainment.
No trader is ever 100 percent successful in his or her trades. Trading in the stock and option markets is risky and uncertain. Each trader must make trading decisions for his or her own account, and take responsibility for the consequences.
All content on Tim Bovee, Private Trader by Timothy K. Bovee is licensed under a Creative Commons Attribution-ShareAlike 4.0 International License.
Based on a work at www.timbovee.com

You must be logged in to post a comment.