3:30 p.m. New York time
Half an hour before the closing bell. The S&P 500 futures reached a session high of 7483.75 and then pulled back into the 7460s.
Elliott Wave Theory. Wave D{-5} continues to climb, with brief pullbacks but no meaningful reversal. Today’s high extended the D{-5} advance and kept rising wave C{-6} alive within that structure.
Wave D{-5} is a subwave of wave 4{-4}, a downward correction that began last October and is taking the form of an Expanding Triangle. When D{-5} ends, declining wave E{-5} will begin from that same point and will be the final subwave of the Triangle.
Decision Points. A move above 7483.75 would further extend wave D{-5}. A decline below today’s low at 7399 would be the first warning that the rise is weakening, but would not by itself confirm the start of E{-5}. A decline below Tuesday’s low at 7363.25 would be a stronger warning. A deeper decline toward the 7252 area would provide more meaningful evidence that wave E{-5} is underway.
9:35 a.m. New York tim
What’s happening now. The S&P 500 E-mini futures dropped sharply into the 7410s when the Producer Price Index was published an hour before the opening bell. The April PPI rose by 1.4% compared with the prior month.
What does it mean? Wave D{-5} in Elliott Wave Theory still continues to rise. The low so far today remains above Tuesday’s low in the 7360s, so the wave’s net movement remains up.
It’s also true that wave D{-5} is near its end, and any higher high has the potential to become both the endpoint of D{-5} and the starting point of declining wave E{-5}.
All of this is taking place within wave 4{-4}, a downward correction that began last October and is taking the form of an Expanding Triangle. Wave E{-5} will be the final subwave of the Triangle and, under the usual Elliott Wave structure for a triangle leg, should contain three subwaves.
Decision Points. A move above 7454.75 would extend wave D{-5} and keep rising wave C{-6} alive. A decline below today’s post-PPI low in the 7410s would show renewed weakness, but would not by itself end D{-5}. A decline below Tuesday’s low at 7363.25 would be the first stronger warning that D{-5} may have ended. A deeper decline toward the 7252 area would provide more meaningful evidence that wave E{-5} is underway.
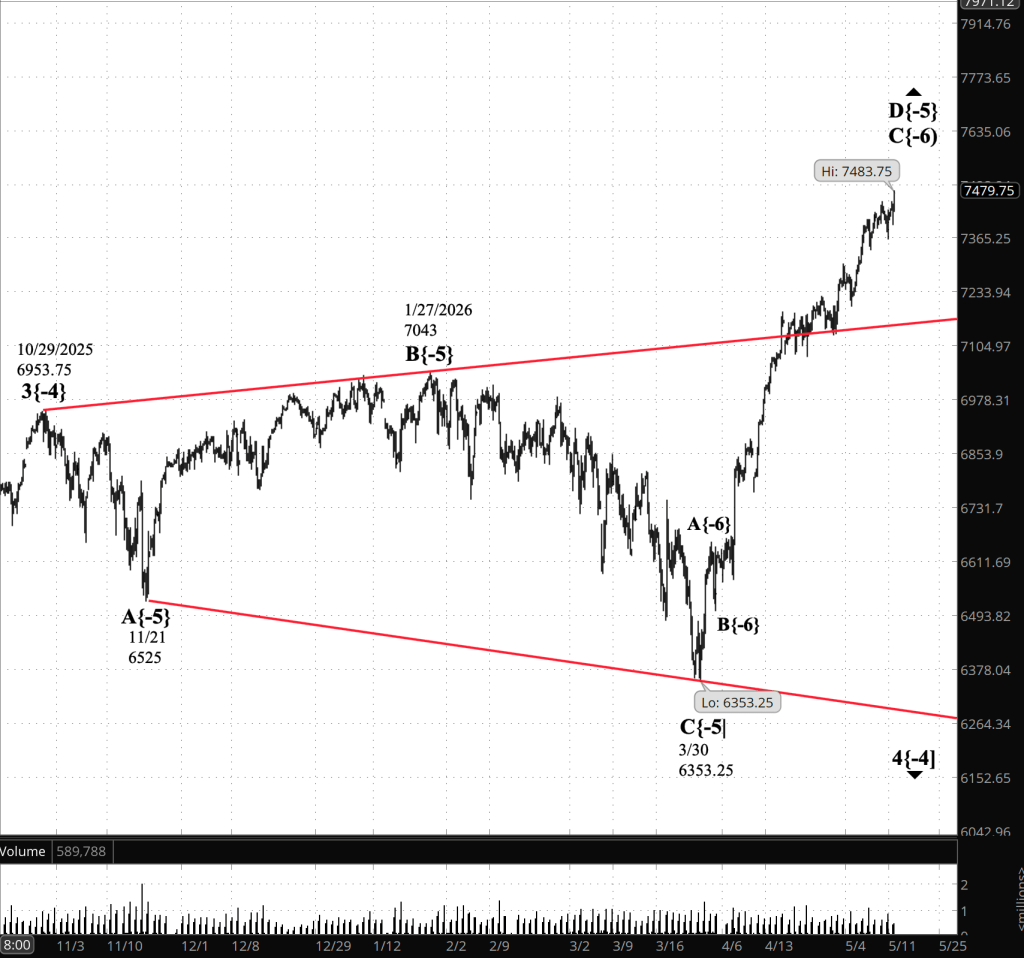
[S&P 500 E-mini futures 3:30 p.m., 5-hour bars with volume]
Waves Now Underway
These are the waves currently in progress under my principal analysis. Each line on the list shows the wave number, with the subscript in curly brackets, the traditional degree name, the starting date, the starting price of the S&P 500 E-mini futures, and the direction of the wave.
- S&P 500 Index:
- 5{+3} Supercycle, 7/8/1932, 4.40 (up)
- 5{+2} Cycle, 12/9/1974, 60.96 (up)
- 5{+1} Primary, 3/6/2009, 666.79 (up)
- 5{0} Intermediate, 2/11/2016, 1810.10 (up)
- 3{-1} Minor, 3/23/2020, 2191.36 (up)
- 1{-2} Minute, 7/31/2025, 6468.50 (down)
- S&P 500 E-mini futures
- 5{-3} Minuette 8/1/2025, 6239.50 (up}
- 4{-4} Subminutte 10/29/2025, 6953.75 (down}
- D{-5} Micro, 3/30/2026, 6353.25 (up}
- C{-6} Submicro, 4/2/2026, 6503.75 (up)
Reading the chart. Price movements — waves – – in Elliott Wave Theory analysis are labeled with numbers within trending waves and letters with corrective waves. The subscripts — numbers in curly brackets — designate the wave’s degree, which, in Elliott Wave analysis, means the relative position of a wave within the larger and smaller structures that make up the chart. R.N. Elliott, who in the 1930s developed the form of analysis that bears his name, viewed the chart as a complex structure of smaller waves nested within larger waves, which in turn are nested within still larger waves. In mathematics it’s called a fractal structure, where at every scale the pattern is similar to the others.
Learning and other resources. Elliott Wave analysis provides context, not prophecy. As the 20th century semanticist Alfred Korzybski put it in his book Science and Sanity (1933), “The map is not the territory … The only usefulness of a map depends on similarity of structure between the empirical world and the map.” And I would add, in the ever-changing markets, we can judge that similarity of structure only after the fact.
See the menu page Analytical Methods for a rundown on where to go for information on Elliott Wave analysis.
By Tim Bovee, Portland, Oregon, May 13, 2026
Disclaimer
Tim Bovee, Private Trader tracks the analysis and trades of a private trader managing his own accounts. The content reflects my interpretation of market structure, including Elliott Wave Theory and related tools.
Nothing in this blog constitutes a recommendation to buy or sell stocks, options, or any other financial instrument, or to pursue any particular strategy. The purpose of this blog is education and entertainment.
No trader is ever 100 percent successful. Trading in stock and options markets involves risk and uncertainty. Each trader must make decisions for his or her own account and accept full responsibility for the outcomes.
Charts and tools are used to support my personal analysis. Any data displayed is illustrative of that analytical process and is not presented as a source of market data for redistribution.
All content on Tim Bovee, Private Trader by Timothy K. Bovee is licensed under a Creative Commons Attribution-ShareAlike 4.0 International License.
License
Based on work at www.timbovee.com

You must be logged in to post a comment.