3:30 p.m. New York time
Half an hour before the closing bell. The S&P 500 futures reached a session high of 7476.75 and then retreated to slightly below the 7410s then back. The movement has the feel of testing rather than commitment, with neither direction yet taking control.
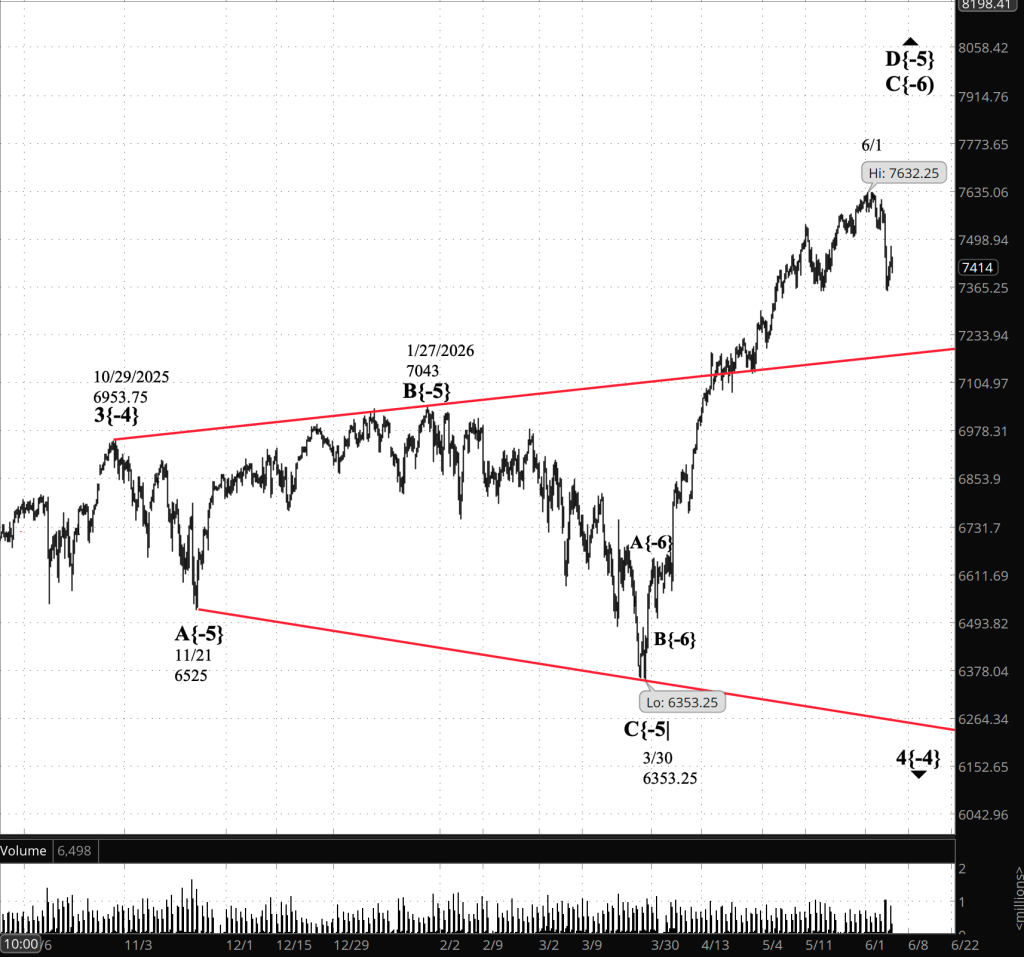
Elliott Wave Theory: As was the case this morning, the futures remain unclear about where they are headed. If up, then rising wave D{-5} continues. If down, then falling wave E{-5} may be underway, but the distance covered still is not large enough to call it confirmation.
Decision Points. A rise above 7476.75 would return the short-term advantage to the upside, although the larger D{-5} count would not be strongly restored unless the futures eventually challenge the June 1 high of 7632.25. A fall below 7423 would keep the possible E{-5} scenario alive and point toward a test of the overnight low of 7355.50. A fall below 7355.50 would strengthen the E{-5} interpretation, but confirmation would still require a break below the upper boundary of the Expanding Triangle that began Oct. 29, 2025. Until one of those levels breaks, the analysis remains in transition.
9:35 a.m. New York time
What’s happening now? The S&P 500 E-mini futures fell slightly as trading resumed overnight, to a low of 7355.50, and then began to rise, reaching the 7470s as the opening bell approached. The overnight recovery was steady, but it remained well below the June 1 high of 7632.25.
What does it mean? Elliott Wave Theory. Rising wave D{-5} remains the working count, although the June 1 high remains a plausible candidate for the end of D{-5}. The decline from that high has been large enough to raise the possibility that falling wave E{-5} has begun, but it has not yet produced operational confirmation. That confirmation would come with a fall below the upper boundary of the Expanding Triangle that began Oct. 29, 2025.
Decision Points. A move above 7632.25 would extend wave D{-5} and restore the upward count without much ambiguity. A renewed fall below 7355.50 would keep the possible E{-5} scenario alive, but still would not confirm it unless the decline continues to the triangle boundary and breaks below it. Until then, the analysis remains in transition: D{-5} is still the active label, but E{-5} is a credible developing alternative.
[S&P 500 E-mini futures 3:30 p.m., 2-hour bars with volume]
Waves Now Underway
These are the waves currently in progress under my principal analysis. Each line on the list shows the wave number, with the subscript in curly brackets, the traditional degree name, the starting date, the starting price of the S&P 500 E-mini futures, and the direction of the wave.
- S&P 500 Index:
- 5{+3} Supercycle, 7/8/1932, 4.40 (up)
- 5{+2} Cycle, 12/9/1974, 60.96 (up)
- 5{+1} Primary, 3/6/2009, 666.79 (up)
- 5{0} Intermediate, 2/11/2016, 1810.10 (up)
- 3{-1} Minor, 3/23/2020, 2191.36 (up)
- 1{-2} Minute, 7/31/2025, 6468.50 (down)
- S&P 500 E-mini futures
- 5{-3} Minuette 8/1/2025, 6239.50 (up}
- 4{-4} Subminutte 10/29/2025, 6953.75 (down}
- D{-5} Micro, 3/30/2026, 6353.25 (up}
- C{-6} Submicro, 4/2/2026, 6503.75 (up)
Reading the chart. Price movements — waves – – in Elliott Wave Theory analysis are labeled with numbers within trending waves and letters with corrective waves. The subscripts — numbers in curly brackets — designate the wave’s degree, which, in Elliott Wave analysis, means the relative position of a wave within the larger and smaller structures that make up the chart.R.N. Elliott, who in the 1930s developed the form of analysis that bears his name, viewed the chart as a complex structure of smaller waves nested within larger waves, which in turn are nested within still larger waves. In mathematics it’s called a fractal structure, where at every scale the pattern is similar to the others.
Learning and other resources. Elliott Wave analysis provides context, not prophecy. As the 20th century semanticist Alfred Korzybski put it in his bookScience and Sanity(1933), “Themapis not theterritory… The only usefulness of a map depends on similarity of structure between the empirical world and the map.” And I would add, in the ever-changing markets, we can judge that similarity of structure only after the fact.
See the menu pageAnalytical Methodsfor a rundown on where to go for information on Elliott Wave analysis.
By Tim Bovee, Portland, Oregon, June 8, 2026
Disclaimer
Tim Bovee, Private Trader tracks the analysis and trades of a private trader managing his own accounts. The content reflects my interpretation of market structure, including Elliott Wave Theory and related tools.
Nothing in this blog constitutes a recommendation to buy or sell stocks, options, or any other financial instrument, or to pursue any particular strategy. The purpose of this blog is education and entertainment.
No trader is ever 100 percent successful. Trading in stock and options markets involves risk and uncertainty. Each trader must make decisions for his or her own account and accept full responsibility for the outcomes.
Charts and tools are used to support my personal analysis. Any data displayed is illustrative of that analytical process and is not presented as a source of market data for redistribution.
All content onTim Bovee, Private TraderbyTimothy K. Boveeis licensed under aCreative Commons Attribution-ShareAlike 4.0 International License.
License
Based on work atwww.timbovee.com

You must be logged in to post a comment.