3:30 p.m. New York time
Half an hour before the closing bell. The S&P 500 futures spent much of the session fluctuating between the 7640s and the 7670s, before resuming their decline late in the session and reaching a session low in the 7620s, the lowest the current decline has gone since it began on August 13.
Elliott Wave Theory. Falling wave A{-6} within falling wave E{-5} continues. The decline remains within the third wave of wave A{-6}, although the degree of that third wave remains uncertain.
Decision Points. The late-session move to a new low strengthens the case that wave A{-6} remains underway. There is no chart evidence yet that the decline has completed. Any substantial reversal would begin another wave at some degree, but only subsequent price action will tell us where that turn belongs within the Elliott Wave hierarchy.
9:35 a.m. New York time
What’s happening now? The S&P 500 E-mini futures declined overnight, from an early high of 7708 down into the 7640s.
What does it mean? Elliott Wave Theory sees the decline as wave E{-5}, the final subwave within wave 4{-4}, a downward correction that began on October 29, 2025.
Wave 4{-4} has taken the form of an expanding triangle, meaning that each rising subwave goes higher than the previous rising subwave, and each falling subwave goes lower than the previous falling subwave. Expanding triangles tend to take more time to reach completion, and wave 4{-4} is certainly an example of that.
One way to gauge the future width of the triangle is to draw lines connecting the beginning of wave A with the end of wave B, setting a boundary for future rising waves, and the end of wave A with the end of wave C, setting a boundary for future falling waves.
Note that the lines, in blue on the chart, are boundaries, not fences. Boundaries can be crossed, and that’s what the next-to-the-last subwave, rising wave D{-5}, did, big time. Now that the final subwave, falling wave E{-5}, is underway, it is heading toward the lower boundary, where it may end, fall short or perhaps move beyond.
It is difficult to know for sure which wave within wave E{-5} is underway. We can tell from the chart that the decline within wave A{-6} is now in its third wave. What we don’t know for sure is the degree of those three waves—whether they are one degree below wave A{-6}, or several degrees lower. (See the “Reading the chart” section below.)
As is so often the conclusion in Elliott Wave Theory: Time will tell.
Decision Points. Falling waves E{-5} and A{-6} remain underway. The overnight decline gives no persuasive evidence that wave A{-6} has reached an end; the 5-minute chart continues to show lower highs and lower lows. The next important structural milestone will be a return within the expanding triangle, below its upper boundary. A rise above the August 13 high of 7838.50 would require reconsideration of the present wave count.
The Chart. The chart focuses on the current declining wave E{-5} and the other subwaves within the expanding triangle that is wave 4{-4}, a downward correction.
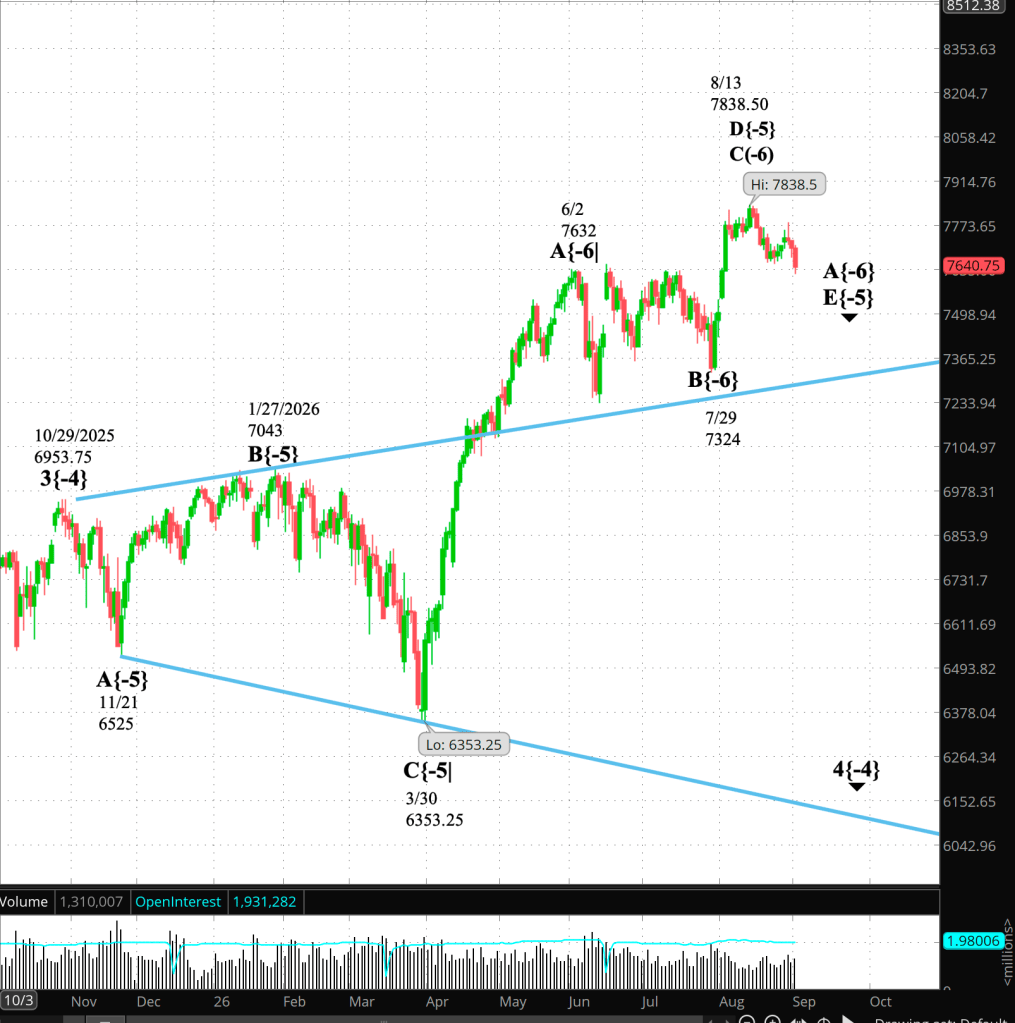
[S&P 500 E-mini futures 3:30 p.m., 1-day bars with volume]
Waves Now Underway
These are the waves currently in progress under my principal analysis. Each line on the list shows the wave number, with the subscript in curly brackets, the traditional degree name, the starting date, the starting price of the S&P 500 E-mini futures, and the direction of the wave.
- S&P 500 Index:
- 5{+3} Supercycle, 7/8/1932, 4.40 (up)
- 5{+2} Cycle, 12/9/1974, 60.96 (up)
- 5{+1} Primary, 3/6/2009, 666.79 (up)
- 5{0} Intermediate, 2/11/2016, 1810.10 (up)
- 3{-1} Minor, 3/23/2020, 2191.36 (up)
- 1{-2} Minute, 7/31/2025, 6468.50 (down)
- S&P 500 E-mini futures
- 5{-3} Minuette 8/1/2025, 6239.50 (up)
- 4{-4} Subminuette 10/29/2025, 6953.75 (down)
- E{-5} Micro, 8/13/2026, 7838.50 (down)
- A{-6} Submicro, 8/13/2026, 7838.50 (down)
Reading the chart. Price movements — waves – – in Elliott Wave Theory analysis are labeled with numbers within trending waves and letters with corrective waves. The subscripts — numbers in curly brackets — designate the wave’s degree, which, in Elliott Wave analysis, means the relative position of a wave within the larger and smaller structures that make up the chart.R.N. Elliott, who in the 1930s developed the form of analysis that bears his name, viewed the chart as a complex structure of smaller waves nested within larger waves, which in turn are nested within still larger waves. In mathematics it’s called a fractal structure, where at every scale the pattern is similar to the others.
Learning and other resources. Elliott Wave analysis provides context, not prophecy. As the 20th century semanticist Alfred Korzybski put it in his book Science and Sanity(1933), “The map is not the territory… The only usefulness of a map depends on similarity of structure between the empirical world and the map.” And I would add, in the ever-changing markets, we can judge that similarity of structure only after the fact.
See the menu pageAnalytical Methods for a rundown on where to go for information on Elliott Wave analysis.
By Tim Bovee, Portland, Oregon, September 1, 2026
Disclaimer
Tim Bovee, Private Trader tracks the analysis and trades of a private trader managing his own accounts. The content reflects my interpretation of market structure, including Elliott Wave Theory and related tools.
Nothing in this blog constitutes a recommendation to buy or sell stocks, options, or any other financial instrument, or to pursue any particular strategy. The purpose of this blog is education and entertainment.
No trader is ever 100 percent successful. Trading in stock and options markets involves risk and uncertainty. Each trader must make decisions for his or her own account and accept full responsibility for the outcomes.
Charts and tools are used to support my personal analysis. Any data displayed is illustrative of that analytical process and is not presented as a source of market data for redistribution.
All content on Tim Bovee, Private Trader byTimothy K. Boveeis licensed under a Creative Commons Attribution-ShareAlike 4.0 International License.
License
Based on work atwww.timbovee.com


You must be logged in to post a comment.