9:35 a.m. New York time.
What’s Happening Now?
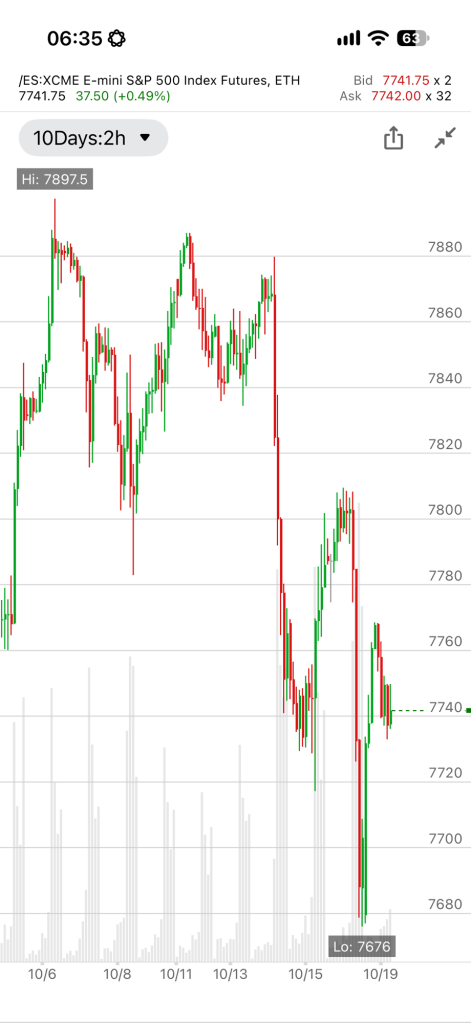
Half an hour before the opening bell. The S&P 500 E-mini futures were trading in the 7730s Monday morning, following a sharp decline on Friday that carried the price to 7676, the lowest level since the October 8 peak at 7897.50.
The price rebounded from Friday’s low, rising into the 7760s before turning downward again. The movement leaves the futures well below their October 8 peak but above Friday’s low.
The decline from October 8 remains the dominant movement on the two-hour chart, although substantial upward corrections have interrupted its progress.
What Does It Mean?
Elliott Wave Theory. The October 8 peak at 7897.50 marked the end of rising wave D{-5} and the beginning of declining wave E{-5}, the final wave within an expanding triangle that began forming on October 29, 2025.
An expanding triangle consists of five major waves, labeled A, B, C, D and E, with alternating downward and upward movements. Unlike a contracting triangle, its boundaries spread farther apart as the pattern develops. Each major wave contains three subdivisions, producing a complex sequence of advances and declines.
Wave E{-5} is the fifth and final wave of the triangle. It is expected to unfold in three major subdivisions: declining A{-6}, rising B{-6} and declining C{-6}.
At smaller degrees, the movements become more complex. Within ordinary corrective patterns, A waves can contain three or five subdivisions, B waves ordinarily contain three, and C waves generally contain five. These smaller structures combine to produce the larger movements visible on the chart.
The present decline is within A{-6}, the first subdivision of E{-5}.
Friday’s low at 7676 marked the completion of a declining A wave at a smaller, presently unidentified degree. A rising B-wave correction is now underway, although the rebound has already encountered renewed selling.
The degree of this smaller A-B sequence cannot yet be established reliably. Several additional degrees may separate the current movement from A{-6}. Further price development will be necessary before those intermediate waves can be identified.
The distinction matters. A rising B wave within a larger decline is a correction, not necessarily the beginning of a sustained advance. Once the B wave ends, a declining C wave would ordinarily follow at the same degree.
The duration of the larger movement is also uncertain. Wave D{-5} developed over months, and E{-5} could take a comparable amount of time. Elliott Wave Theory establishes the expected sequence of waves, not a dependable timetable for their completion.
The Chart
9:35 a.m. New York time
The two-hour chart begins near the October 8 peak and shows the early development of declining wave E{-5}.
The currently identified wave structure is:
- E{-5} — Falling. The final wave of the expanding triangle.
- A{-6} — Falling. The first of three major subdivisions within E{-5}.
- Wave B — Rising. A correction of the decline that ended October 16 at 7676. Its degree remains unidentified.
The October 16 low completed a wave A somewhere within the developing A{-6} structure. The intervening degrees have not yet been established.
As additional waves develop, their relationships may become clear enough to identify and label the missing degrees.
Until then, the chart provides the price history, while this section describes the Elliott Wave structure that the chart cannot presently display.
Decision Points
The October 16 low at 7676 is the immediate downside reference. A decline below that level would require reassessing whether the present B-wave correction has ended or whether the smaller wave structure needs revision.
On the upside, the rebound into the 7760s provides a nearby reference for the developing correction. A move above that area would support further recovery within the working B-wave count, without necessarily changing the larger bearish interpretation.
The October 8 peak at 7897.50 remains the principal reference for the beginning of E{-5}. A sustained rise beyond that peak would require reconsideration of the current triangle count.
The larger expectation remains for declining E{-5} to continue unfolding through its component waves. The timing and depth of that decline remain unknown.
For now, the appropriate approach is to follow the developing structure, identify the missing wave degrees as the evidence permits, and avoid treating a smaller upward correction as a reversal of the larger trend.
Waves now underway. Price movements — waves – – in Elliott Wave Theory analysis are labeled with numbers within trending waves and letters with corrective waves. The subscripts — numbers in curly brackets — designate the wave’s degree, which, in Elliott Wave analysis, means the relative position of a wave within the larger and smaller structures that make up the chart. R.N. Elliott, who in the 1930s developed the form of analysis that bears his name, viewed the chart as a complex structure of smaller waves nested within larger waves, which in turn are nested within still larger waves. In mathematics it’s called a fractal structure, where at every scale the pattern is similar to the others.
Learning and other resources. Elliott Wave analysis provides context, not prophecy. As the 20th century semanticist Alfred Korzybski put it in his book Science and Sanity (1933), “The map is not the territory … The only usefulness of a map depends on similarity of structure between the empirical world and the map.” And I would add, in the ever-changing markets, we can judge that similarity of structure only after the fact.
See the menu page Analytical Methods for a rundown on where to go for information on Elliott Wave analysis.
By Tim Bovee, Portland, Oregon, October 19, 2026
Disclaimer
Tim Bovee, Private Trader tracks the analysis and trades of a private trader for his own accounts. Nothing in this blog constitutes a recommendation to buy or sell stocks, options or any other financial instrument. The only purpose of this blog is to provide education and entertainment.
No trader is ever 100 percent successful in his or her trades. Trading in the stock and option markets is risky and uncertain. Each trader must make trading decisions for his or her own account, and take responsibility for the consequences.
All content on Tim Bovee, Private Trader by Timothy K. Bovee is licensed under a Creative Commons Attribution-ShareAlike 4.0 International License.
Based on work at www.timbovee.com

