3:30 p.m. New York time
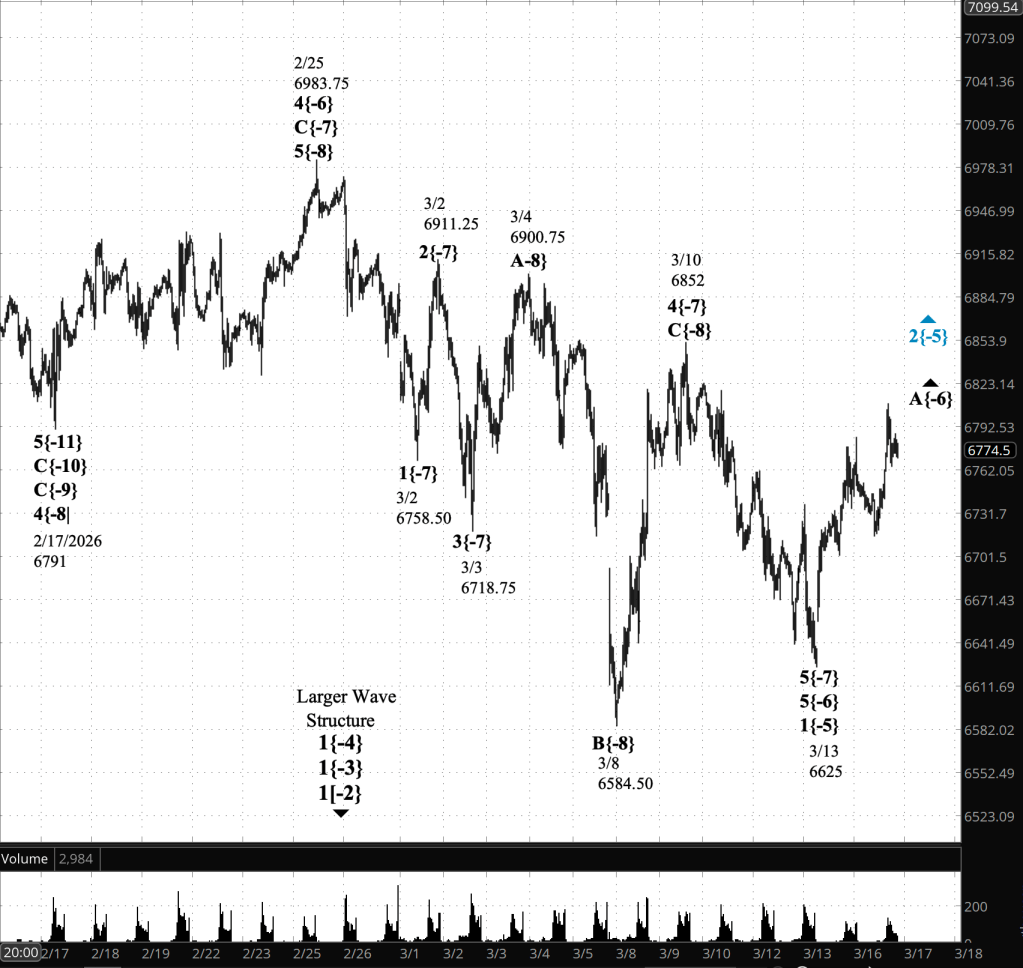
Half an hour before the closing bell. The S&P 500 futures fell further during the session, so far reaching into the 6410s.
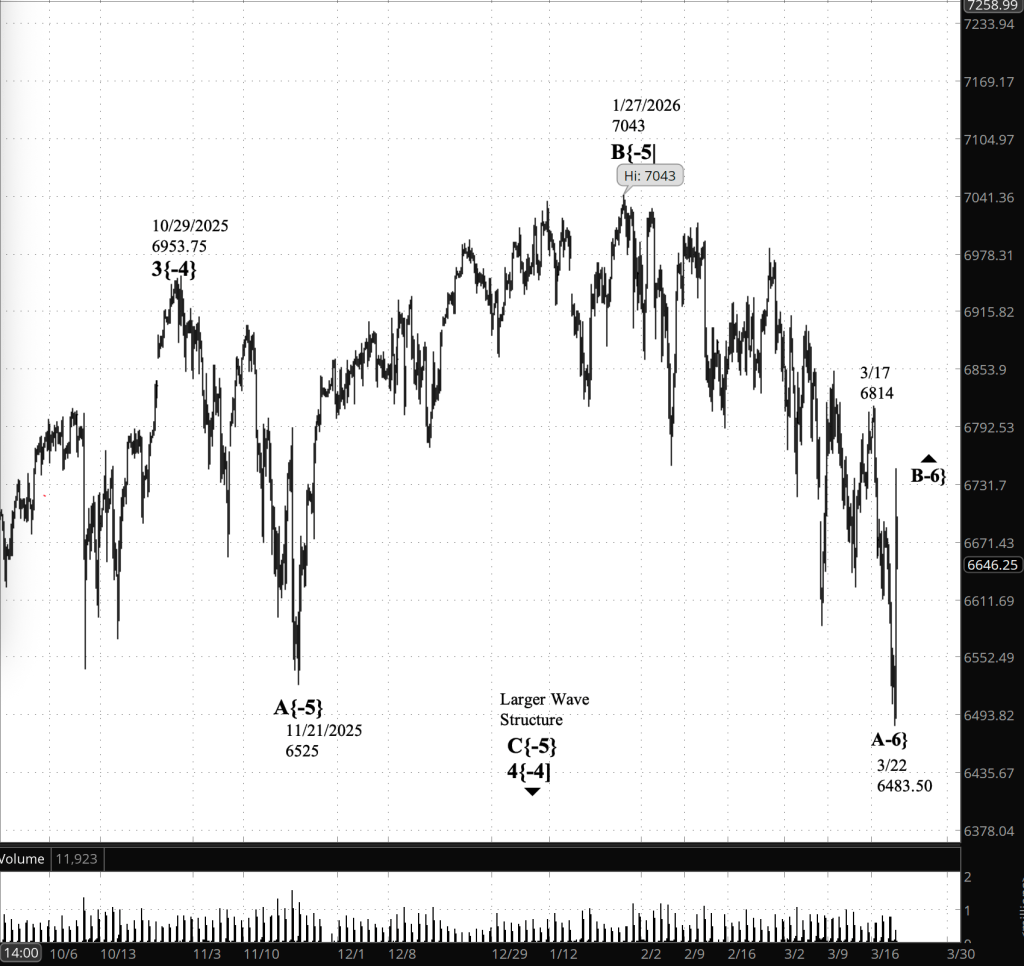
Elliott Wave Theory. The revision of the wave count described in this morning’s analysis continues. Wave A{-6}, which began on January 27, continues its decline. The internal subwave structure is not clear; it lacks the definition needed for confident analysis at smaller degrees. Until that clarity develops, I will track the decline at the A{-6} level, the smallest degree that can be followed with reasonable confidence.
A completed wave A{-6} will be followed by a countertrend rally, rising wave B{-6}. There is as yet no clear evidence that such a turn has begun.
9:35 a.m. New York time
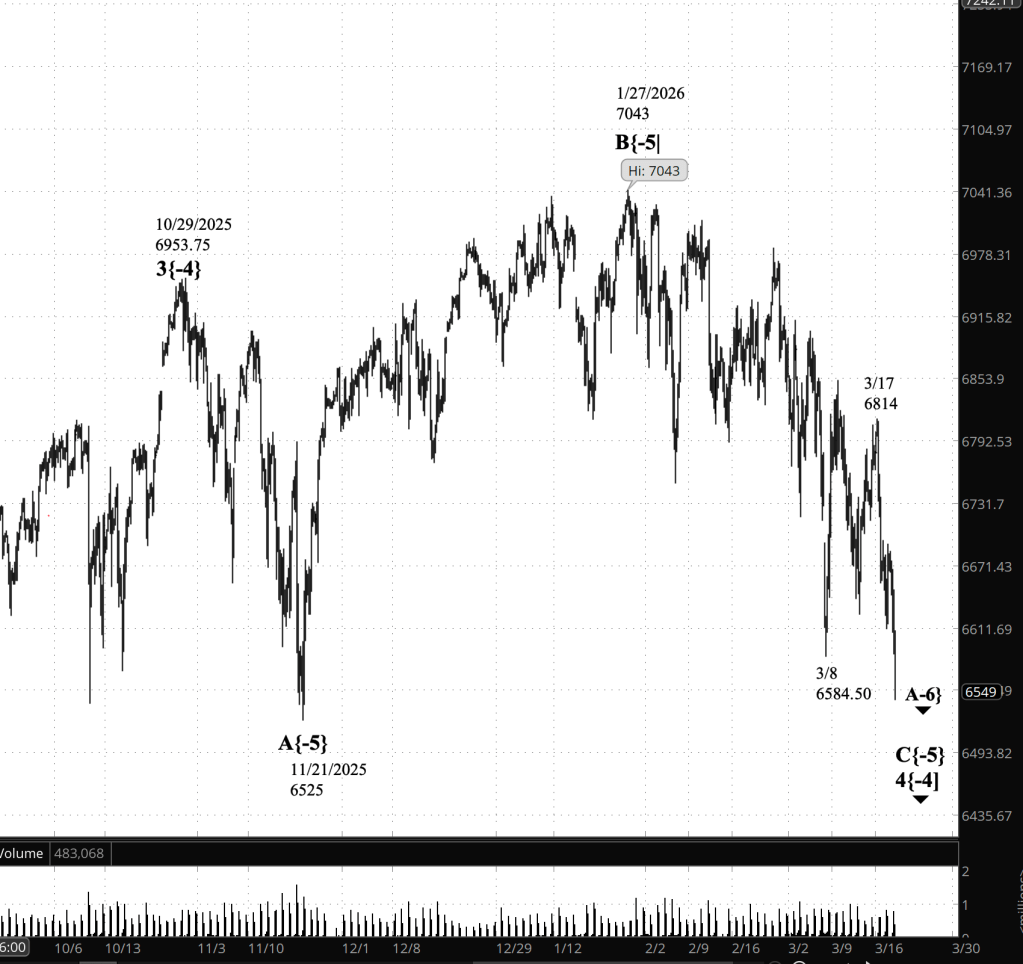
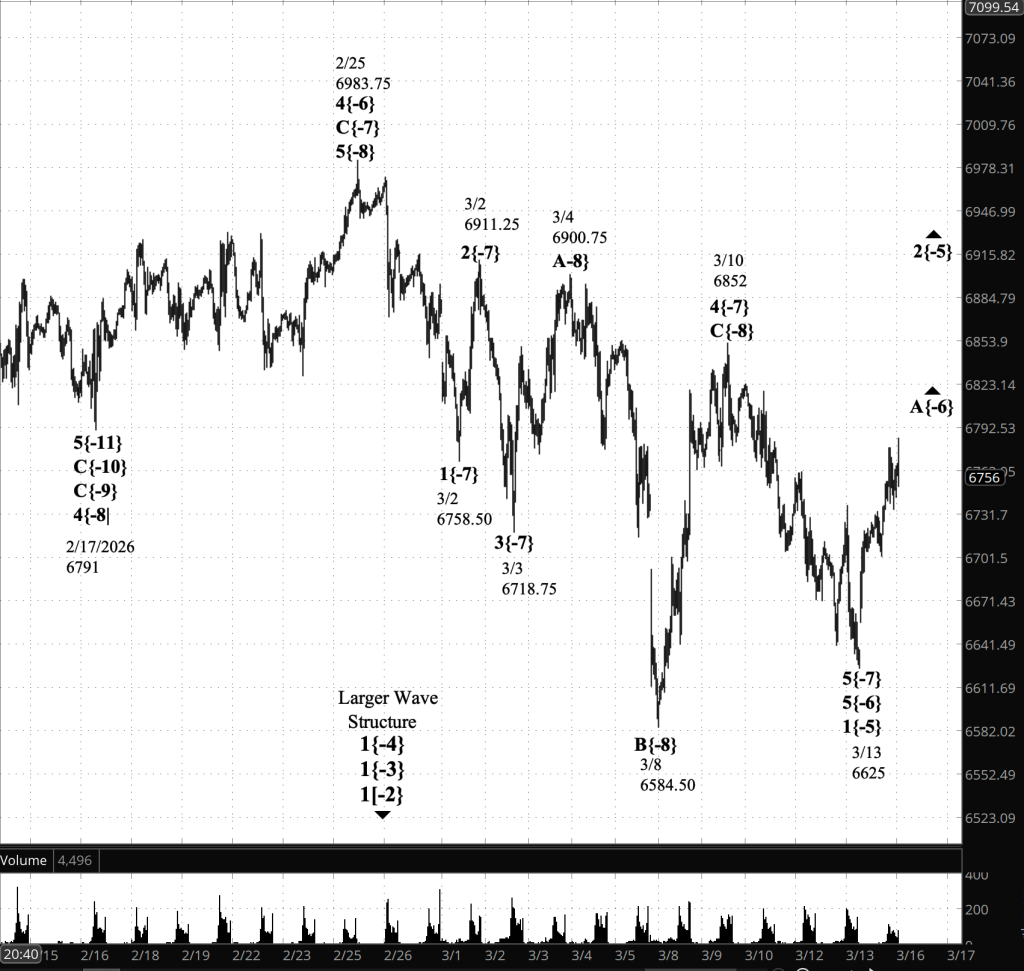
What’s happening now? The S&P 500 E-mini futures fell overnight and, so far on day 5 of the decline, have reached a low in the 6470s.
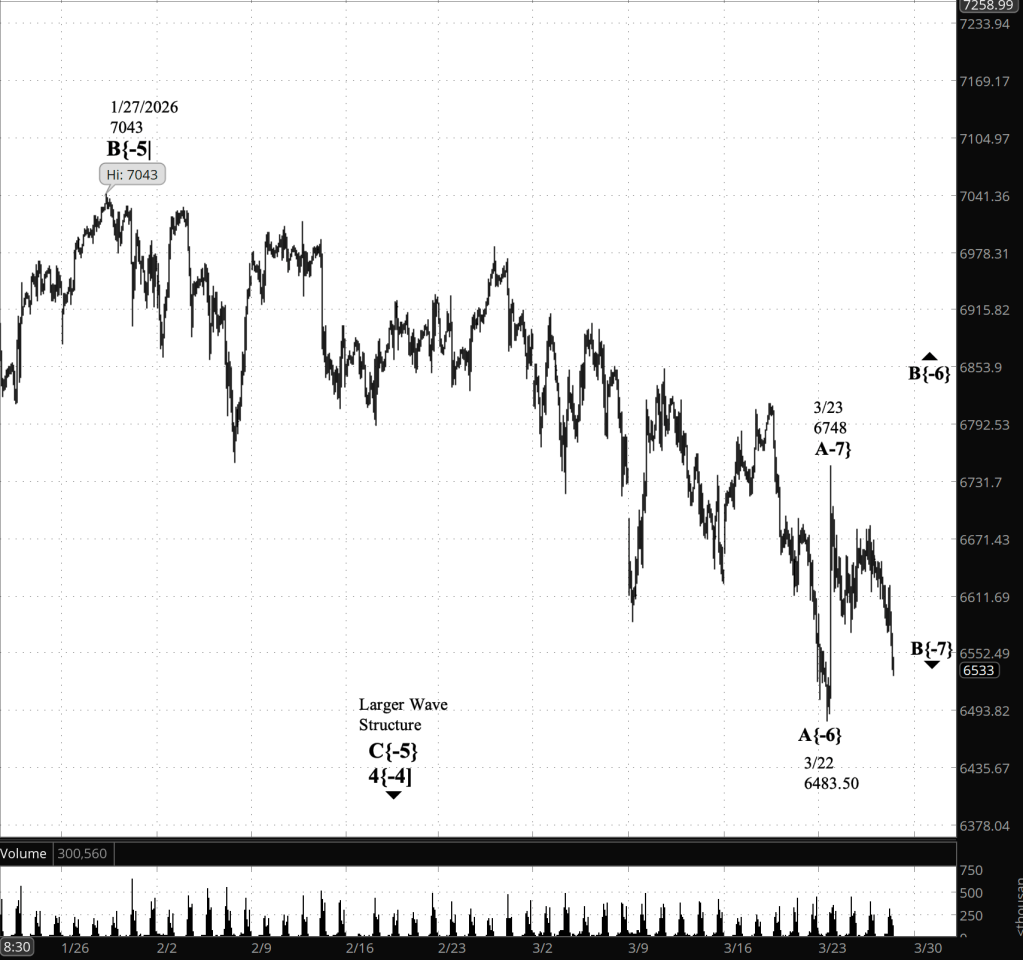
What does it mean? The decline has now moved below the prior A{-6} low, which by itself does not violate any Elliott Wave rule—B waves can, in some patterns, retrace beyond the start of A. However, the character of the move argues against labeling it as a B{-7} correction. Instead of showing a choppy, overlapping, three-wave structure typical of a corrective phase, the market has continued to press lower in a persistent, directional manner, with only brief and shallow pauses. That behavior is more consistent with an ongoing impulsive decline. On that basis, the preferred interpretation is that wave A{-6} is still unfolding, and that the expected B{-6} rebound has not yet begun.
Based on the nature of the wave structure, the map no longer matches the territory, and I have redrawn the map.
Decision points. The immediate focus is on whether the current decline continues or begins to stabilize. A break and hold below the overnight low in the 6470 area would signal that wave A{-6} is still extending downward, with lower levels likely to follow. On the upside, a sustained move back above 6525–6540 would be the first indication that selling pressure is easing. A rise above 6565 would strengthen the case that a short-term low is in place and that a corrective bounce, likely wave B{-7}, is underway.
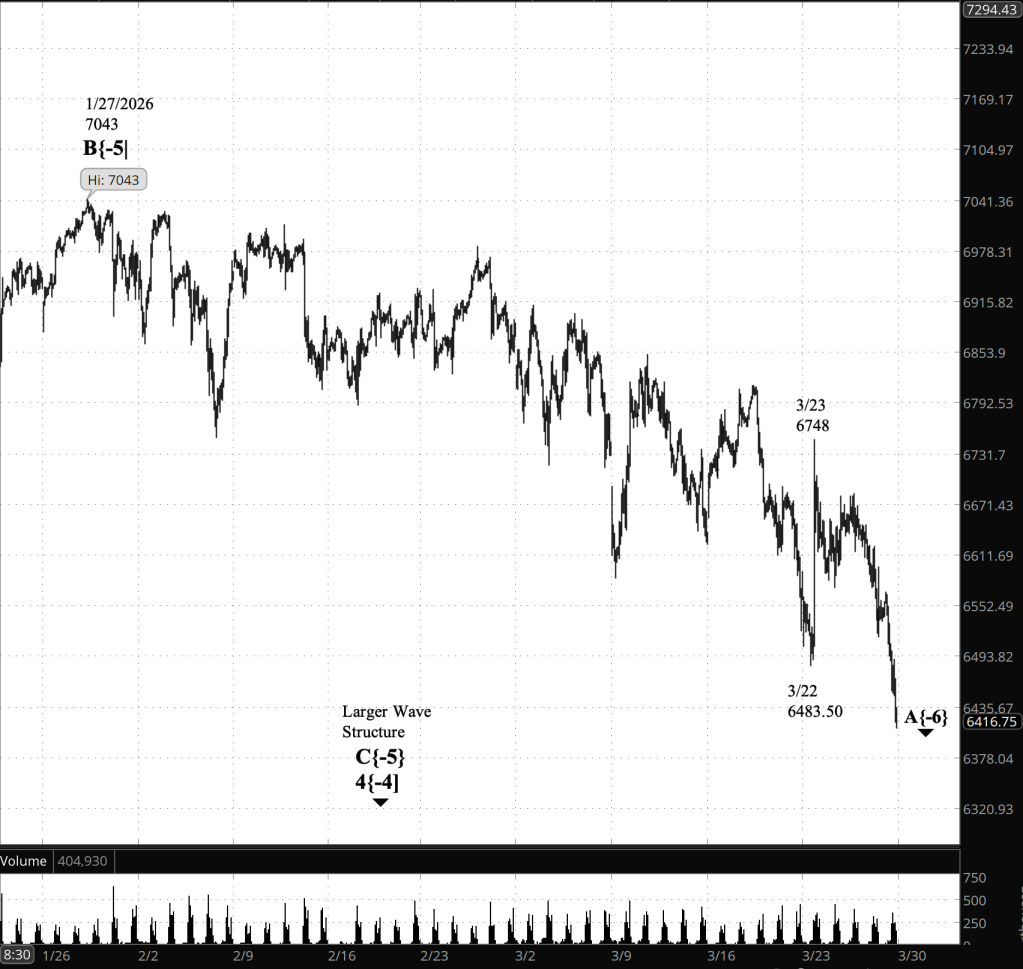
[S&P 500 E-mini futures at 3:30 p..m., 90-minute bars with volume]
Waves Now Underway
These are the waves currently in progress under my principal analysis. Each line on the list shows the wave number, with the subscript in curly brackets, the traditional degree name, the starting date, the starting price of the S&P 500 E-mini futures, and the direction of the wave.
- S&P 500 Index:
- 5{+3} Supercycle, 7/8/1932, 4.40 (up)
- 5{+2} Cycle, 12/9/1974, 60.96 (up)
- 5{+1} Primary, 3/6/2009, 666.79 (up)
- 5{0} Intermediate, 2/11/2016, 1810.10 (up)
- 3{-1} Minor, 3/23/2020, 2191.36 (up)
- 1{-2} Minute, 7/31/2025, 6468.50 (down)
- S&P 500 E-mini futures
- 5{-3} Minuette 8/1/2025, 6239.50 (up}
- 4{-4} Subminutte 10/29/2025, 6953.75 (down}
- C{-5} Micro, 1/27/2026, 7043 (down}
- A{-6} (none), 1/27/2026, 7043 (down}
Reading the chart. Price movements — waves – – in Elliott Wave Theory analysis are labeled with numbers within trending waves and letters with corrective waves. The subscripts — numbers in curly brackets — designate the wave’s degree, which, in Elliott Wave analysis, means the relative position of a wave within the larger and smaller structures that make up the chart. R.N. Elliott, who in the 1930s developed the form of analysis that bears his name, viewed the chart as a complex structure of smaller waves nested within larger waves, which in turn are nested within still larger waves. In mathematics it’s called a fractal structure, where at every scale the pattern is similar to the others.
Learning and other resources. Elliott Wave analysis provides context, not prophecy. As the 20th century semanticist Alfred Korzybski put it in his book Science and Sanity (1933), “The map is not the territory … The only usefulness of a map depends on similarity of structure between the empirical world and the map.” And I would add, in the ever-changing markets, we can judge that similarity of structure only after the fact.
See the menu page Analytical Methods for a rundown on where to go for information on Elliott Wave analysis.
By Tim Bovee, Portland, Oregon, March 27, 2026
Disclaimer
Tim Bovee, Private Trader tracks the analysis and trades of a private trader for his own accounts. Nothing in this blog constitutes a recommendation to buy or sell stocks, options or any other financial instrument. The only purpose of this blog is to provide education and entertainment.
No trader is ever 100 percent successful in his or her trades. Trading in the stock and option markets is risky and uncertain. Each trader must make trading decisions for his or her own account, and take responsibility for the consequences.
All content on Tim Bovee, Private Trader by Timothy K. Bovee is licensed under a Creative Commons Attribution-ShareAlike 4.0 International License.
Based on work at www.timbovee.com

You must be logged in to post a comment.