Update 7/21/2022: I exited my short bull put vertical spread on AN, 29 days before expiration, for a $1.55 debit per contract/share, a wash before fees, meaning the exit and entry prices were the same. Shares were trading at $119.74, down $0.68 from the entry level.
The Implied Volatility Rank at exit was 29.1%, down 15.5 points from the entry level.
Although AN’s earnings beat the estimates, the price fell. I exited on the day after entry for neither a profit nor a loss. The exit point was 44.9% of maximum potential loss.
Shares fell by 0.6% over one day for a -206% annual rate. The options position produced neither a return nor a loss.
I have entered a short bull put vertical spread on AN, using options that trade for the last time 30 days hence, on August 19. The premium is a $1.55 credit per contract share and the stock at the time of entry was priced at $120.42.
The Implied Volatility Ratio stood at 44.6%.
Premium:
$1.55
Expire OTM
AN-bull put spread
Strike
Odds
Delta
Puts
Long
110.00
70.0%
26
Break-even
116.55
65.0%
30.5
Short
115.00
60.0%
35
The premium is 62% of the width of the position’s short/long spread. The profit zone covers a 3.2% move to the downside and an unlimited move to the upside.
The risk/reward ratio is 2.2:1, with maximum risk of $345 and maximum reward of $155 per contract.
How I chose the trade. The trade was placed to coincide with AN’s earnings announcement, before the opening bell on the day after entry. The short strikes were set to coincide with the expected move of $10.97 either way, based on options pricing, which gives a price range of $109.45 to $131.39.
By Tim Bovee, Portland, Oregon, July 20, 2022
Disclaimer
Tim Bovee, Private Trader tracks the analysis and trades of a private trader for his own accounts. Nothing in this blog constitutes a recommendation to buy or sell stocks, options or any other financial instrument. The only purpose of this blog is to provide education and entertainment.
No trader is ever 100 percent successful in his or her trades. Trading in the stock and option markets is risky and uncertain. Each trader must make trading decisions for his or her own account, and take responsibility for the consequences.
Half an hour before the closing bell. The S&P 500 rose during the session, from the low 3900s to a high of 3977.25, which is 13 points above the overnight high. The alternative analysis proved to be correct: Wave A{-13} within wave 4{-12} is still underway. This switch is the upward version of bottom fishing, where a trader tries to figure out where a trend has ended and has hit a false call. A reversal to the downside will trigger a return to this morning’s principal analysis, that wave A{-13} is over and B{-13} has begun, with a higher A-wave end point than this morning. I’ve updated the chart.
12:50 p.m. New York time
AN earnings play entry. I’ve entered short bull put vertical spread on AN, using options that trade for the last time on August 19, and have posted an analysis of the trade.
9:35 a.m. New York time
What’s happening now? The S&P 500 E-mini futures reached an overnight high of 3964.25 and then reversed.
What does it mean? The high marks the end of the first leg of an upward correction that began on July 14.
What is the alternative? It’s possible that the high marked the end of a subwave within the first leg of the still incomplete correction.
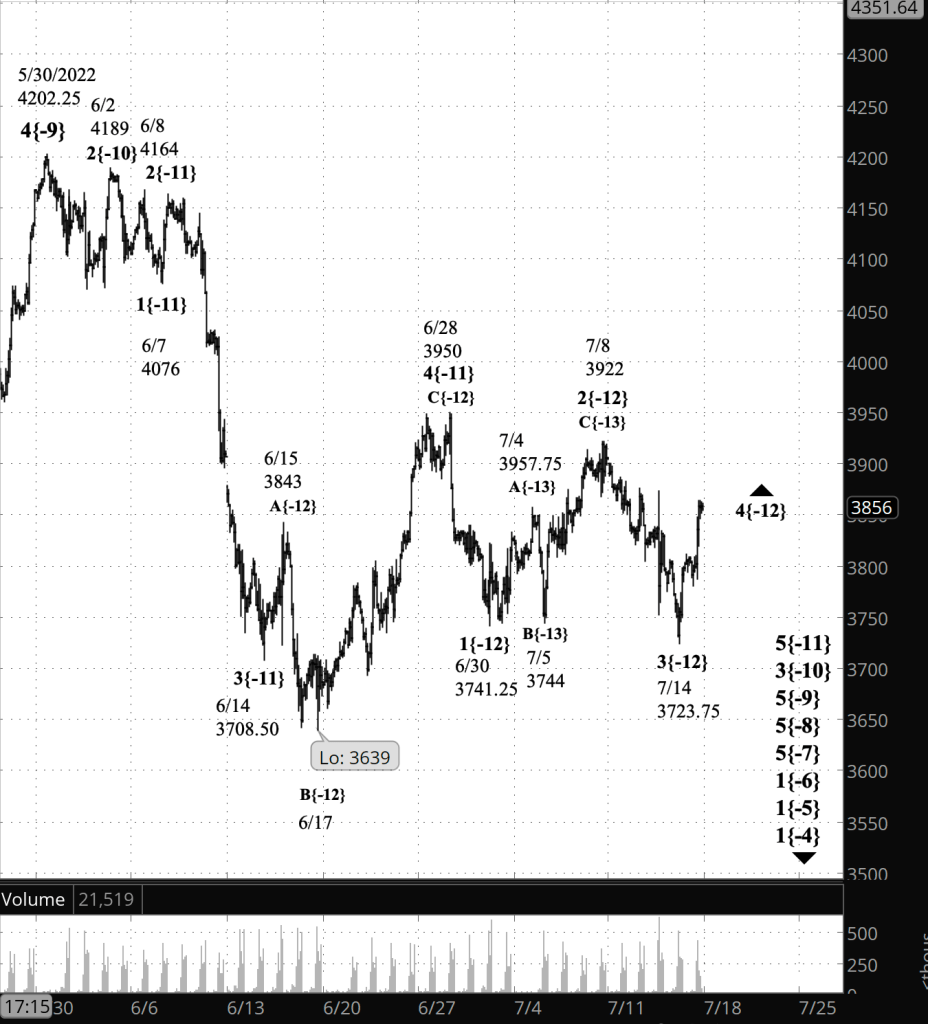
[S&P 500 E-mini futures at 3:30 p.m., 115-minute bars, with volume]
What does Elliott wave theory say? Under the principal analysis, the first leg, rising wave A{-13| of the upward correction, wave 4{-12}, has completed five waves internally, meaning that wave 4{-12} is taking the form of a Zigzag. Falling wave B{-13} has begun and will have three waves internally. This scenario means that the potential over the next few days is mainly to the downside.
Wave B{-13} will be followed by rising wave C{-13}, which will complete the correction, unless it takes a compound form, linking two or three corrective patterns together. In that latter case, wave C{-13} will be followed by a falling connector wave, X{-13}, and then a second corrective pattern.
Under the alternative analysis, wave A{-13} is not yet complete and wave B{-13} hasn’t yet begun. This scenario means that there is more upside potential in the next few days.
Wave 4{-12} and its subwaves are all happening within wave 5{-11}, which began on June 28, which in turn is a subwave of wave 3{-10}, which began on June 2 and is a subwave of wave 5{-9}, which began on May 30. They are all subwaves wave 5{-8}, which began on April 21 and is the smallest degree listed in “We Are Here”, below. Wave 5{-8}, in turn, has a series of parent and grandparent waves stretching up to downtrending wave 4{-1}, which began on January 4, and waves of even larger degree, up to uptrending wave 5{+3}, which began on July 8, 1932.
We Are Here.
These are the waves currently in progress under my principal analysis. Each line on the list shows the wave number, with the subscript in curly brackets, the traditional degree name, the starting date, the starting price of the S&P 500 E-mini futures, and the direction of the wave.
Learning and other resources. Elliott wave analysis provides context, not prophecy. As the 20th century semanticist Alfred Korzybski put it in his book Science and Sanity (1933), “The map is not the territory … The only usefulness of a map depends on similarity of structure between the empirical world and the map.” And I would add, in the ever-changing markets, we can judge that similarity of structure only after the fact.
See the menu page Analytical Methods for a rundown on where to go for information on Elliott wave analysis.
By Tim Bovee, Portland, Oregon, July 20, 2022
Disclaimer
Tim Bovee, Private Trader tracks the analysis and trades of a private trader for his own accounts. Nothing in this blog constitutes a recommendation to buy or sell stocks, options or any other financial instrument. The only purpose of this blog is to provide education and entertainment.
No trader is ever 100 percent successful in his or her trades. Trading in the stock and option markets is risky and uncertain. Each trader must make trading decisions for his or her own account, and take responsibility for the consequences.
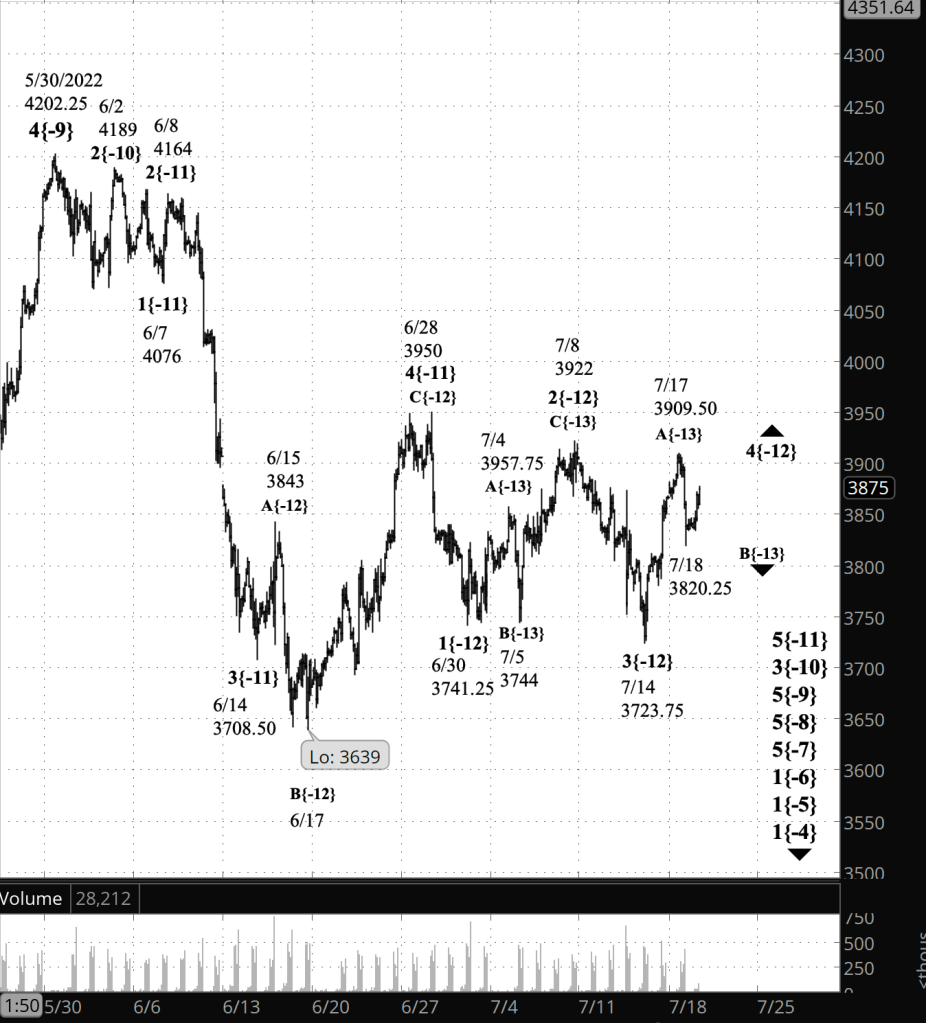
Half an hour before the closing bell. The S&P 500 futures swiftly climbed into the mid-3900s, moving above the July 17 peak, 3909.50. As noted in this morning’s alternative analysis, a move above that level requires a re-analysis of the chart.
Under the new scenario, the first segment, wave A{-13}, of the upward correction that began on July 14, wave 4{-12}, is still underway. Internally, the A wave is in its final subwave, wave 5{-14}. Since wave A{-13} contains five internal waves, the correction is taking the form of a Zigzag. The B{-13} wave that will follow will have three internal waves and will retrace 38% to 79% of wave A{-13}. the final wave within wave Zigzag, wave C{-13}, will if it is typical be about the same length as wave A{-13}.
I’ve left this morning’s chart as it was, and marked it as outdated. I’ve added a new chart that shows the revised analysis.
[Revised analysis: S&P 500 E-mini futures at 3:30 p.m., 115-minute bars, with volume]
10:40 a.m. New York time
HAL earnings play exit; no new positions today. I’ve exited my short bull put options spread on HAL for 17.9% of maximum potential profit, a bit below my 25% of max goal. I’ve updated the trade analysis with results.
No entries today. I have four prospects, in order of attractiveness as a trade — JBHT, MTB, PNFP and BIIB. But all were less liquid than my standards require.
9:35 a.m. New York time
What’s happening now? The S&P 500 E-mini futures reversed from yesterday’s session low, 3820.25, reaching back into the upper 3800s.
What does it mean? Yesterday’s low marked the end of the first internal wave within the declining middle leg of an upward correction that began on July 14.
What is the alternative? If the price moves above 3909.50, then yesterday’s low was a correction within the rising first leg of the upward correction.
[Outdated analysis: S&P 500 E-mini futures at 9:35 a.m., 115-minute bars, with volume]
What does Elliott wave theory say? Both the principal analysis and the alternative analysis agree that wave 4{-12}, an upward correction that began on July 14 from 3723.75, is still underway. The question is what form that 4th wave is taking: A Flat, which would be most common for a 4th wave, or a Zigzag, which is more common for 2nd waves but not unheard of for 4th waves.
If the form is a Flat, as the principal analysis has it, then wave A{-13} ended on July 17 with three internal waves, and wave B{-13} began on that date, has completed the first internal wave of three, and is now in its second internal wave.
If the form is a Zigzag, as the alternative analysis has it, then wave A{-13} is still underway. The July 17 high was the end of the third internal wave of five within wave A{-13}, the subsequent decline was the fourth wave and the present rise is the fifth wave.
A Flat pattern must match these rules: The B wave always retraces at least 90% of the preceding A wave, which would carry the price down to 3742.50 or more. The price usually retraces 100% up to 138% of the A wave. At present the price is well above those levels, and a failure to reach at least 3742.50 would disqualify the Flat scenario, forcing a re-analysis.
The Zigzag scenario is still in its A-wave, and so there are little in the way of rules or guidance. A 4th wave never moves beyond the start of the preceding 1st wave, which in the case of wave 1{-12} would be 3950. If the price reverses and rises above 3950, then the Zigzag scenario is disqualified, forcing a re-analysis.
The Flat scenario seems more likely to me, but there are no guarantees that it will actually play out that way, given the ambiguities on the chart.
Wave 4{-12} is a subwave of declining wave 5{-11}, itself a subwave of declining wave 3{-10}, which in turn is a subwave of declining wave 5{-9} within downtrending wave 5{-8}. At this point the list of waves within waves picks up with the “We Are Here” list, below. Long story short: Whatever the movements within wave 4{-12}, the larger trends are down.
We Are Here.
These are the waves currently in progress under my principal analysis. Each line on the list shows the wave number, with the subscript in curly brackets, the traditional degree name, the starting date, the starting price of the S&P 500 E-mini futures, and the direction of the wave.
Learning and other resources. Elliott wave analysis provides context, not prophecy. As the 20th century semanticist Alfred Korzybski put it in his book Science and Sanity (1933), “The map is not the territory … The only usefulness of a map depends on similarity of structure between the empirical world and the map.” And I would add, in the ever-changing markets, we can judge that similarity of structure only after the fact.
See the menu page Analytical Methods for a rundown on where to go for information on Elliott wave analysis.
By Tim Bovee, Portland, Oregon, July 19, 2022
Disclaimer
Tim Bovee, Private Trader tracks the analysis and trades of a private trader for his own accounts. Nothing in this blog constitutes a recommendation to buy or sell stocks, options or any other financial instrument. The only purpose of this blog is to provide education and entertainment.
No trader is ever 100 percent successful in his or her trades. Trading in the stock and option markets is risky and uncertain. Each trader must make trading decisions for his or her own account, and take responsibility for the consequences.
Update 7/19/2022: I exited my short bull put vertical spread on HAL, 31 days before expiration, for a $0.78 debit per contract/share, a profit before fees of $14 per contract. Shares were trading at $29.94, up $0.96 from the entry level.
The Implied Volatility Rank at exit was 69.1%, down 6.9 points from the entry level.
I exited on the day after entry for 17.9% of maximum potential profit, short of my goal for earnings plays of 25% of max. HAL beat projected earnings, as expected, but only by a little.
Shares rose by 3.3% over one day for a +1,209% annual rate. The options position produced a 21.9% return for a +7,984% annual rate.
I have entered a short bull put vertical spread on HAL, using options that trade for the last time 32 days hence, on August 19. The premium is a $0.78 credit per contract share and the stock at the time of entry was priced at $28.98.
The Implied Volatility Ratio stood at 76.0%.
Premium:
$0.78
Expire OTM
HAL-bull put spread
Strike
Odds
Delta
Puts
Long
25.50
74.0%
21
Break-even
28.78
64.7%
27
Short
28.00
55.4%
33
The premium is 62.4% of the width of the position’s short/long spread. The profit zone covers a 0.7% move to the downside and an unlimited move to the upside.
The risk/reward ratio is 2.2:1, with maximum risk of $172 and maximum reward of $78 per contract.
How I chose the trade. The trade was placed to coincide with HAL’s earnings announcement, before the opening bell on the day after entry. The short strikes were set to coincide with the expected move of $1.60 either way, based on options pricing, which gives a price range of $27.38 to $30.58.
By Tim Bovee, Portland, Oregon, July 18, 2022
Disclaimer
Tim Bovee, Private Trader tracks the analysis and trades of a private trader for his own accounts. Nothing in this blog constitutes a recommendation to buy or sell stocks, options or any other financial instrument. The only purpose of this blog is to provide education and entertainment.
No trader is ever 100 percent successful in his or her trades. Trading in the stock and option markets is risky and uncertain. Each trader must make trading decisions for his or her own account, and take responsibility for the consequences.
Half an hour before the closing bell. The S&P 500 has fallen during the session, reaching into the mid-3800s.
I’ve marked the overnight peak, 3909.50, as the end of wave A{-13}, the first leg of the upward correction that began on July 14, wave 4{-12}. Under this principal analysis, downward wave B{-13} is now underway and will have three internal waves.
An alternative is that the decline during the session is an internal wave within wave A{-13}. Given the brevity of the retracement within wave A{-13} shortly after it began, I consider this alternative to be almost as likely as the new principal analysis, above.
I’ve updated the chart.
2:30 p.m. New York time
Earnings plays, one entry and two exits. I’ve entered a short bull put spread on HAL, using options that trade for the last time on August 19 and have posted an analysis of the trade.
I also exited two positions — short bear call spreads that I had entered on Friday. I’ve updated the trade analyses for my options plays on GS and SYF with full results.
9:35 a.m. New York time
What’s happening now? The S&P 500 E-mini futures rose from the upper 3800s into the lower 3900s after trading resumed Friday evening, and then dropped back slightly.
What does it mean? The first leg of the upward correction that began on July 14 continues and may have ended with the overnight high, 3909.50.
What is the alternative? Although the first leg of the correction has met all of its requirements, the price could move higher still.
[S&P 500 E-mini futures at 3:30 p.m., 115-minute bars, with volume]
What does Elliott wave theory say? Wave A{-13}, the first leg of an upward correction, wave 4{-12}, has formed three waves internally, the pattern taken by A waves within Flats, which is the most common form assumed by 4th waves. The B wave — the middle segment — within wave A{-13} appears to be overly short, casting some doubt on the analysis. Nonetheless, I’ve seen such small B waves before, so it’s not a deal-breaker.
The alternative analysis recognizes that although 3909.50 could be the end of wave A{-13}, there’s no rule keeping the price from reversing and going higher.
Wave A{-13} will be followed by a B wave with three internal waves, and then by a C wave with five internal waves. Wave C{-13} will most likely be the final wave within wave 4{-12}. However, it’s possible that the 4th wave will form a compound structure, linking two or three corrective patterns together before reaching an end. If wave 4{-12} is a compound correction, wave C{-13} will be followed by a connector, wave X{-13}, and then the A wave of the next corrective pattern.
When wave 4{-12} is complete, it will be followed by wave 5{-12}, a resumption of the larger wave 5{-11} downtrend that began on June 28, which will likely carry the price into the 3600s and perhaps lower.
Wave 5{-11} is the final wave within wave 3{-10}, which in turn is the middle wave of wave 5{-9}, the final wave within wave 5{-8}, which began on April 21 from 4509. All are downtrending.
We Are Here.
These are the waves currently in progress under my principal analysis. Each line on the list shows the wave number, with the subscript in curly brackets, the traditional degree name, the starting date, the starting price of the S&P 500 E-mini futures, and the direction of the wave.
Learning and other resources. Elliott wave analysis provides context, not prophecy. As the 20th century semanticist Alfred Korzybski put it in his book Science and Sanity (1933), “The map is not the territory … The only usefulness of a map depends on similarity of structure between the empirical world and the map.” And I would add, in the ever-changing markets, we can judge that similarity of structure only after the fact.
See the menu page Analytical Methods for a rundown on where to go for information on Elliott wave analysis.
By Tim Bovee, Portland, Oregon, July 18, 2022
Disclaimer
Tim Bovee, Private Trader tracks the analysis and trades of a private trader for his own accounts. Nothing in this blog constitutes a recommendation to buy or sell stocks, options or any other financial instrument. The only purpose of this blog is to provide education and entertainment.
No trader is ever 100 percent successful in his or her trades. Trading in the stock and option markets is risky and uncertain. Each trader must make trading decisions for his or her own account, and take responsibility for the consequences.
Update 7/18/2022: I exited my short bear call vertical spread on SYF, 32 days before expiration, for a $1.45 debit per contract/share, a loss before fees of $38 per contract. Shares were trading at $31.99, up $1.10 from the entry level.
The Implied Volatility Rank at exit was 48.2%, down 4.8 points from the entry level.
I exited for 36.9% of maximum potential loss. I had expected a negative earnings surprise based on changes to analyst opinions; the surprise turned out to be positive.
Shares rose by 3.6% over three days for a +433% annual rate. The options position produced a 26.2% loss for a -3,189% annual rate.
I have entered a short bear call vertical spread on SYF, using options that trade for the last time 35 days hence, on August 19. The premium is a $1.07 credit per contract share and the stock at the time of entry was priced at $30.89.
The Implied Volatility Ratio stood at 53.0%.
Premium:
$1.07
Expire OTM
SYF-bear call spread
Odds
Delta
Calls
Long
37.00
92.0%
11
Break-even
33.07
78.0%
27
Short
32.00
64.0%
43
The premium is 42.8% of the width of the position’s short/long spread. The profit zone covers a 7.1% move to the upside and an unlimited move to the downside.
The risk/reward ratio is 3.7:1, with maximum risk of $107 and maximum reward of $393 per contract.
How I chose the trade. The trade was placed to coincide with SYF’s earnings announcement, before the opening bell on the day after entry. The short strikes were set to coincide with the expected move of $1.389 either way, based on options pricing, which gives a price range of $29.51 to $32.27.
By Tim Bovee, Portland, Oregon, July 15, 2022
Disclaimer
Tim Bovee, Private Trader tracks the analysis and trades of a private trader for his own accounts. Nothing in this blog constitutes a recommendation to buy or sell stocks, options or any other financial instrument. The only purpose of this blog is to provide education and entertainment.
No trader is ever 100 percent successful in his or her trades. Trading in the stock and option markets is risky and uncertain. Each trader must make trading decisions for his or her own account, and take responsibility for the consequences.
Update 7/18/2022: I exited my short bear call vertical spread on GS, 32 days before expiration, for a $2.58 debit per contract/share, a loss before fees of $80 per contract. Shares were trading at $300.09, up $10.82 from the entry level.
The Implied Volatility Rank at exit was 38.0%, down 17 points from the entry level.
I exited on the day after entry for 80.1% of maximum potential loss. I had expected a negative earnings surprise based on changes in analyst opinion; the surprise, as it turned out, was positive.
Shares rose by 3.7% over three days for a +4.55% annual rate. The options position produced a 31.0% loss for a -3,773% annual rate.
I have entered a short bear call vertical spread on GS, using options that trade for the last time 35 days hence, on August 19. The premium is a $1.78 credit per contract share and the stock at the time of entry was priced at $289.27.
The Implied Volatility Ratio stood at 55.0%.
Premium:
$1.78
Expire OTM
GS-bear call spread
Strike
Odds
Delta
Calls
Long
305.00
74.0%
30
Break-even
301.78
71.0%
33
Short
300.00
68.0%
36
The premium is 71.2% of the width of the position’s short/long spread. The profit zone covers a 4.3% move to the up and an unlimited move to the downside.
The risk/reward ratio is 1.8:1, with maximum risk of $322 and maximum reward of $178 per contract.
How I chose the trade. The trade was placed to coincide with GS’s earnings announcement, before the opening bell on the day after entry. The short strikes were set to coincide with the expected move of $12.05 either way, based on options pricing, which gives a price range of $280.84 to $297.71.
By Tim Bovee, Portland, Oregon, July 15, 2022
Disclaimer
Tim Bovee, Private Trader tracks the analysis and trades of a private trader for his own accounts. Nothing in this blog constitutes a recommendation to buy or sell stocks, options or any other financial instrument. The only purpose of this blog is to provide education and entertainment.
No trader is ever 100 percent successful in his or her trades. Trading in the stock and option markets is risky and uncertain. Each trader must make trading decisions for his or her own account, and take responsibility for the consequences.
Half an hour before the closing bell. The S&P 500 rose slightly during the day. The futures remained within the mid-3800s.
Wave 4{-12} is in its first subwave, A {-13}, and the upward A wave can be counted as being in its third and final wave. The middle segment of wave A{-13} seem a bit small for its position within the hierarchy of waves, but such oddities aren’t unheard of.
Wave A{-13} will be followed by a declining wave B{-13}, and then an upward wave C{-13}, which will complete the corrective pattern.
I’ve updated the chart.
2:15 p.m. New York time
One more earnings play exit. I exited my short put vertical spread on STT for a loss. The Zacks metric had predicted a negative earnings surprise. In fact, earnings exceeded analyst expectations. I’ve updated the trade analysis with full results.
1:35 p.m. New York time
Earnings plays: One exit, two entries. I’ve exited my short bull put vertical spread on C a day after entry for 53.9% of maximum potential profit and have updated the trade analysis with full results.
I’ve entered two bear call vertical spreads today, both using options that expire on August 19. I’ve posted a trade analysis on each: GS and SYF.
9:35 a.m. New York time
What’s happening now? The S&P 500 E-mini futures continued to rise overnight following yesterday’s low, 3723.75, reaching into the mid-3800s.
What does it mean? The low marked the end of the first leg of the downtrend that began on July 8 and the beginning of an upward correction that is in its early stage.
What are the alternatives? I have none at this point, as is common early in a trend.
[S&P 500 E-mini futures at 3:30 p.m., 105-minute bars, with volume]
What does Elliott wave theory say? Under the principal analysis, the rise from yesterday’s low is wave 4{-12}, an upward correction within downtrending wave 5{-11}, which began on June 28. Fourth waves often take the form of a Flat with three internal waves. The A and B waves have three internal waves, and the C wave has five waves internally.
Wave 5{-11} parent, downtrending wave 3{-10}, began on June 2, and the 3rd wave’s parent, downtrending wave 5{-9}, began on May 30. The next wave higher is downtrending wave 5{-8}, and the still higher degrees are listed in the “We Are Here” section, below.
We Are Here.
These are the waves currently in progress under my principal analysis. Each line on the list shows the wave number, with the subscript in curly brackets, the traditional degree name, the starting date, the starting price of the S&P 500 E-mini futures, and the direction of the wave.
Learning and other resources. Elliott wave analysis provides context, not prophecy. As the 20th century semanticist Alfred Korzybski put it in his book Science and Sanity (1933), “The map is not the territory … The only usefulness of a map depends on similarity of structure between the empirical world and the map.” And I would add, in the ever-changing markets, we can judge that similarity of structure only after the fact.
See the menu page Analytical Methods for a rundown on where to go for information on Elliott wave analysis.
By Tim Bovee, Portland, Oregon, July 15, 2022
Disclaimer
Tim Bovee, Private Trader tracks the analysis and trades of a private trader for his own accounts. Nothing in this blog constitutes a recommendation to buy or sell stocks, options or any other financial instrument. The only purpose of this blog is to provide education and entertainment.
No trader is ever 100 percent successful in his or her trades. Trading in the stock and option markets is risky and uncertain. Each trader must make trading decisions for his or her own account, and take responsibility for the consequences.
Update 7/15/2022: I exited my short bear call vertical spread on STT, 35 days before expiration, for a $3.08 debit per contract/share, a loss before fees of $189 per contract. Shares were trading at $63.33, up $4.25 from the entry level.
The Implied Volatility Rank at exit was 68.8%, down 30.4 points from the entry level.
I exited on the day after entry after the stock moved opposite my trade after earnings were published. I exited at 80.8% of maximum loss.
Shares rose by 7.2% over one day for a +2626% annual rate. The options position produced a 61.4% loss for a -22,398% annual rate.
I have entered a short bear call vertical spread on STT, using options that trade for the last time 36 days hence, on August 19. The premium is a $1.19 credit per contract share and the stock at the time of entry was priced at $59.08.
The Implied Volatility Ratio stood at 99.2%.
Premium:
$1.19
Expire OTM
STT-bear call spread
Strike
Odds
Delta
Calls
Long
62.50
87.0%
65
Break-even
68.69
78.5%
50.5
Short
67.50
70.0%
36
The premium is 47.6% of the width of the position’s short/long spread. The profit zone covers a 16.3% move to the downside and an unlimited move to the upside.
The risk/reward ratio is 3.2:1, with maximum risk of $238 and maximum reward of $119 per contract.
How I chose the trade. The trade was placed to coincide with STT’s earnings announcement, before the opening bell on the day after entry. The short strikes were set to coincide with the expected move of $2.42 either way, based on options pricing, which gives a price range of $56.66 to $61.50.
By Tim Bovee, Portland, Oregon, July 14, 2022
Disclaimer
Tim Bovee, Private Trader tracks the analysis and trades of a private trader for his own accounts. Nothing in this blog constitutes a recommendation to buy or sell stocks, options or any other financial instrument. The only purpose of this blog is to provide education and entertainment.
No trader is ever 100 percent successful in his or her trades. Trading in the stock and option markets is risky and uncertain. Each trader must make trading decisions for his or her own account, and take responsibility for the consequences.
Update 7/15/2022: I exited my short bull put vertical spread on C, 35 days before expiration, for a $0.59 debit per contract/share, a profit before fees of $69 per contract. Shares were trading at $46.92, up $3.36 from the entry level.
The Implied Volatility Rank at exit was 55.2%, down 17.2 points from the entry level.
I exited on the day after entry at 53.9% of maximum potential profit, well above my normal exit point for earnings plays, 25% of max.
Shares rose by 7.7% over one day for a +2,815% annual rate. The options position produced a 116.9% return for a +42,686% annual rate.
I have entered a short bull put vertical spread on C, using options that trade for the last time 36 days hence, on August 19. The premium is a $1.28 credit per contract share and the stock at the time of entry was priced at $43.56.
The Implied Volatility Ratio stood at 72.4%.
Premium:
$1.28
Expire OTM
C-bull put spread
Strike
Odds
Delta
Puts
Long
37.50
81.0%
15
Break-even
43.53
67.5%
27
Short
42.25
54.0%
39
The premium is 53.9% of the width of the position’s short/long spread. The profit zone covers a 0.1% move to the downside and an unlimited move to the upside.
The risk/reward ratio is 2.7:1, with maximum risk of $347 and maximum reward of $127 per contract.
How I chose the trade. The trade was placed to coincide with C’s earnings announcement, before the opening bell on the day after entry. The short strikes were set to coincide with the expected move of $1.57 either way, based on options pricing, which gives a price range of $41.99 to $45.13.
By Tim Bovee, Portland, Oregon, July 14, 2022
Disclaimer
Tim Bovee, Private Trader tracks the analysis and trades of a private trader for his own accounts. Nothing in this blog constitutes a recommendation to buy or sell stocks, options or any other financial instrument. The only purpose of this blog is to provide education and entertainment.
No trader is ever 100 percent successful in his or her trades. Trading in the stock and option markets is risky and uncertain. Each trader must make trading decisions for his or her own account, and take responsibility for the consequences.





You must be logged in to post a comment.