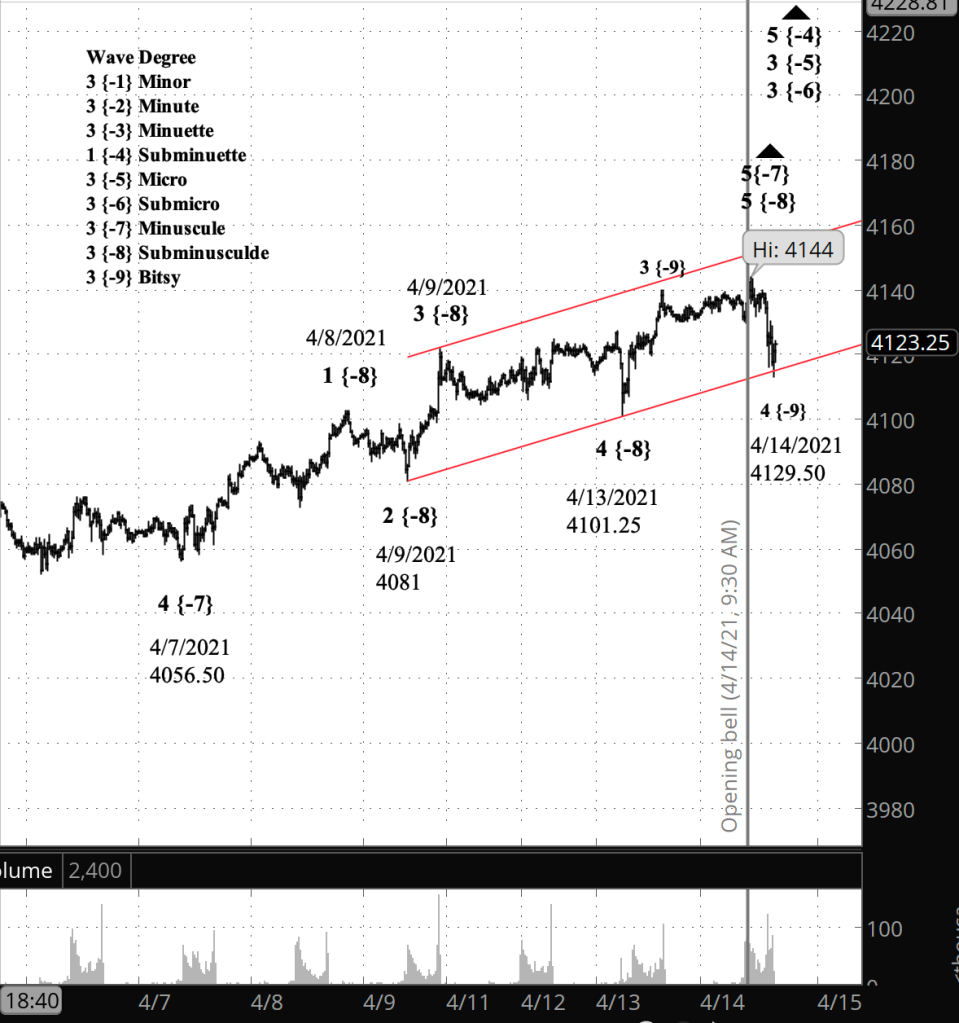
3:30 p.m. New York time
Half an hour before the closing bell. The S&P 500 declined during the day, the futures coming within 5 points of the low set on April 20. The movement doesn’t decide the question posed this morning: Is the bullish alternative count or the bearish alternative count the correct view of the chart? So we’ll head to the closing bell still puzzling over the ambiguity of the Elliott wave analysis. Interestingly, though, the volume picked up on the decline. So perhaps that’s a hint. Chart updated below.
9:40 a.m. New York time
What’s happening now? The S&P 500 E-mini futures leveled off somewhat in overnight trading.
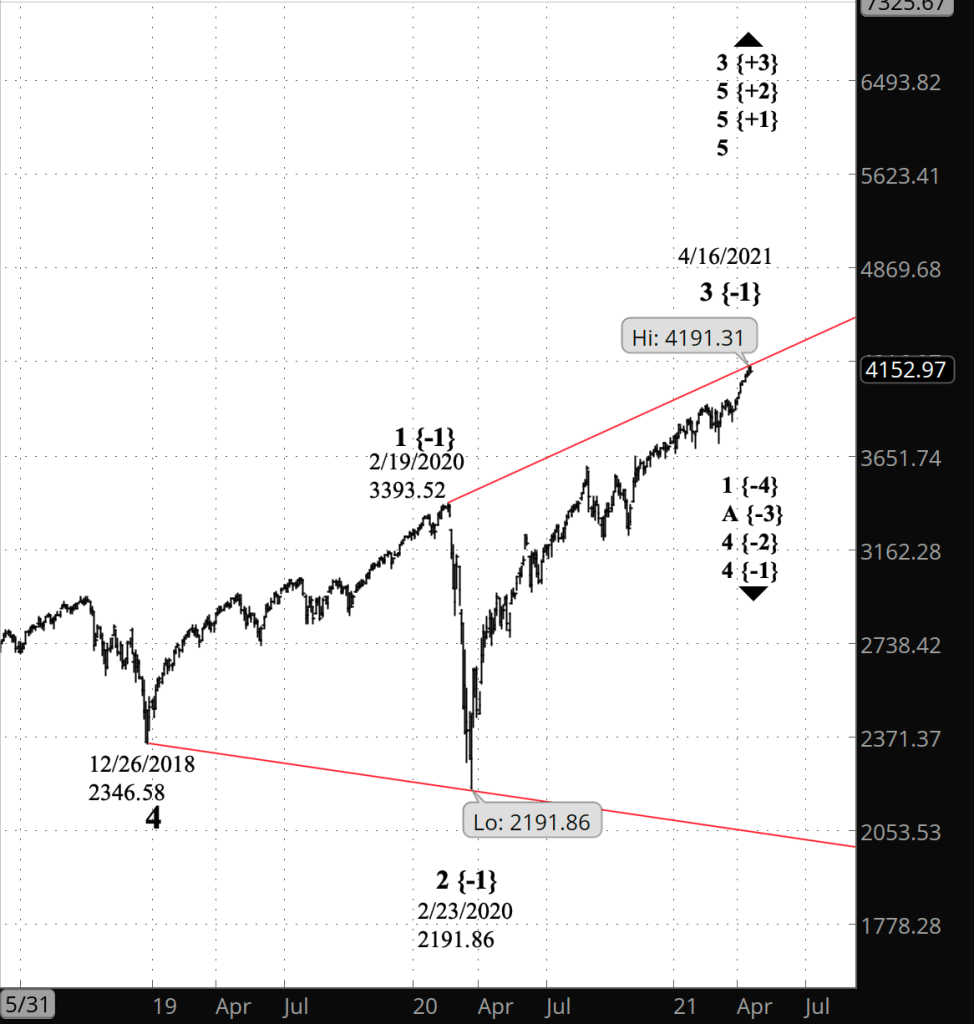
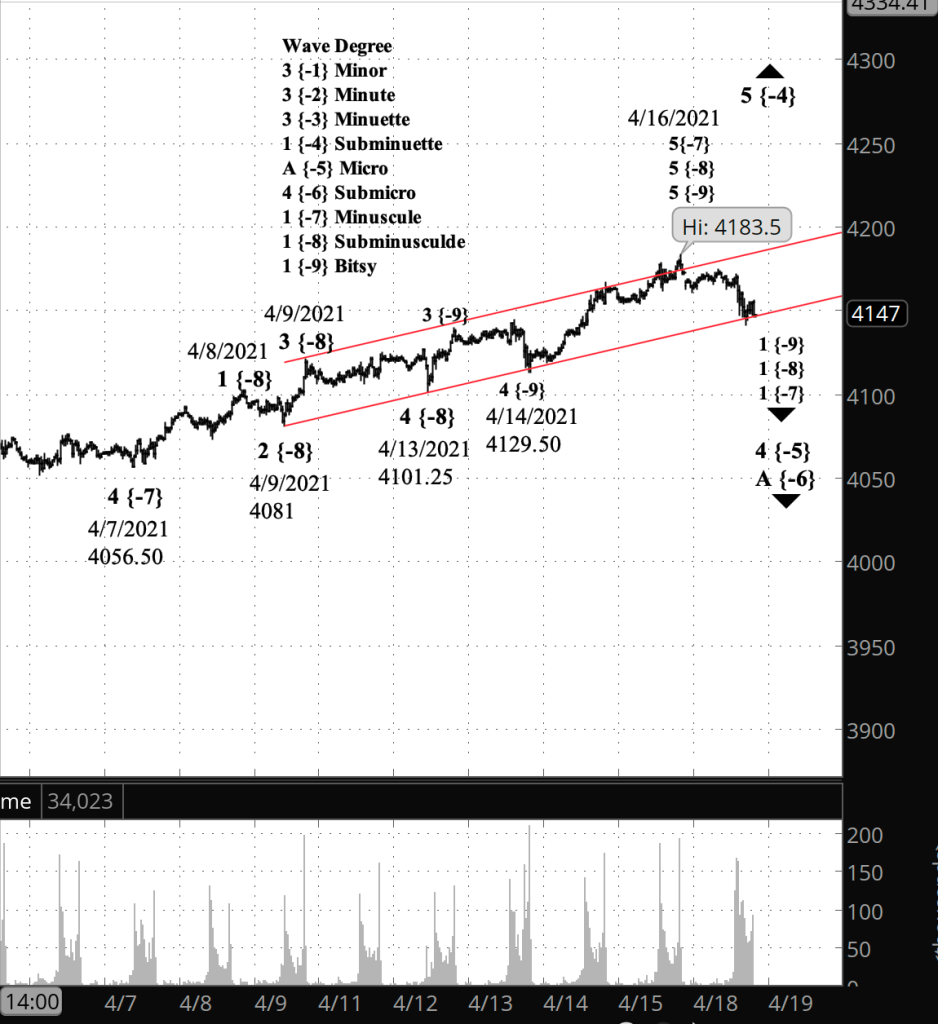
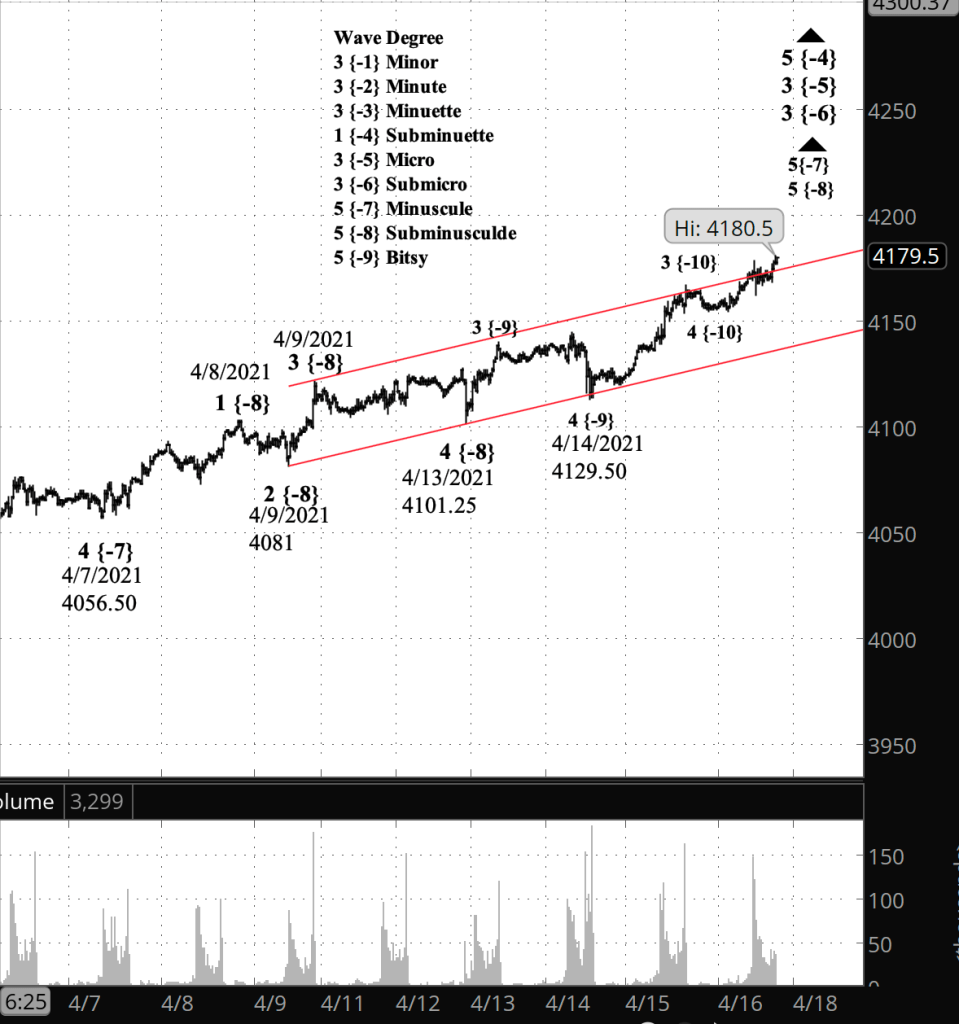
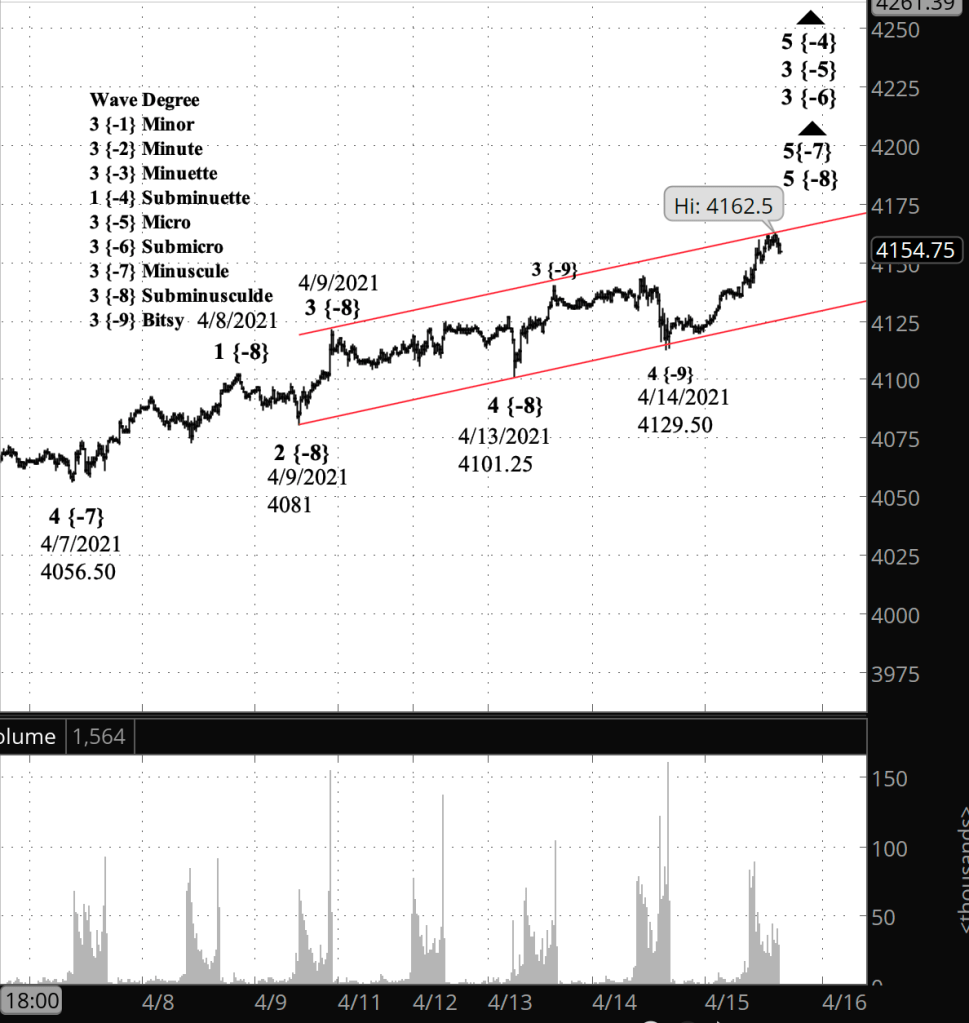
What does it mean? The sudden rise has thrown the chart into a high degree of ambiguity with no clear guidance on which alternative is most likely. One alternative is bullish, treating the decline since April 16 as a correction within an ongoing rise. The other is bearish, treating the decline as the beginning of a new downtrend. At this point I haven’t a clue as to which one will play out in the next weeks.
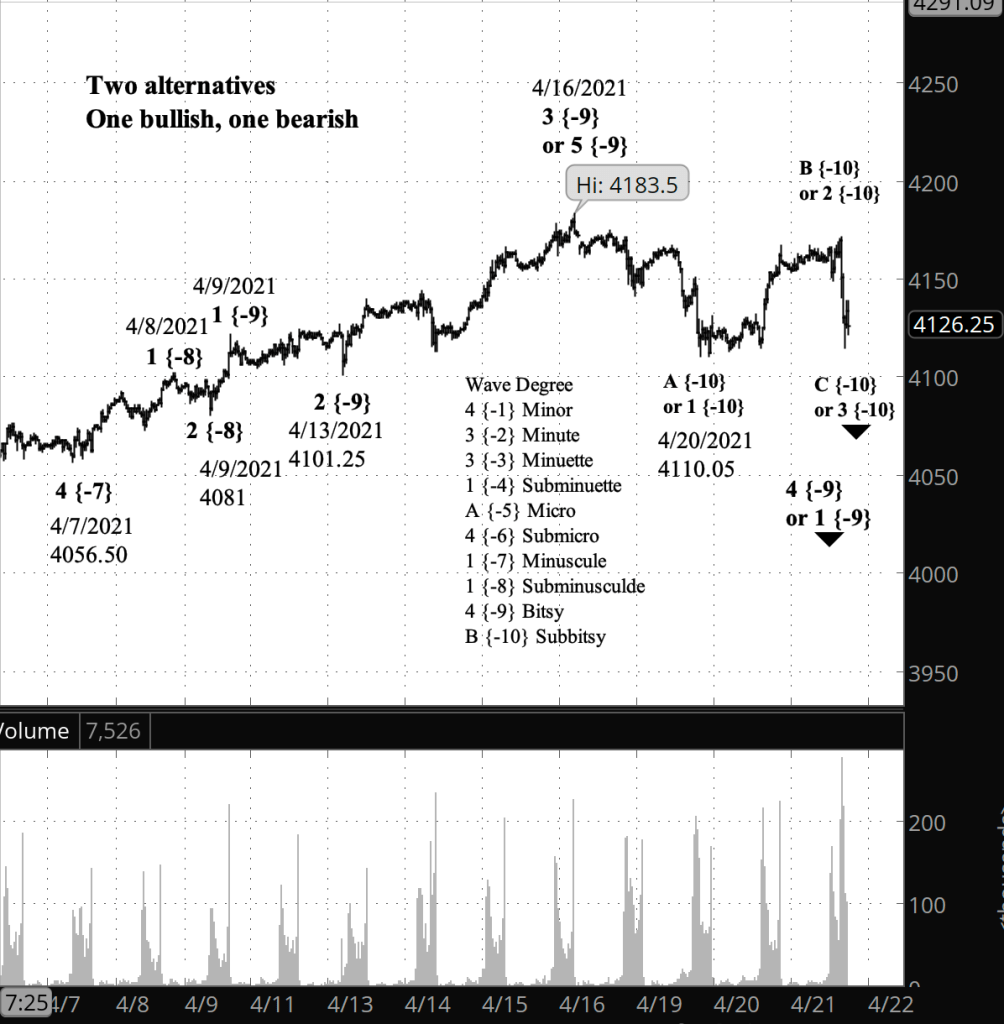
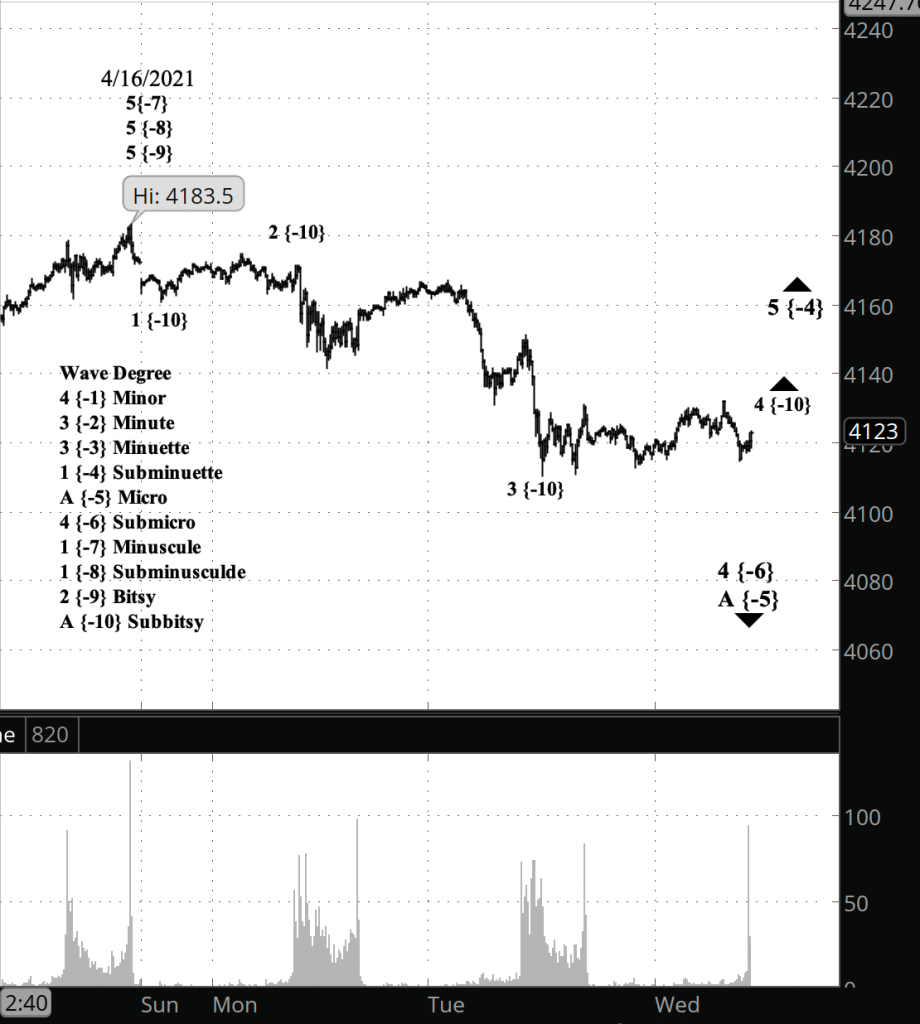
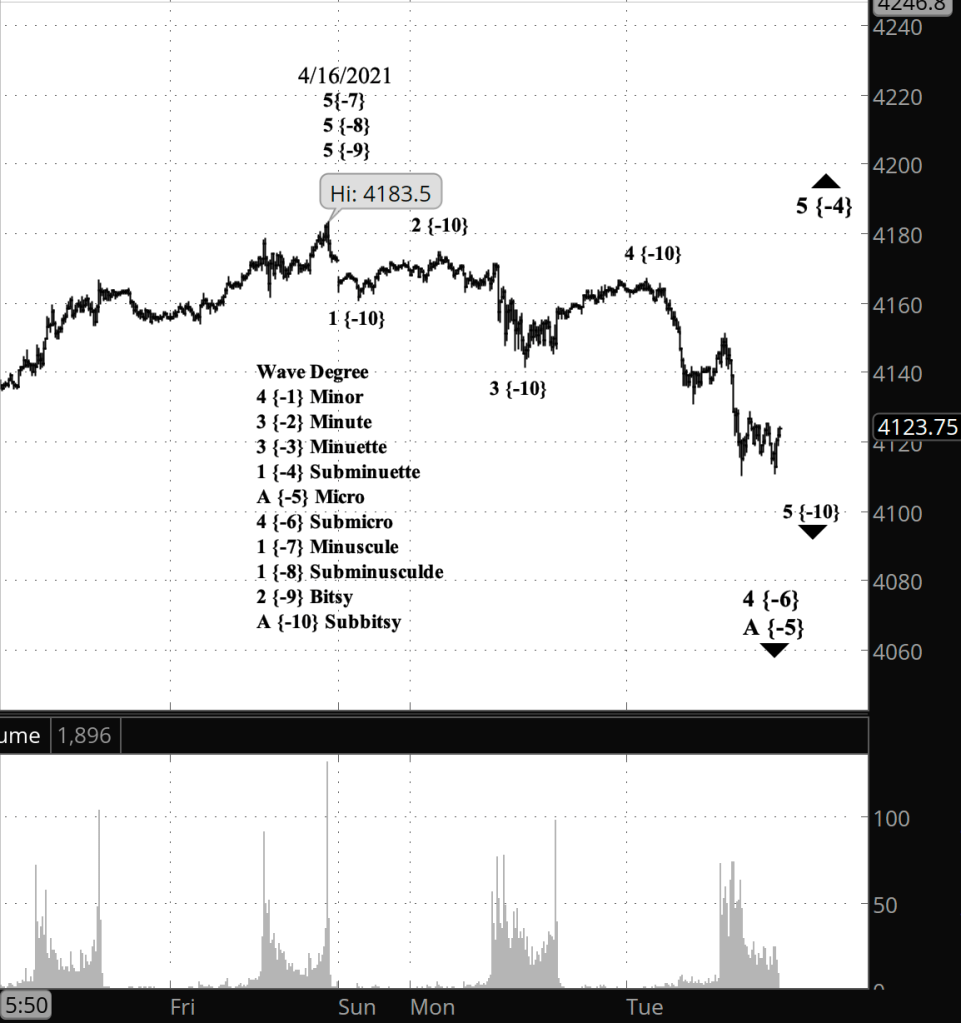
What does Elliott wave theory say? In the bullish scenario, the decline from April 16 is wave 4 of Bitsy degree, and internally wave A is complete and wave B is either in progress or complete. Bitsy wave 4 will be followed by a push to new highs — Bitsy wave 5.
In the bearish scenario, the decline from April 16 is wave 1 of Bitsy degree, and internally wave 1 is complete and wave 2 is underway and nearing completion. Bitsy wave 2 will be followed by a further, more energetic decline.
If the price moves above the peak of April 16 (4183.50 on the futures, 4191.31 on the index), and if the rise from April 20 has three waves internally, then the bullish scenario is correct.
If the price reverses downward to a significant degree and if the rise from April 20 has three waves internally, then the bearish scenario is correct.
Read More »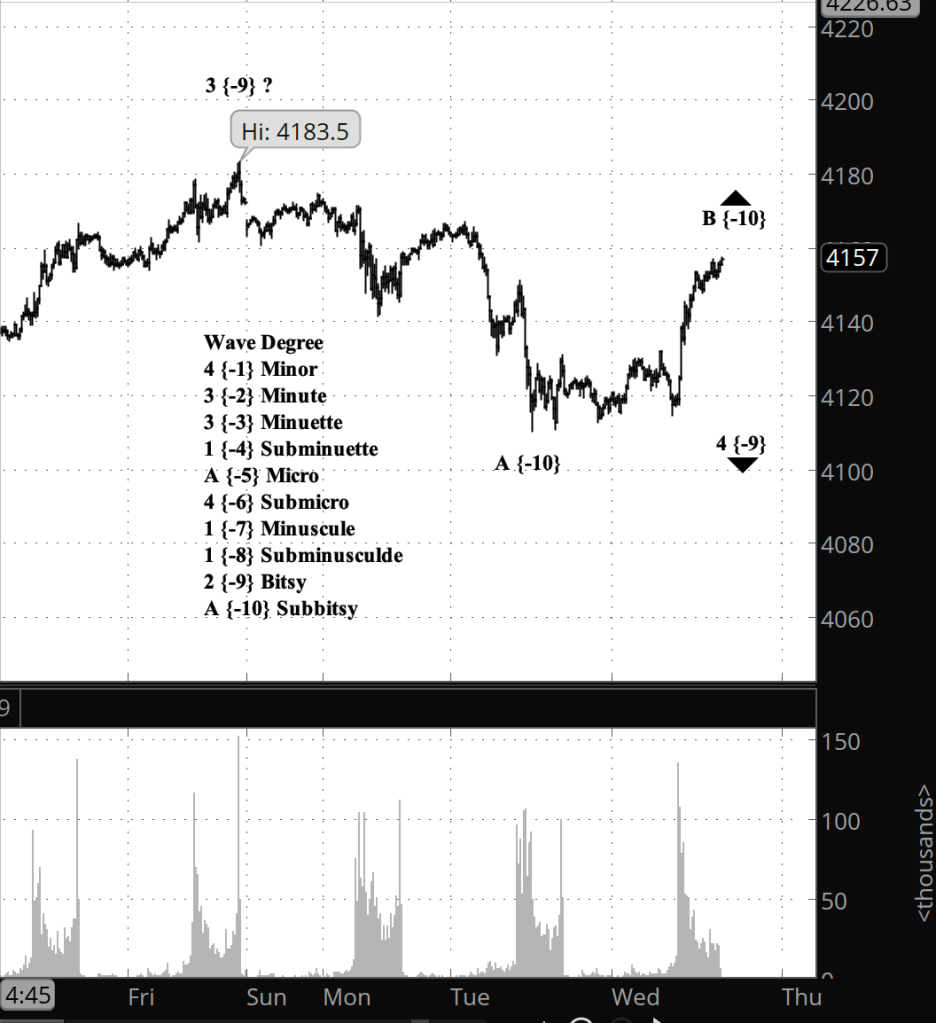

You must be logged in to post a comment.