SP500 Analysis

3:30 p.m. New York time

Half an hour before the closing bell. The S&P 500 continued to fall during the day, reversing and then falling back to a still lower level, touching the lower boundary of the expanding triangle. No change in the analysis. I’ve updated the chart.

10 a.m. New York time

What’s happening now? Three hours after yesterday’s closing bell, the S&P 500 E-mini futures dropped to a new low, 4479.25, pushing down the lower boundary of an expanding triangle (marked in red on the chart) that began on August 31. This has happened repeatedly in recent days. What differs this time is that the price drop touched the lower boundary of the price channel of the rise that began March 4 (marked in blue). In theory this strengthens the idea that the series of lower lows is over. However, prices routinely pierce the boundaries of price channels, so nothing is guaranteed. It does signify that the end is near.

What does it mean? As with the past lower lows on the triangle boundary, my principal analysis has marked the low as the end of the decline that began September 3 and the beginning of a new rise back to the upper boundary of the triangle.

What’s the alternative? A new lower low means that the decline is still underway.
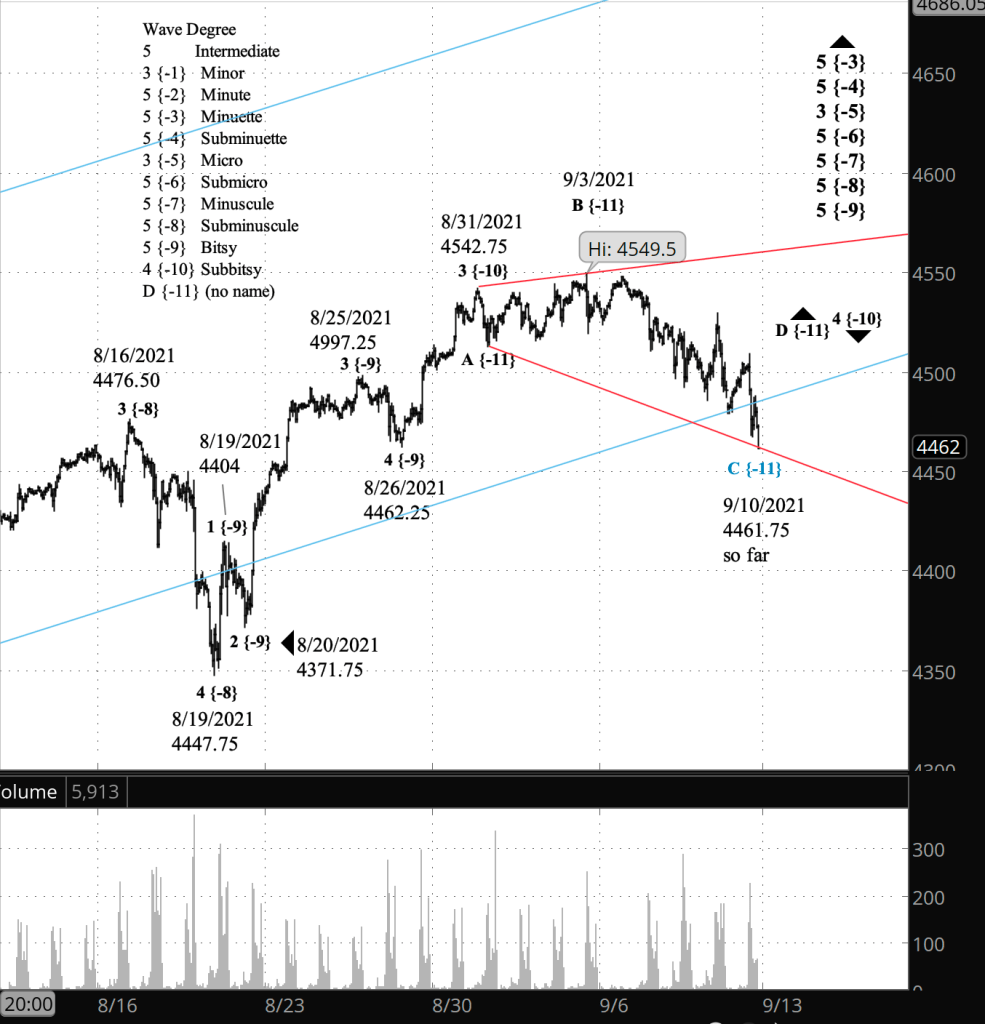
[S&P 500 E-mini futures at 3:30 p.m., hourly bars, with volume]

What does Elliott wave theory say? First micro, then macro. At the small degrees, the low from last night marks the end of wave C within wave 4 of Subbitsy degree, and the beginning of wave D, which will carry the price back to the upper boundary of the expanding triangle (red on the chart), which is presently around 4560. Expanding triangles have five waves internally, so the wave E that follows will bring the price back down to the triangle’s lower boundary, ending the Subbitsy wave 4. Since the lower boundary moves further down each day, wave E will travel further than the preceding wave D to meet its end.

At the larger degrees, the rise since March 4, wave 5 of Minuette degree has been encompassed by a price channel marked in blue on the chart. The end of Minuette wave 5 will also mark the end of 5th waves of increasing degree all the way up to the Supercycle level, which is a very big deal indeed, since it will mark the start of a downtrend of epic proportions.

From small to large, with subscripts:

  • Wave 4 of Subbitsy degree {-10} (the expanding triangle, in red), when complete,
  • will mark the start ofWave 5 of Bitsy degree {-9} within
  • within wave 5 of Subminuscule degree {-8}
  • within wave 5 of Minuscule degree {-7}
  • within wave 5 of Submicro degree {-6}
  • within wave 3 of Micro degree {-5}, which will be followed by a correction, wave 4 of Micro degree, and then a 5th wave pushing up to mark the end of
  • the parent wave, 5 of Subminuette {-4} degree
  • within wave 5 of Minuette degree {-3} (the price channel, in blue)
  • within wave 5 of Minute {-2} degree
  • within wave 3 of Minor degree {-1}, whose completion will be followed by a signifiant 4th wave correction and then a 5th wave movement to higher highs,
  • which will complete wave 5 of Intermediate degree {no subscript}
  • within wave 5 of Primary degree {+1}
  • within wave 5 of Cycle degree {+2}
  • within wave 5 of Supercycle degree {+3}, which began in 1932.

Learning and other resources. Elliott wave analysis provides context, not prophecy. As the 20th century semanticist Alfred Korzybski put it in his book Science and Sanity (1933), “The map is not the territory … The only usefulness of a map depends on similarity of structure between the empirical world and the map.” And I would add, we can judge that similarity of structure only after the fact.

See the menu page Analytical Methods for a rundown on where to go for information on Elliott wave analysis.

By Tim Bovee, Portland, Oregon, September 10, 2021

Disclaimer

Tim Bovee, Private Trader tracks the analysis and trades of a private trader for his own accounts. Nothing in this blog constitutes a recommendation to buy or sell stocks, options or any other financial instrument. The only purpose of this blog is to provide education and entertainment.

No trader is ever 100 percent successful in his or her trades. Trading in the stock and option markets is risky and uncertain. Each trader must make trading decisions for his or her own account, and take responsibility for the consequences.

License
Creative Commons License

All content on Tim Bovee, Private Trader by Timothy K. Bovee is licensed under a Creative Commons Attribution-ShareAlike 4.0 International License.

Based on a work at www.timbovee.com.
SP500 Analysis

3:30 p.m. New York time

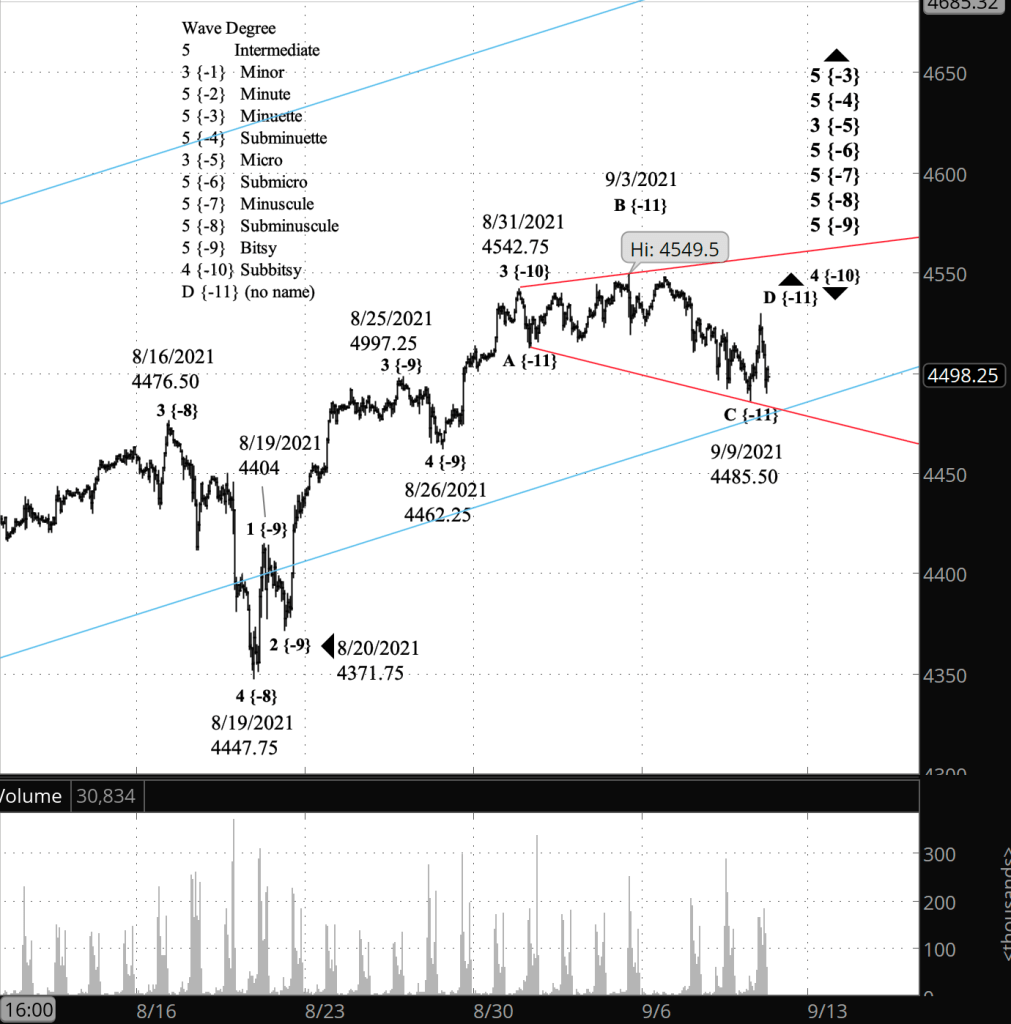
Half an hour before the closing bell. The S&P 500 ended its rise early in the trading day and then took back much of that distance, while remaining above the overnight low of 4485.50 — so far. No change in my analysis, except to reemphasize the possibility that the price will move to a new low, requiring that the endpoint of wave C be repositioned. I’ve updated the chart.

10 a.m. New York time

What’s happening now? Same song different verse. The S&P 500 E-mini futures declined a few points lower in overnight trading, pushing the lower boundary of the expanding triangle pattern lower, and then reversed to the upside. (The triangle is marked in red on the chart.)

What does it mean? The reversal brought the price above the preceding downward reversal for the first time three days, strengthening the likelihood that the 4th leg of the triangle was underway. I expect it to reach the area of the upper boundary of the triangle, presently around 4960. The decline that ended overnight brought the price close to the lower boundary of the price channel of the rise that began March 4 (marked i blue on the chart).

What’s the alternative? It’s possible that the price will reverse and move still lower, meaning that the uptrending 4th leg of the triangle has not yet begun.

[S&P 500 E-mini futures at 3:30 p.m., hourly bars, with volume]

What does Elliott wave theory say? The expanding triangle, which began August 31, will have five waves. The first three — A to the downside, B upside and C downside — are complete, according to my principle analysis. Uptrending wave D is now underway. The triangle in its entirely is wave 4 of Subbitsy degree, a downward correction that will be followed by an upward push wave 5 of Subbitsy degree. The end of Subbitsy 5 will also mark the end of a series of 5th waves of increasingly higher degree, up four levels to Submicro degree, which in turn will mark the end of the parent, wave 3 of Submicro degree. The following wave at that degree will be a 4th wave correction.

Learning and other resources. Elliott wave analysis provides context, not prophecy. As the 20th century semanticist Alfred Korzybski put it in his book Science and Sanity (1933), “The map is not the territory … The only usefulness of a map depends on similarity of structure between the empirical world and the map.” And I would add, we can judge that similarity of structure only after the fact.

Under the alternative analysis, wave C within wave 4 of Subbitsy degree is still underway, and wave D with all of its implications lies in the future. A move to a lower low, below 4485.50, would mean that the alternative analysis is correct.

See the menu page Analytical Methods for a rundown on where to go for information on Elliott wave analysis.

By Tim Bovee, Portland, Oregon, September 9, 2021

Disclaimer

Tim Bovee, Private Trader tracks the analysis and trades of a private trader for his own accounts. Nothing in this blog constitutes a recommendation to buy or sell stocks, options or any other financial instrument. The only purpose of this blog is to provide education and entertainment.

No trader is ever 100 percent successful in his or her trades. Trading in the stock and option markets is risky and uncertain. Each trader must make trading decisions for his or her own account, and take responsibility for the consequences.

License
Creative Commons License

All content on Tim Bovee, Private Trader by Timothy K. Bovee is licensed under a Creative Commons Attribution-ShareAlike 4.0 International License.

Based on a work at www.timbovee.com.
Bitcoin Analysis

9:05 a.m. New York time

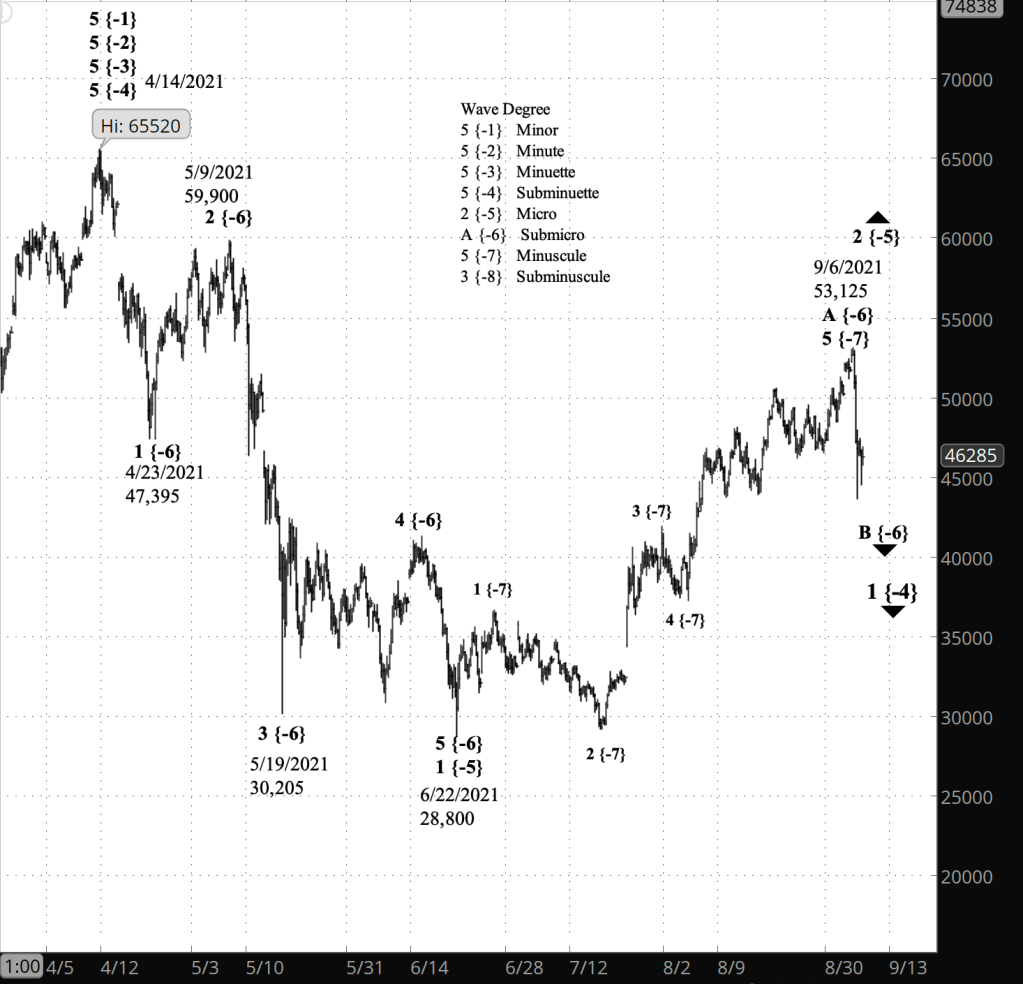
What’s happening now? Bitcoin ended the first leg of an upward correction and has now begun the downward second leg.

What does it mean? I expect the present decline to remain above the June 22 low of 28,800 and to be followed by a significant rise in the third leg of the correction.

What’s the alternative? It’s possible that the September 6 peak was the end of the correction and that the downtrend that began on April 14 has resumed. If that’s the case, then I expect significant new lows.

[Bitcoin futures at 9:04 a.m., 5-hour bars]

What does Elliott wave theory say? The September 6 peak marked the end of wave A of Submicro degree within wave 2 of Micro degree, an upward correction within wave 1 of Subminuette degree, the early steps in a major downtrend that began on April 14 with the end of a series of 5th waves of increasingly higher degree, up to Minor degree.

The decline after Submicro wave A is wave B, the middle wave in a three-wave corrective pattern. It will be followed by Submicro C, whose completion will end Micro 2 upward correction and begin wave 3 of Micro degree, which will carry the price to significant new lows.

Learning and other resources. Elliott wave analysis provides context, not prophecy. As the 20th century semanticist Alfred Korzybski put it in his book Science and Sanity (1933), “The map is not the territory … The only usefulness of a map depends on similarity of structure between the empirical world and the map.” And I would add, we can judge that similarity of structure only after the fact.

See the menu page Analytical Methods for a rundown on where to go for information on Elliott wave analysis.

By Tim Bovee, Portland, Oregon, September 8, 2021

Disclaimer

Tim Bovee, Private Trader tracks the analysis and trades of a private trader for his own accounts. Nothing in this blog constitutes a recommendation to buy or sell stocks, options or any other financial instrument. The only purpose of this blog is to provide education and entertainment.

No trader is ever 100 percent successful in his or her trades. Trading in the stock and option markets is risky and uncertain. Each trader must make trading decisions for his or her own account, and take responsibility for the consequences.

License
Creative Commons License

All content on Tim Bovee, Private Trader by Timothy K. Bovee is licensed under a Creative Commons Attribution-ShareAlike 4.0 International License.

Based on a work at www.timbovee.com.
SP500 Analysis

3:30 p.m. New York time

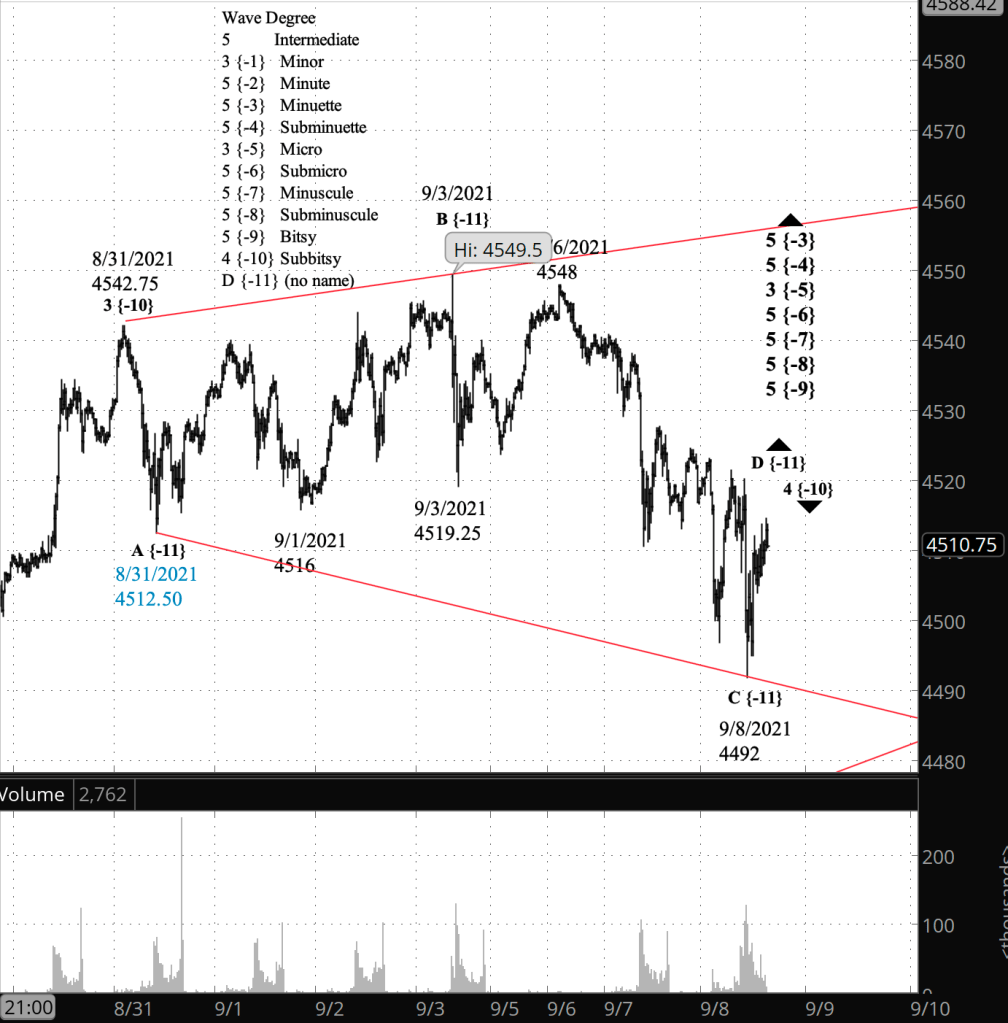
Half an hour before the closing bell. The price hit the lower boundary of the expanding triangle that began on August 31, pushing it lower, and then reversed. I’ve marked the chart with a principal analysis that says that the new low, 4492, is the end of wave C and the subsequent rise is wave D. If the price moves below 4492, then wave C is still underway. I’ve updated the chart.

9:35 a.m. New York time

What’s happening now? The S&P 500 E-mini futures declined sharply in overnight trading, reaching a low of 4497 before reversing. The decline redefined downward the lower boundary of the expanding triangle that began on August 31.

What does it mean? The overnight low marked the end of the third leg of the triangle and the beginning of the fourth leg, which will carry the price into the region of the upper boundary, which is present around 4555. It will be followed by a decline back to the lower boundary, the 5th and final leg of the triangle. After that end of the correction, the price will rise to new highs as the uptrend resumes.

What’s the alternative? The third leg might not be finished, and in that case, the price will reverse again and push lower, again redefining the triangle’s lower boundary.

[S&P 500 E-mini futures at 3:30 p.m., 20-minute bars, with volume]

What does Elliott wave theory say? The expanding triangle’s boundaries — the price channel — are defined by drawing lines connecting the peaks for the upper boundary and the lows for the lower one. The upper boundary connects the beginnings of waves A and C. Those waves are complete and the upper boundary won’t change. The lower boundary connects the end of wave A and the end of wave C. As we learned last night, wave C was not yet complete at yesterday’s closing bell; the price pushed lower, as did the end of wave C and the more recent definition price of the lower boundary.

Under my principal analysis, I’ve marked the overnight low as the end of wave C {-11} within wave 4 of Subbitsy {-10} degree. (The numbers within the curly brackets are subscripts. See the chart or the menu page Analytical Methods  for a list and names and subscripts.)

Wave D {-11} to the upside is now underway. It’s completion near the upper boundary will be followed by wave E {-11} back to the lower boundary, whose completion will mark the end of Subbitsy wave 4 and the beginning of Subbitsy wave 5. The end of Subbitsy wave 5 will also be the end of a series of 5th waves of increasingly large degree, up four levels to Submicro degree. Up one more degree, it will be the end of wave 3 of Micro degree, began on May 19. The 3rd wave will be followed by a 4th wave correction.

Under my alternative analysis, wave C {-11} is still underway, as is its parent wave, the 4th of Subbitsy degree. This analysis will come into play if the price declines below 4497 — the overnight low — before reaching the region of the expanding triangle’s upper boundary.

Learning and other resources. Elliott wave analysis provides context, not prophecy. As the 20th century semanticist Alfred Korzybski put it in his book Science and Sanity (1933), “The map is not the territory … The only usefulness of a map depends on similarity of structure between the empirical world and the map.” And I would add, we can judge that similarity of structure only after the fact.

See the menu page Analytical Methods for a rundown on where to go for information on Elliott wave analysis.

By Tim Bovee, Portland, Oregon, September 8, 2021

Disclaimer

Tim Bovee, Private Trader tracks the analysis and trades of a private trader for his own accounts. Nothing in this blog constitutes a recommendation to buy or sell stocks, options or any other financial instrument. The only purpose of this blog is to provide education and entertainment.

No trader is ever 100 percent successful in his or her trades. Trading in the stock and option markets is risky and uncertain. Each trader must make trading decisions for his or her own account, and take responsibility for the consequences.

License
Creative Commons License

All content on Tim Bovee, Private Trader by Timothy K. Bovee is licensed under a Creative Commons Attribution-ShareAlike 4.0 International License.

Based on a work at www.timbovee.com.
SP500 Analysis

3:30 p.m. New York time

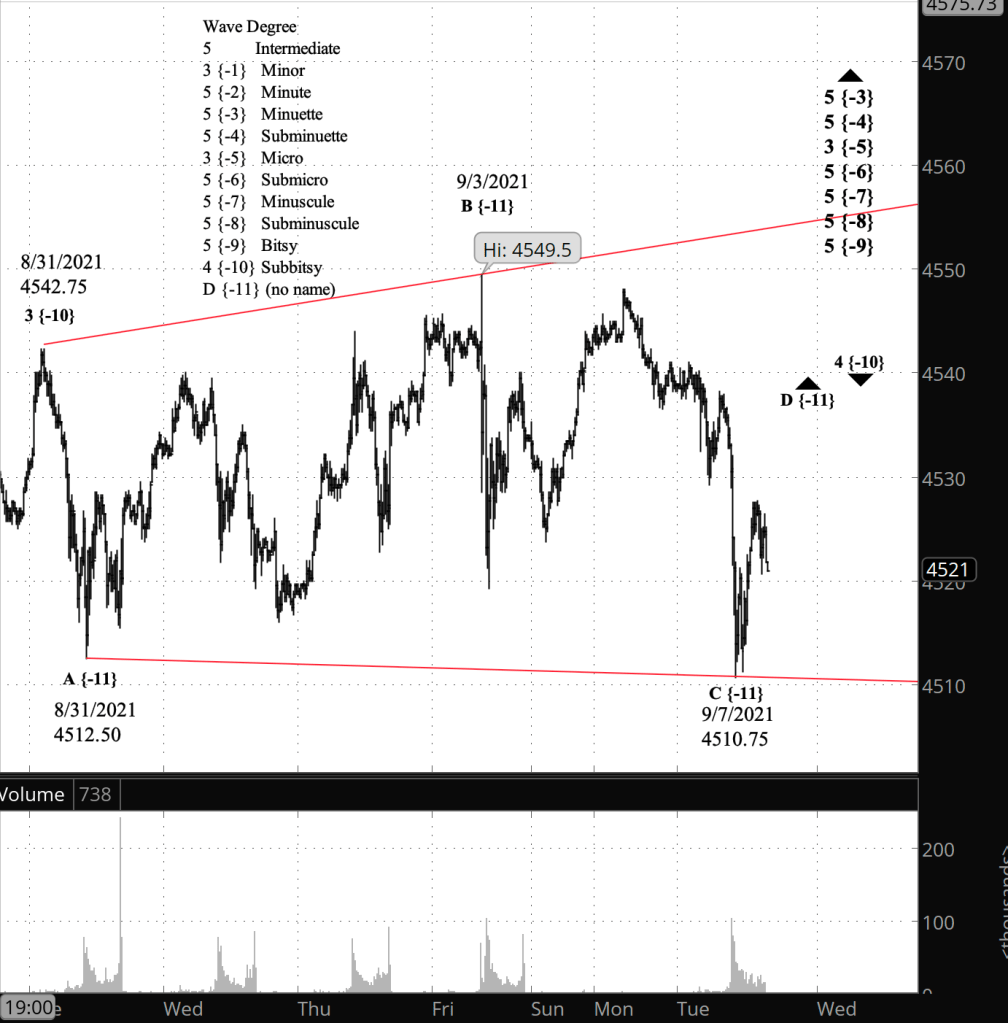
Half an hour before the closing bell. The sharp decline during the day brought clarity to the chart. I’ve promoted my alternate analysis from this morning to principal analysis. The present movement is wave 4 of Subbitsy degree, a correction within the parent, wave 5 of Bitsy degree. These are small degrees, and the chart includes waves with a subscript — {11} — so small that I haven’t named it. The red lines, a price channel for Subbitsy wave 4, clearly shows an expanding triangle as the structure of the correction.

I’ve added a close-up chart of Subbitsy wave 4 and have left this morning’s chart as it was just after the opening bell.

[S&P 500 E-mini futures at 3:30 p.m., 15-minute bars, with volume]

9:35 a.m. New York time

What’s happening now? The S&P 500 E-mini futures continued their decline that began yesterday within a larger uptrend that began on September 1.

What does it mean? The decline is part of the early price movements within the rising final leg of the September uptrend.

What’s the alternative? The correction may have still be underway, taking the form of an expanding triangle.

[S&P 500 E-mini futures at 9:33 a.m., 45-minute bars, with volume]

What does Elliott wave theory say? The alternative analysis — the continuing correction — remains possible because the price remains below the September 3 high of 4549.50. Under my principal count, wave 5 of Subbitsy degree began on September 1. But the pattern within wave 5 that has emerged bears little resemblance to a move in the direction of the trend — a Motive Wave in the terminology of Elliott wave theory. In a Motive Wave, the 3rd wave takes off like rocket as the market accepts the trend as real. The 3rd internal wave of Subbitsy 5 is more of a shrug and a “Meh!” than a rocket.

The reason I’ve stuck to my principal analysis — the correction ended on September 5 — is because the high of September 3 exceeds the end of wave 3 of Subbitsy degree, on August 31. That doesn’t happen with the common corrective patterns — a Zigzag or a Flat — and so that high is likely to be a resumption of the trend.

However, there is a way to count the chart so that the correction is still underway. If the decline that began on August 31 was an expanding triangle, then the higher high on September 3 is within the rules of Elliott wave analysis. Under this scenario, the triangle’s 4th wave ended at the September 3 low of 4519.25, and the final 5th wave of the triangle is underway. When it is complete, then either wave 5 of Subbitsy degree begins, or there is an X-wave that creates a compound correction, with a second corrective pattern within Subbitsy wave 4.

That’s a long way of saying that this chart is messy, filled with ambiguity that will no doubt be resolved in the next few days of trading.

Learning and other resources. Elliott wave analysis provides context, not prophecy. As the 20th century semanticist Alfred Korzybski put it in his book Science and Sanity (1933), “The map is not the territory … The only usefulness of a map depends on similarity of structure between the empirical world and the map.” And I would add, we can judge that similarity of structure only after the fact.

See the menu page Analytical Methods for a rundown on where to go for information on Elliott wave analysis.

By Tim Bovee, Portland, Oregon, September 7, 2021

Disclaimer

Tim Bovee, Private Trader tracks the analysis and trades of a private trader for his own accounts. Nothing in this blog constitutes a recommendation to buy or sell stocks, options or any other financial instrument. The only purpose of this blog is to provide education and entertainment.

No trader is ever 100 percent successful in his or her trades. Trading in the stock and option markets is risky and uncertain. Each trader must make trading decisions for his or her own account, and take responsibility for the consequences.

License
Creative Commons License

All content on Tim Bovee, Private Trader by Timothy K. Bovee is licensed under a Creative Commons Attribution-ShareAlike 4.0 International License.

Based on a work at www.timbovee.com.
SP500 Analysis

9:30 a.m. New York time

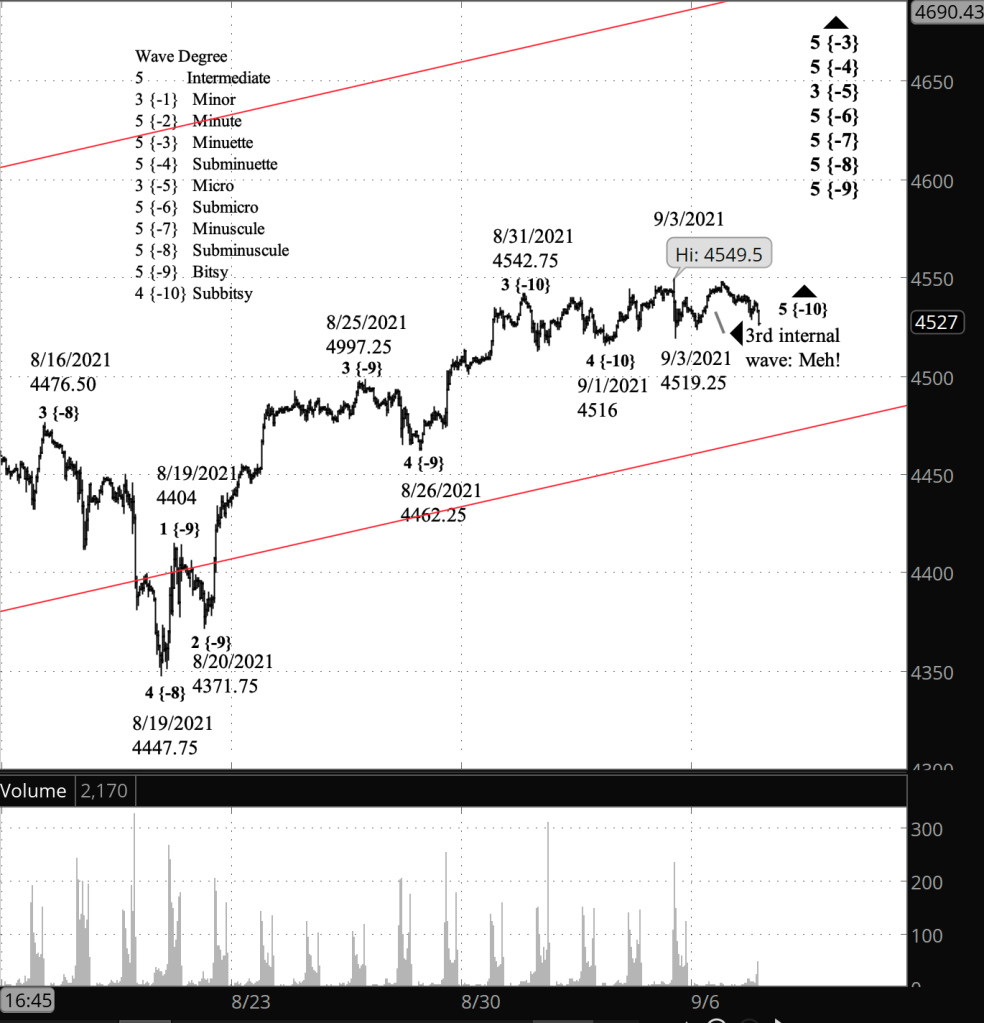
What’s happening now? The S&P 500 E-mini futures initially declined slightly in overnight trading and then rose, to a high so far of 4545.75, within four points of Friday’s peak. The U.S. markets be closed today for the Labor Day holiday.

What does it mean? The price is in the very early stages of the middle portion of the rise that began on September 1, following the end of of a two-day correction. A rise above Friday’s high, 4549.50, will confirm this scenario.

What’s the alternative? The correction is still underway, having extended in a compound pattern.

[S&P 500 E-mini futures at 9:30 a.m., 45-minute bars, with volume]

What does Elliott wave theory say? By my principal analysis wave 5 of Subbitsy degree began on September 1, at the end of Subbitsy wave 4, which began on August 31. This is all happening within wave 5 of Bitsy degree, which began on August 26. Completion of Bitsy wave 5 will also mark the end of 5th waves of increasingly large degree, up three levels to wave 5 of Submicro degree, which in turn will mark the end of Micro wave 3, which began on May 19.

My alternative analysis considers wave 4 of Subbitsy degree to still be underway. Having completed its first corrective pattern, Subbitsy 4 under this scenario is now working through a second corrective pattern in a compound structure.

Learning and other resources. Elliott wave analysis provides context, not prophecy. As the 20th century semanticist Alfred Korzybski put it in his book Science and Sanity (1933), “The map is not the territory … The only usefulness of a map depends on similarity of structure between the empirical world and the map.” And I would add, we can judge that similarity of structure only after the fact.

See the menu page Analytical Methods for a rundown on where to go for information on Elliott wave analysis.

By Tim Bovee, Portland, Oregon, September 6, 2021

Disclaimer

Tim Bovee, Private Trader tracks the analysis and trades of a private trader for his own accounts. Nothing in this blog constitutes a recommendation to buy or sell stocks, options or any other financial instrument. The only purpose of this blog is to provide education and entertainment.

No trader is ever 100 percent successful in his or her trades. Trading in the stock and option markets is risky and uncertain. Each trader must make trading decisions for his or her own account, and take responsibility for the consequences.

License
Creative Commons License

All content on Tim Bovee, Private Trader by Timothy K. Bovee is licensed under a Creative Commons Attribution-ShareAlike 4.0 International License.

Based on a work at www.timbovee.com.
BABA Trade

Alibaba Group Holding Ltd. (BABA)

Lot 2

Update 9/14/2021: I exited my bear call spread position on BABA 31 days before expiration, for a $0.99 debit per contract/share, a profit before fees of $138 per contract. Shares were trading at $162.31, down $8.61 from the entry level. The Implied Volatility Rank stood at 47.0% at exit, up 8.9 points from the entry level.

My decision to exit was based on the credit falling to greater than 50% of maximum potential profit.

Shares declined by 5.0% over 11 days for a -167% annual rate. The options position produced a 139.4% return for a 4,625% annual rate.


I have entered a short bear call spread on BABA, using options that trade for the last time 42 days hence, on October 15.

The premium is a $2.37 credit per contract share and the stock at the time of entry was priced at $170.92.

The implied volatility rank (IVR) stands at 38.1%.

Premium: $2.37 Expire OTM  
BABA-bear call spread Strike Odds Delta
Calls      
Long 200.00 90.0% 13
Break-even 187.37 83.0% 21
Short 185.00 76.0% 29

The premium is 31.6% of the width of the position’s wing.

The profit zone covers a 9.6% move to the upside.

The risk/reward ratio is 5.3:1, with maximum risk of $1,263 and maximum reward of $237 per contract.

By Tim Bovee, Portland, Oregon, September 3, 2021

Read More »

FXI Trade

iShares China Large-Cap ETF (FXI)

Lot 2

Update 9/15/2021: I exited my bear call spread position on FXI 30 days before expiration, for a $0.28 debit per contract/share, a profit before fees of $54.00 per contract. Shares were trading at $40.06, down $1.44 from the entry level. 

The Implied Volatility Rank at exit was 27.1, down 13.9 points from the entry level.

My decision to exit was based on the debit on the contracts having reached about half of maximum potential profit.

Shares declined by 3.5% over 12 days for a 106% annual rate. The options position produced a 96.4% return for a 2,933% annual rate.


I have entered a short bear call spread on FXI, using options that trade for the last time 42 days hence, on October 15. The premium is a $0.55 credit per contract share and the stock at the time of entry was priced at $41.50.

The implied volatility rank (IVR) stands at 41.0%.

Premium: $0.55 Expire OTM  
FXI-bear call spread Strike Odds Delta
Calls      
Long 46.00 92.0% 10
Break-even 43.55 81.0% 21.5
Short 43.00 70.0% 33

The premium is 36.7% of the width of the position’s wing.

The profit zone covers a 4.9% move to the upside.

The risk/reward ratio is 4.5:1, with maximum risk of $245 and maximum reward of $55 per contract.

By Tim Bovee, Portland, Oregon, September 3, 2021

Read More »

SP500 Analysis

3:30 p.m. New York time

Half an hour before the closing bell. The S&P 500 rose from its low today of 4519.25, remaining below the overnight high of 4945.50. I’ve seen nothing to require a change in my analysis from this morning. I’ve updated the lower charts.

Holiday. Monday is a holiday in the United States — Labor Day — and markets will be closed. I anticipate that the S&P 500 E-mini futures will do some trading during market hours outside the U.S., and I shall post an analysis if there is any change on the chart.

10:10 a.m. New York time

My trades. I’ve entered short bear call options spreads on FXI and BABA.

9:35 a.m. New York time

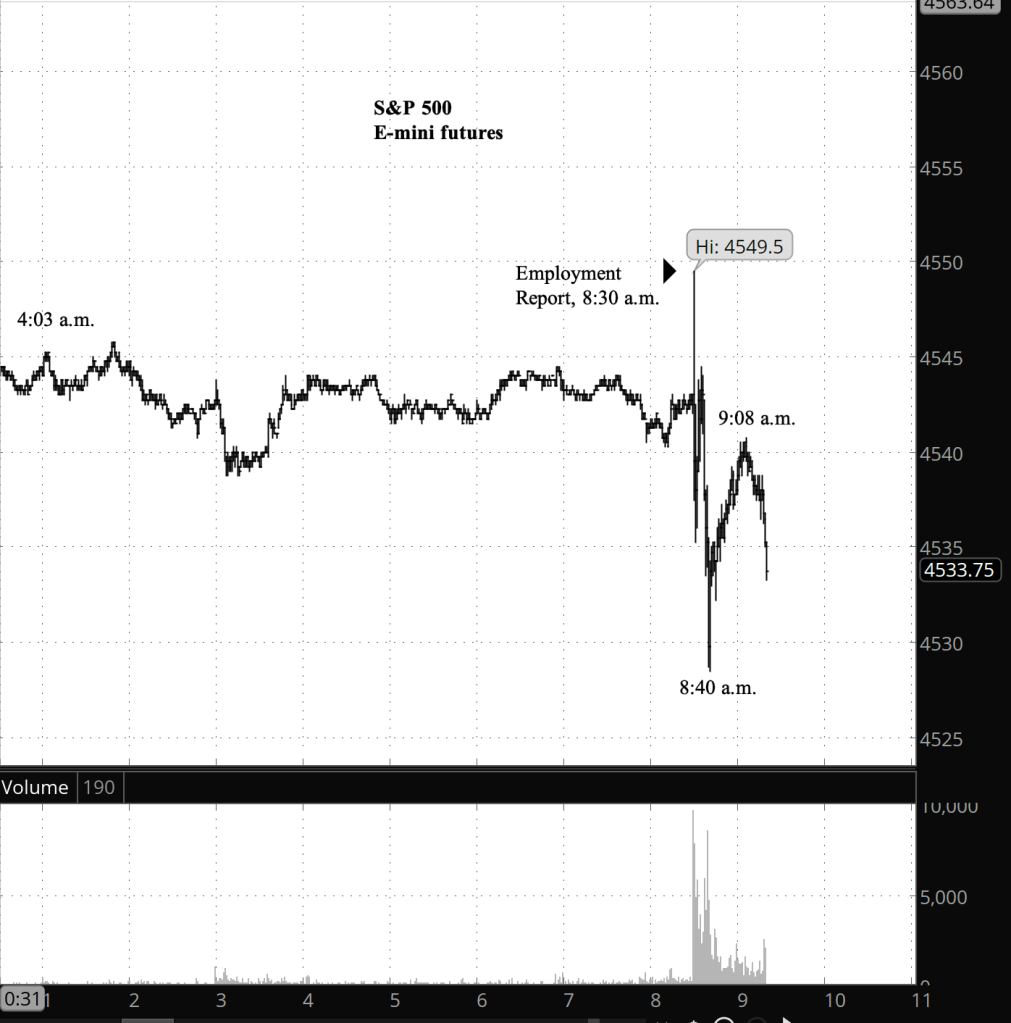
What’s happening now? The rise of the S&P 500 E-mini futures that brought the price to a new high of 4549.50 at 8:30 a.m. was immediately interrupted by a rapid drop lasting 10 minutes and a partial recovery that took 28 minutes to complete, followed by a decline that so far has remained above the morning’s low.

What does it mean? Whether the drama was an artifact of trading algorithms or something more meaningful in the analysis remains to be seen. On the chart I’ve treated the drop and recovery as very low level movements within a larger uptrend that is still underway.

What’s the alternative? The peak can be seen as the end of the uptrend and the drop and partial recovery as the first tentative steps in what will become a far larger correction to the downside.

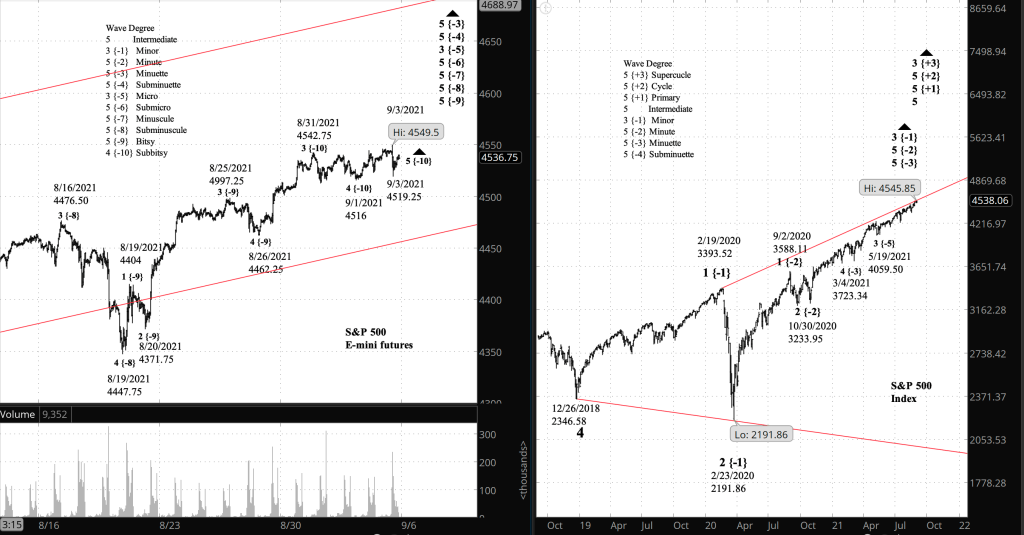
Charts. The upper chart is a close-up of the fluctuations of the E-mini futures at the time of Employment Situation Report was released. The lower chart is a combination showing a longer view of the futures, stretching back to mid-August, on the left, and a very long view stretching back to late 2019 on the right.

[S&P 500 E-mini futures at 9:20 a.m., 1-minute bars, with volume]
[Left: S&P 500 E-mini futures, 45-minute bars, with volume. Right: S&P 500 index, 2-day bars.
Both at 3:30 p.m.]

What does Elliott wave theory say? I’ve kept the principal analysis unchanged from yesterday: Wave 5 of Subbitsy degree within wave 5 of Bitsy degree, which are within a series of the 5th waves of increasing degree up to Submicro degree, whose parent, wave 3 of Micro degree, began on May 19.

Under the alternative analysis, the peak at 8:30 this morning was the end of wave 5 of Subbitsy degree, all the way up to the end of wave 3 of Micro degree. Under this scenario, wave 4 of Micro degree has begun.

Learning and other resources. Elliott wave analysis provides context, not prophecy. As the 20th century semanticist Alfred Korzybski put it in his book Science and Sanity (1933), “The map is not the territory … The only usefulness of a map depends on similarity of structure between the empirical world and the map.” And I would add, we can judge that similarity of structure only after the fact.

See the menu page Analytical Methods for a rundown on where to go for information on Elliott wave analysis.

By Tim Bovee, Portland, Oregon, September 3, 2021

Disclaimer

Tim Bovee, Private Trader tracks the analysis and trades of a private trader for his own accounts. Nothing in this blog constitutes a recommendation to buy or sell stocks, options or any other financial instrument. The only purpose of this blog is to provide education and entertainment.

No trader is ever 100 percent successful in his or her trades. Trading in the stock and option markets is risky and uncertain. Each trader must make trading decisions for his or her own account, and take responsibility for the consequences.

License
Creative Commons License

All content on Tim Bovee, Private Trader by Timothy K. Bovee is licensed under a Creative Commons Attribution-ShareAlike 4.0 International License.

Based on a work at www.timbovee.com.
SP500 Analysis

3:30 p.m. New York time

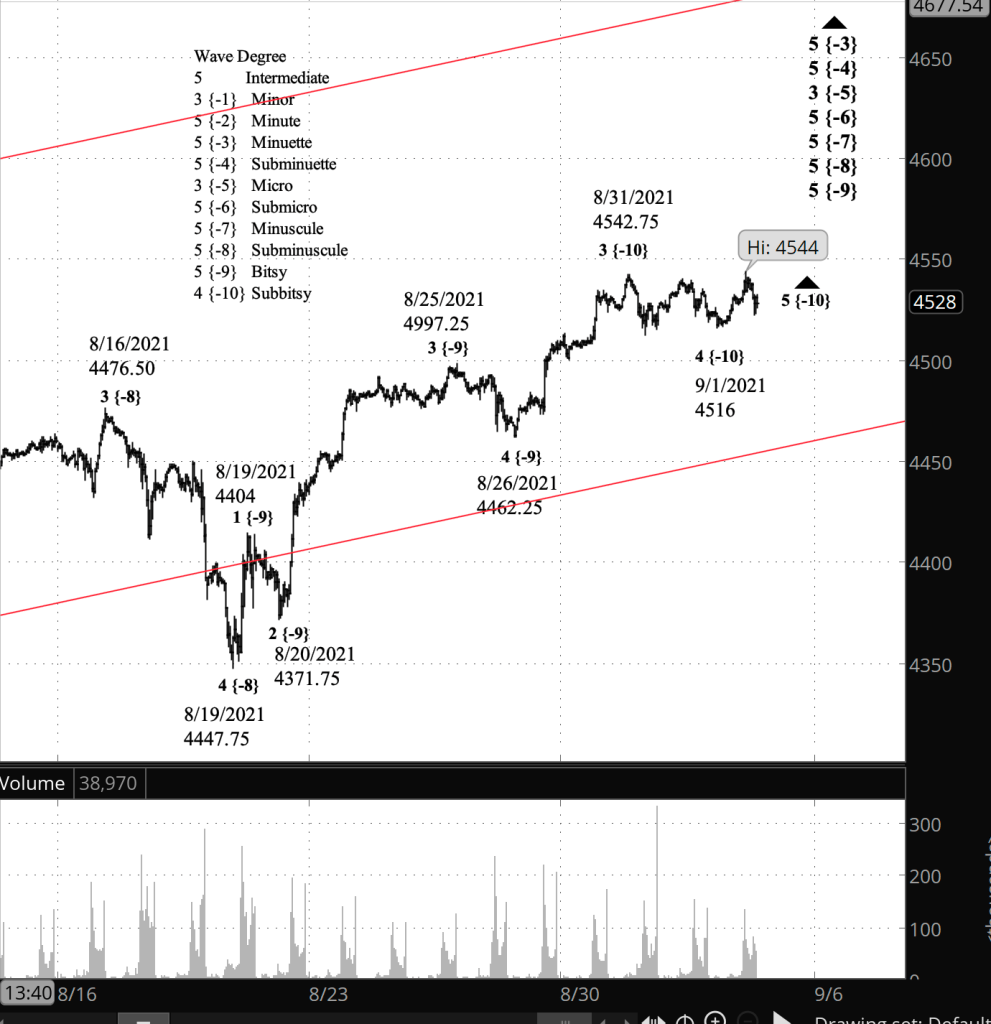
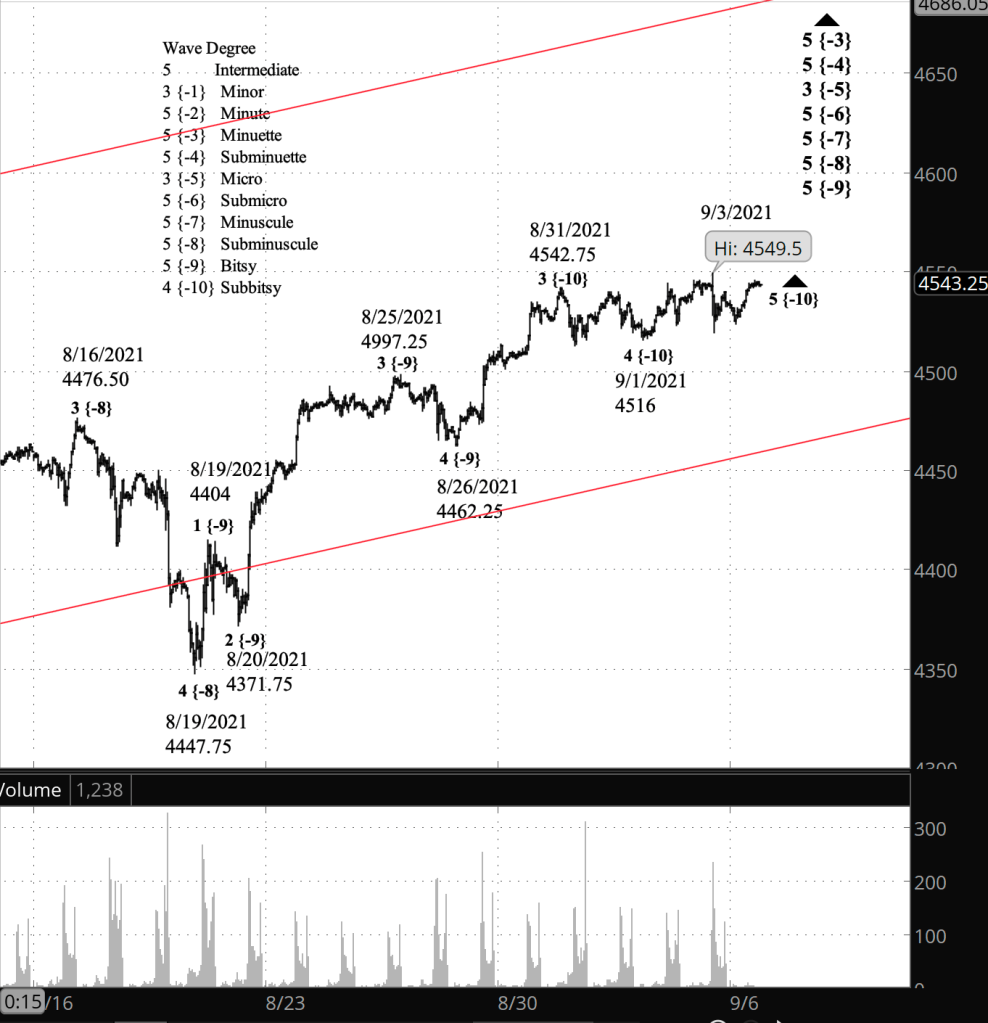
Half an hour before the closing bell. The S&P 500 fell during the day and then paused in the small-degree initial steps in a 5th wave rise to the upside. No change in the analysis beyond the 9:57 a.m. update confirming that wave 5 of Subbitsy degree is underway. I’ve updated the chart, below.

9:57 a.m. New York time

New high. And the S&P 500 futures have reached a new high, 4544, confirming my principal analysis. Chart updated.

9:35 a.m. New York time

What’s happening now? The S&P 500 E-mini futures completed the third leg of their correction from their August 31 high of 4542.25.

What does it mean? Most simple corrections have three legs — down, up, down for a downward correction. The next movement is a resumption of the trend, a rise in this case. Some corrections extend in compound patterns. In that case, the next upward movement is a separator that is followed by second corrective pattern.

My principal analysis, seen on the chart, treats the overnight rise as an early stage of the resumption of the uptrend that began on August 26. It will be confirmed by the price moving above 4542.25.

What’s the alternative? The resumed rise is a separator and will be followed by another corrective pattern, most likely with three subwaves.

[S&P 500 E-mini futures at 3:30 p.m., 40-minute bars, with volume]

What does Elliott wave theory say? Under my principal analysis, the overnight rise is the beginning of wave 5 of Subbitsy degree within a series of four 5th waves of increasingly higher degree, up to wave 5 of Submicro degree. The whole fractal series is within wave 3 of Micro degree. Wave 5 began within the completion of the wave 4 correction of Bitsy after yesterday’s closing bell.

Wave 5 of Subbitsy degree will push upward to new highs, exceeding the August 31 peak of 4542.25. The end of Subbitsy 5 will also be the end of wave 3 of Micro degree and the beginning of a 4th wave correction of the rise that began on May 19 at 4059.50.

Under the alternative analysis, the present rise is wave X of Subbitsy degree, a wave that separates two corrective patterns in a compound structure. Subbitsy wave X will end below the August 31 high of 4542.25.

Learning and other resources. Elliott wave analysis provides context, not prophecy. As the 20th century semanticist Alfred Korzybski put it in his book Science and Sanity (1933), “The map is not the territory … The only usefulness of a map depends on similarity of structure between the empirical world and the map.” And I would add, we can judge that similarity of structure only after the fact.

See the menu page Analytical Methods for a rundown on where to go for information on Elliott wave analysis.

By Tim Bovee, Portland, Oregon, September 2, 2021

Disclaimer

Tim Bovee, Private Trader tracks the analysis and trades of a private trader for his own accounts. Nothing in this blog constitutes a recommendation to buy or sell stocks, options or any other financial instrument. The only purpose of this blog is to provide education and entertainment.

No trader is ever 100 percent successful in his or her trades. Trading in the stock and option markets is risky and uncertain. Each trader must make trading decisions for his or her own account, and take responsibility for the consequences.

License
Creative Commons License

All content on Tim Bovee, Private Trader by Timothy K. Bovee is licensed under a Creative Commons Attribution-ShareAlike 4.0 International License.

Based on a work at www.timbovee.com.