3:30 p.m. New York time
Half an hour before the closing bell. The S&P 500 ended its rise early in the trading day and then took back much of that distance, while remaining above the overnight low of 4485.50 — so far. No change in my analysis, except to reemphasize the possibility that the price will move to a new low, requiring that the endpoint of wave C be repositioned. I’ve updated the chart.
10 a.m. New York time
What’s happening now? Same song different verse. The S&P 500 E-mini futures declined a few points lower in overnight trading, pushing the lower boundary of the expanding triangle pattern lower, and then reversed to the upside. (The triangle is marked in red on the chart.)
What does it mean? The reversal brought the price above the preceding downward reversal for the first time three days, strengthening the likelihood that the 4th leg of the triangle was underway. I expect it to reach the area of the upper boundary of the triangle, presently around 4960. The decline that ended overnight brought the price close to the lower boundary of the price channel of the rise that began March 4 (marked i blue on the chart).
What’s the alternative? It’s possible that the price will reverse and move still lower, meaning that the uptrending 4th leg of the triangle has not yet begun.
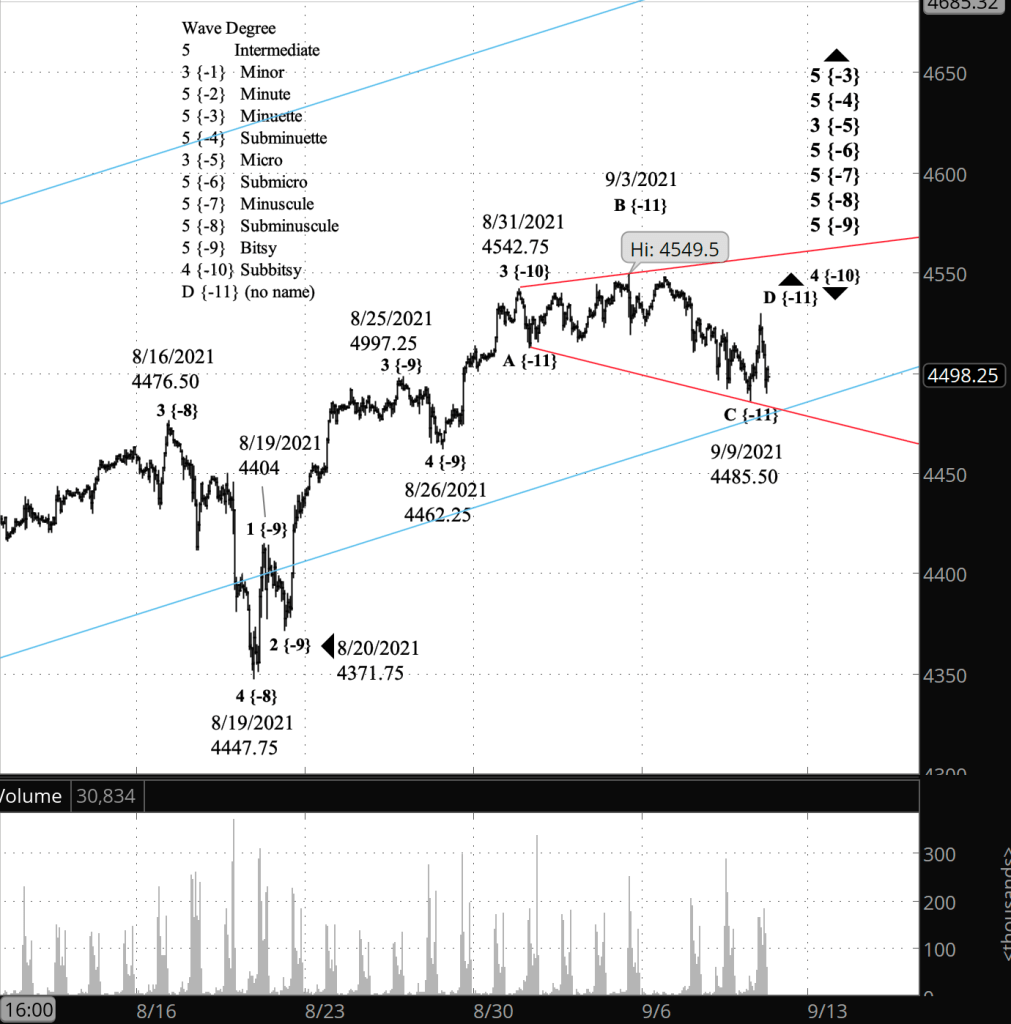
What does Elliott wave theory say? The expanding triangle, which began August 31, will have five waves. The first three — A to the downside, B upside and C downside — are complete, according to my principle analysis. Uptrending wave D is now underway. The triangle in its entirely is wave 4 of Subbitsy degree, a downward correction that will be followed by an upward push wave 5 of Subbitsy degree. The end of Subbitsy 5 will also mark the end of a series of 5th waves of increasingly higher degree, up four levels to Submicro degree, which in turn will mark the end of the parent, wave 3 of Submicro degree. The following wave at that degree will be a 4th wave correction.
Learning and other resources. Elliott wave analysis provides context, not prophecy. As the 20th century semanticist Alfred Korzybski put it in his book Science and Sanity (1933), “The map is not the territory … The only usefulness of a map depends on similarity of structure between the empirical world and the map.” And I would add, we can judge that similarity of structure only after the fact.
Under the alternative analysis, wave C within wave 4 of Subbitsy degree is still underway, and wave D with all of its implications lies in the future. A move to a lower low, below 4485.50, would mean that the alternative analysis is correct.
See the menu page Analytical Methods for a rundown on where to go for information on Elliott wave analysis.
By Tim Bovee, Portland, Oregon, September 9, 2021
Disclaimer
Tim Bovee, Private Trader tracks the analysis and trades of a private trader for his own accounts. Nothing in this blog constitutes a recommendation to buy or sell stocks, options or any other financial instrument. The only purpose of this blog is to provide education and entertainment.
No trader is ever 100 percent successful in his or her trades. Trading in the stock and option markets is risky and uncertain. Each trader must make trading decisions for his or her own account, and take responsibility for the consequences.
License
All content on Tim Bovee, Private Trader by Timothy K. Bovee is licensed under a Creative Commons Attribution-ShareAlike 4.0 International License.
Based on a work at www.timbovee.com.

You must be logged in to post a comment.