3:30 p.m. New York time
Half an hour before the closing bell. The S&P 500 continued to fall during the day, reversing and then falling back to a still lower level, touching the lower boundary of the expanding triangle. No change in the analysis. I’ve updated the chart.
10 a.m. New York time
What’s happening now? Three hours after yesterday’s closing bell, the S&P 500 E-mini futures dropped to a new low, 4479.25, pushing down the lower boundary of an expanding triangle (marked in red on the chart) that began on August 31. This has happened repeatedly in recent days. What differs this time is that the price drop touched the lower boundary of the price channel of the rise that began March 4 (marked in blue). In theory this strengthens the idea that the series of lower lows is over. However, prices routinely pierce the boundaries of price channels, so nothing is guaranteed. It does signify that the end is near.
What does it mean? As with the past lower lows on the triangle boundary, my principal analysis has marked the low as the end of the decline that began September 3 and the beginning of a new rise back to the upper boundary of the triangle.
What’s the alternative? A new lower low means that the decline is still underway.
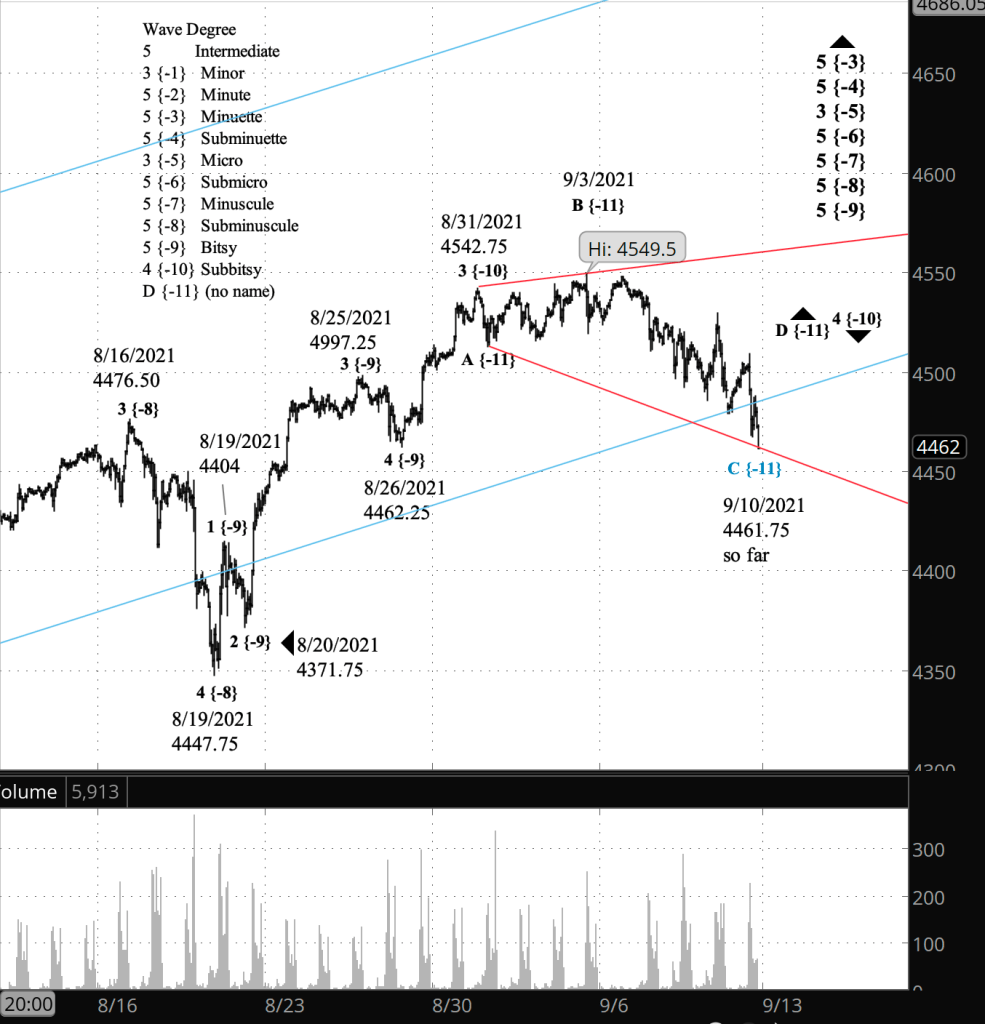
What does Elliott wave theory say? First micro, then macro. At the small degrees, the low from last night marks the end of wave C within wave 4 of Subbitsy degree, and the beginning of wave D, which will carry the price back to the upper boundary of the expanding triangle (red on the chart), which is presently around 4560. Expanding triangles have five waves internally, so the wave E that follows will bring the price back down to the triangle’s lower boundary, ending the Subbitsy wave 4. Since the lower boundary moves further down each day, wave E will travel further than the preceding wave D to meet its end.
At the larger degrees, the rise since March 4, wave 5 of Minuette degree has been encompassed by a price channel marked in blue on the chart. The end of Minuette wave 5 will also mark the end of 5th waves of increasing degree all the way up to the Supercycle level, which is a very big deal indeed, since it will mark the start of a downtrend of epic proportions.
From small to large, with subscripts:
- Wave 4 of Subbitsy degree {-10} (the expanding triangle, in red), when complete,
- will mark the start ofWave 5 of Bitsy degree {-9} within
- within wave 5 of Subminuscule degree {-8}
- within wave 5 of Minuscule degree {-7}
- within wave 5 of Submicro degree {-6}
- within wave 3 of Micro degree {-5}, which will be followed by a correction, wave 4 of Micro degree, and then a 5th wave pushing up to mark the end of
- the parent wave, 5 of Subminuette {-4} degree
- within wave 5 of Minuette degree {-3} (the price channel, in blue)
- within wave 5 of Minute {-2} degree
- within wave 3 of Minor degree {-1}, whose completion will be followed by a signifiant 4th wave correction and then a 5th wave movement to higher highs,
- which will complete wave 5 of Intermediate degree {no subscript}
- within wave 5 of Primary degree {+1}
- within wave 5 of Cycle degree {+2}
- within wave 5 of Supercycle degree {+3}, which began in 1932.
Learning and other resources. Elliott wave analysis provides context, not prophecy. As the 20th century semanticist Alfred Korzybski put it in his book Science and Sanity (1933), “The map is not the territory … The only usefulness of a map depends on similarity of structure between the empirical world and the map.” And I would add, we can judge that similarity of structure only after the fact.
See the menu page Analytical Methods for a rundown on where to go for information on Elliott wave analysis.
By Tim Bovee, Portland, Oregon, September 10, 2021
Disclaimer
Tim Bovee, Private Trader tracks the analysis and trades of a private trader for his own accounts. Nothing in this blog constitutes a recommendation to buy or sell stocks, options or any other financial instrument. The only purpose of this blog is to provide education and entertainment.
No trader is ever 100 percent successful in his or her trades. Trading in the stock and option markets is risky and uncertain. Each trader must make trading decisions for his or her own account, and take responsibility for the consequences.
License
All content on Tim Bovee, Private Trader by Timothy K. Bovee is licensed under a Creative Commons Attribution-ShareAlike 4.0 International License.
Based on a work at www.timbovee.com.

[…] The chart. I’ve reworked the labeling to show the first, principal analysis. For a view of the now-alternative analysis, see Friday’s chart. […]
LikeLike