3:30 p.m. New York time
Half an hour before the closing bell. TheS&P 500 made a small upward correction from this morning’s low and then pressed downward again, reaching 4434.50 so far. The rapid resumption of the downward movement adds additional weight in favor of my principal analysis, that the 3rd wave of Micro degree peaked on September 3, and what follows has been a 4th wave correction within wave 5 of Subminuette degree, one level higher. No change in the analysis. I’ve updated the chart.
10:20 a.m. New York time
What’s happening now? The S&P 500 fell in early morning trading, reaching a new low of 4446.50 and then rising again as the opening bell approached.
What does it mean? My principal analysis would identify the peak of September 3, at 4549.50, as the end of the rise that began on May 19 and the beginning of a decline.
What’s the alternative? Another analysis, one that I’ve preferred up to now, sees the decline from September 3 as an expanding triangle in a rise that began on August 31.
The chart. I’ve reworked the labeling to show the first, principal analysis. For a view of the now-alternative analysis, see Friday’s chart.
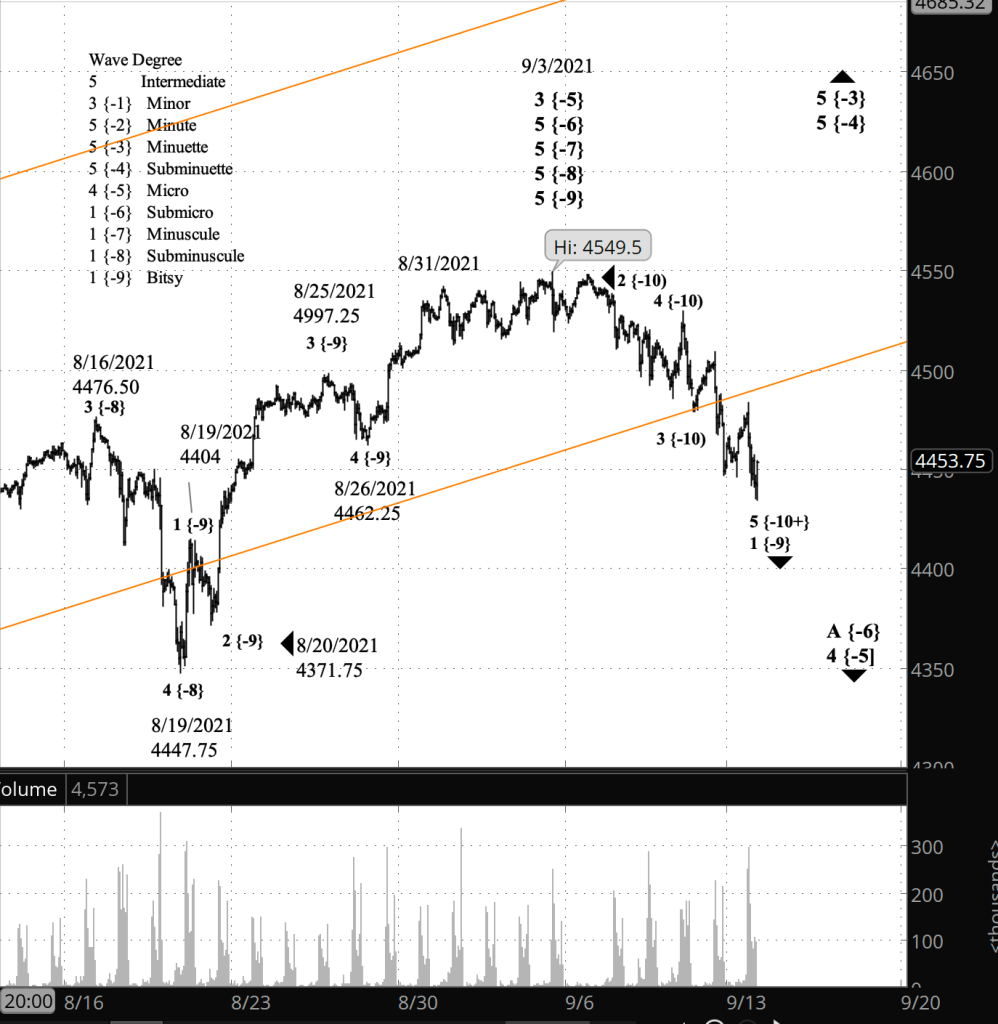
What does Elliott wave theory say? I’ve promoted the former alternative analysis to principal analysis for two reasons: 1) The decline from September 3 shows a clear five-wave pattern. If it were part of an expanding triangle, it would be three waves, and 2) the power of the downside suggests a decline rather than a 4th-wave triangle, which would be more measured in either direction.
It is possible that the alternative analysis will prove to be correct. It seems to me that the preponderance of evidence favors the principal analysis.
And what sort of decline are we seeing?
In prior analysis I’ve described a scenario in which the end of wave 5 of Subbitsy degree marks the end of a series of 5th waves up four levels to Submicro degree, and the end of wave 3 of Micro degree, one level up. In my principal analysis, the high of September 3 was the end of wave 3 of Submicro degree, triggering all of the endings up the fractal ladder. This is all happening within wave 5 of Subminuette degree.
Wave 3 of Submicro degree began on May 19, and its end is the start of Submicro wave 4, now underway. As a 4th wave it is more likely to trace a Flat pattern. Submicro 3 began from around 4060, and the endpoint was around 4550, a distance of 490 points. A Fibonacci 38.6% retracement — not uncommon in 4th waves — would move the price down to the 4360s, about 100 points below where it is today.
Learning and other resources. Elliott wave analysis provides context, not prophecy. As the 20th century semanticist Alfred Korzybski put it in his book Science and Sanity (1933), “The map is not the territory … The only usefulness of a map depends on similarity of structure between the empirical world and the map.” And I would add, we can judge that similarity of structure only after the fact.
See the menu page Analytical Methods for a rundown on where to go for information on Elliott wave analysis.
By Tim Bovee, Portland, Oregon, September 13, 2021
Disclaimer
Tim Bovee, Private Trader tracks the analysis and trades of a private trader for his own accounts. Nothing in this blog constitutes a recommendation to buy or sell stocks, options or any other financial instrument. The only purpose of this blog is to provide education and entertainment.
No trader is ever 100 percent successful in his or her trades. Trading in the stock and option markets is risky and uncertain. Each trader must make trading decisions for his or her own account, and take responsibility for the consequences.
License
All content on Tim Bovee, Private Trader by Timothy K. Bovee is licensed under a Creative Commons Attribution-ShareAlike 4.0 International License.
Based on a work at www.timbovee.com.

You must be logged in to post a comment.