3:30 p.m. New York time
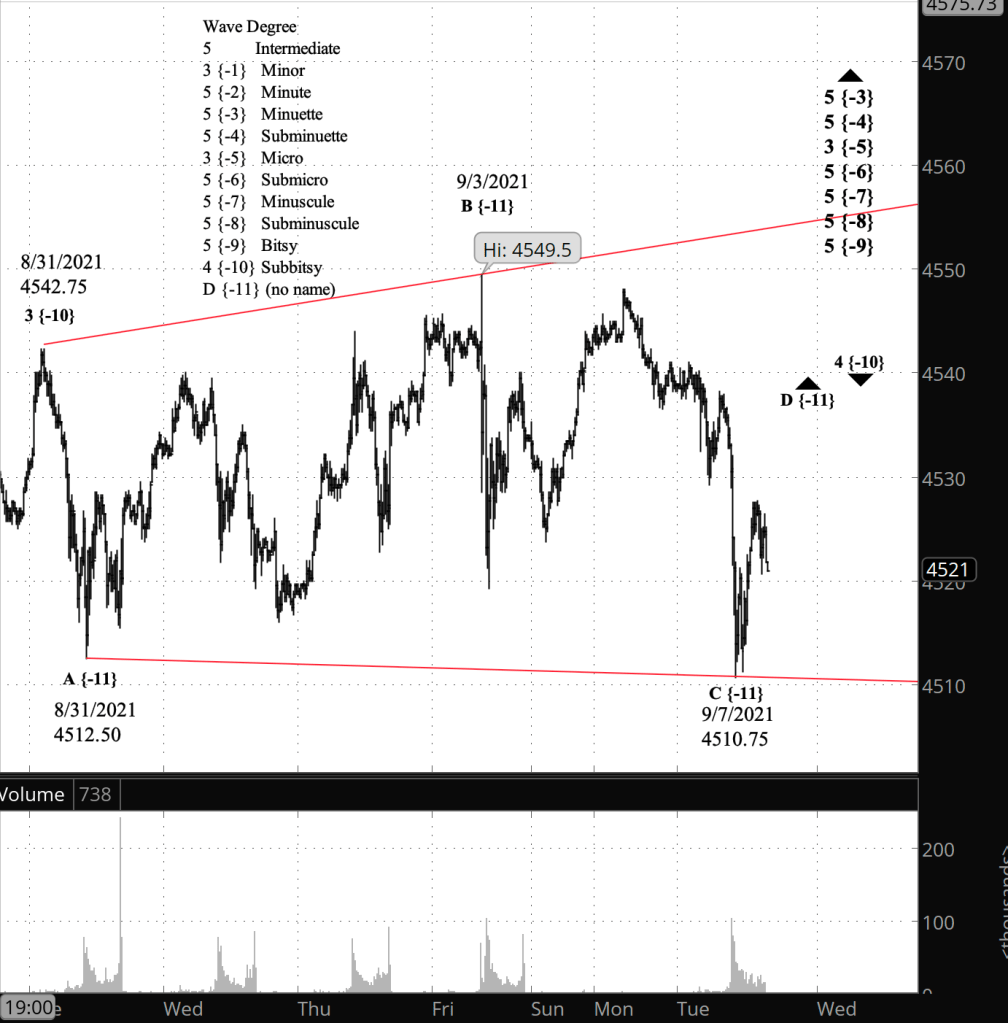
Half an hour before the closing bell. The sharp decline during the day brought clarity to the chart. I’ve promoted my alternate analysis from this morning to principal analysis. The present movement is wave 4 of Subbitsy degree, a correction within the parent, wave 5 of Bitsy degree. These are small degrees, and the chart includes waves with a subscript — {11} — so small that I haven’t named it. The red lines, a price channel for Subbitsy wave 4, clearly shows an expanding triangle as the structure of the correction.
I’ve added a close-up chart of Subbitsy wave 4 and have left this morning’s chart as it was just after the opening bell.
9:35 a.m. New York time
What’s happening now? The S&P 500 E-mini futures continued their decline that began yesterday within a larger uptrend that began on September 1.
What does it mean? The decline is part of the early price movements within the rising final leg of the September uptrend.
What’s the alternative? The correction may have still be underway, taking the form of an expanding triangle.
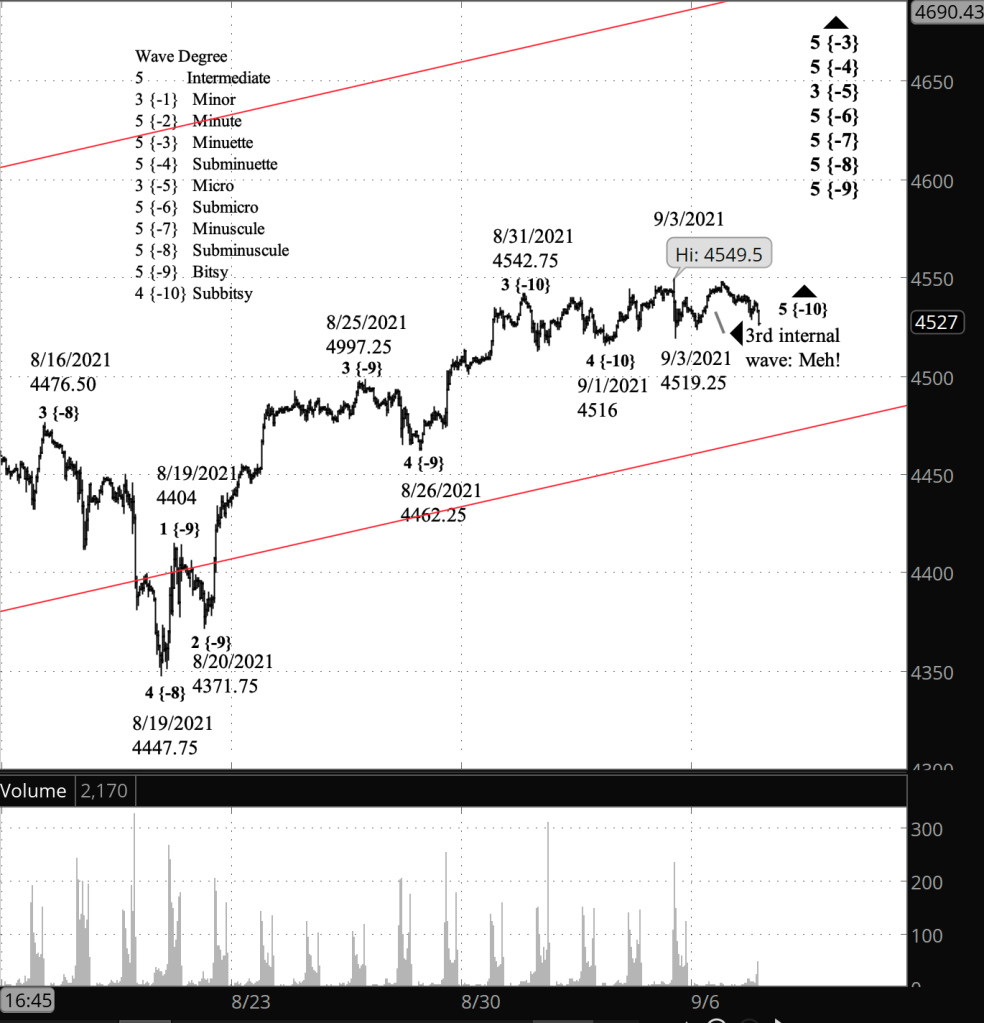
What does Elliott wave theory say? The alternative analysis — the continuing correction — remains possible because the price remains below the September 3 high of 4549.50. Under my principal count, wave 5 of Subbitsy degree began on September 1. But the pattern within wave 5 that has emerged bears little resemblance to a move in the direction of the trend — a Motive Wave in the terminology of Elliott wave theory. In a Motive Wave, the 3rd wave takes off like rocket as the market accepts the trend as real. The 3rd internal wave of Subbitsy 5 is more of a shrug and a “Meh!” than a rocket.
The reason I’ve stuck to my principal analysis — the correction ended on September 5 — is because the high of September 3 exceeds the end of wave 3 of Subbitsy degree, on August 31. That doesn’t happen with the common corrective patterns — a Zigzag or a Flat — and so that high is likely to be a resumption of the trend.
However, there is a way to count the chart so that the correction is still underway. If the decline that began on August 31 was an expanding triangle, then the higher high on September 3 is within the rules of Elliott wave analysis. Under this scenario, the triangle’s 4th wave ended at the September 3 low of 4519.25, and the final 5th wave of the triangle is underway. When it is complete, then either wave 5 of Subbitsy degree begins, or there is an X-wave that creates a compound correction, with a second corrective pattern within Subbitsy wave 4.
That’s a long way of saying that this chart is messy, filled with ambiguity that will no doubt be resolved in the next few days of trading.
Learning and other resources. Elliott wave analysis provides context, not prophecy. As the 20th century semanticist Alfred Korzybski put it in his book Science and Sanity (1933), “The map is not the territory … The only usefulness of a map depends on similarity of structure between the empirical world and the map.” And I would add, we can judge that similarity of structure only after the fact.
See the menu page Analytical Methods for a rundown on where to go for information on Elliott wave analysis.
By Tim Bovee, Portland, Oregon, September 7, 2021
Disclaimer
Tim Bovee, Private Trader tracks the analysis and trades of a private trader for his own accounts. Nothing in this blog constitutes a recommendation to buy or sell stocks, options or any other financial instrument. The only purpose of this blog is to provide education and entertainment.
No trader is ever 100 percent successful in his or her trades. Trading in the stock and option markets is risky and uncertain. Each trader must make trading decisions for his or her own account, and take responsibility for the consequences.
License
All content on Tim Bovee, Private Trader by Timothy K. Bovee is licensed under a Creative Commons Attribution-ShareAlike 4.0 International License.
Based on a work at www.timbovee.com.

You must be logged in to post a comment.