Live: Thursday, April 26, 2018

4/26 – 3:15 p.m. New York time

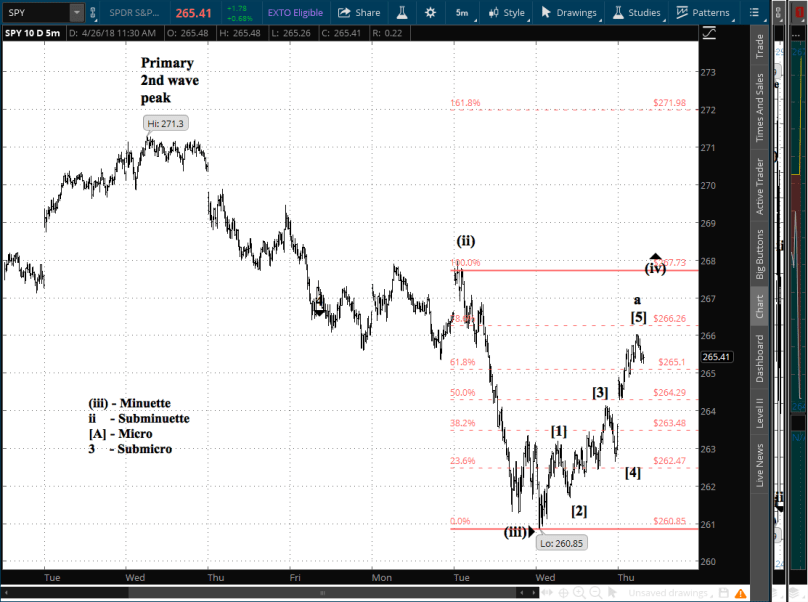
SPY continued to rise in an A-wave upward correction at the Subminuette level, exceeding the 78.7% Fibonacci level. I entered no new positions today and exited none of my existing positions.

4/26 – 11:35 a.m. New York time

SPY on Wednesday moved into a 4th wave correction to the upside in the Minuette degree. It has in a Subminuette A wave retraced 78% of the Minuette 3rd wave decline. Since SPY is now in a 4th wave and the 2nd wave was a zig-zag, then by the principle of alteration the present move ought to be a flat (sideways) move.

I’m uncertain about the degrees that I’m using on my count, but ultimately, it doesn’t matter for my decision. I know SPY is in a 4th of wave of some degree, and the next move is likely to be to the downside, either as a B wave of some degree or as a 5th wave in the direction of the impulse downtrend. Either one will trigger the Fisher Transform into a downtrending mode, signaling an exit.

My SPY positions were analyzed at entry here and here.

Below, a 10-day SPY chart with 5-minute bars, annotated with my Elliott wave count and the Fibonacci retracement of the Subminuette A wave correction (a) discussed above.
SPY20180426a

By Tim Bovee, Portland, Oregon April 26, 2018
Read More »

Live: Wednesday, April 25, 2018

4/25 – 3:05 p.m. New York time

No trades today. Little change in the chart from this morning.

4/25 – 11:05 a.m. New York time

SPY continues its decline, continuing the trend that began after the April 18 peak. My chart analysis of Tuesday remains valid. The Fisher Transform this morning still signals a downtrend. So at this point I see no need for action on my two bear positions on SPY, which I analyzed here and here.

By Tim Bovee, Portland, Oregon April 25, 2018

Read More »

Live: Tuesday, April 24, 2018

4/24 – 3:15 p.m. New York time

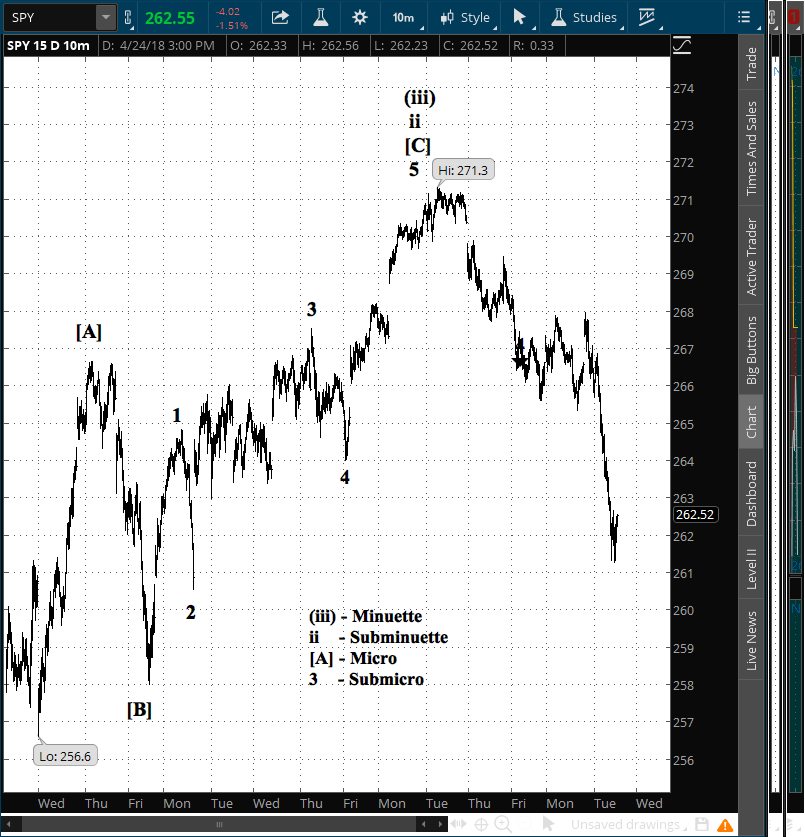
The magnitude of today’s decline has led me to revise my Elliott wave analysis, although ambiguities remain.

I am now counting the 5th wave of Submicro degree to have been completed on April 18. In my previous analysis I had labeled it as the end of the 3rds Submicro wave.

If wave [C] of the Micro wave is indeed the end of the correction, then we will have begun a 3rd wave to the downside at the Subminuette level, which will be quite bearish and therefore beneficial to my positions.

However, it is also possible that the correction is extending into more complex patterns, in which case the Subminuette 2nd wave is continuing.

Time will tell which is the correct count. As the late baseball great Yogi Berra put it, “It ain’t over ’til it’s over.”

Below, a 15-day chart with 10-minute bars on SPY:

spy20180424

4/24 – 11:30 a.m. New York time

SPY’s course remains consistent with the chart analysis posted Friday in my April 20 live feed; the Fisher Transform continues to show downtrending. I anticipate no trades today unless either of those metrics changes. (Analysis upon entry of my two bear positions on SPY are here and here.)

By Tim Bovee, Portland, Oregon April 24, 2018

Read More »

Live: Monday, April 23, 2018

4/23 – 3:05 p.m. New York time

The SPY daily-chart Fisher Transform remains downtrending. No trades today.

I use the Fisher as a trigger for action, although my decision on what action should be taken relies on Elliott wave analysis, a far more subtle way of looking at the charts.

4/23 – 11:25 a.m. New York time

The chart analysis included in my April 20 live feed remains consistent with today’s early trading of SPY, which remains within Friday’s range. (Entry analyses of my positions are here and here.) And my exit signal remains unchanged; I shall close the positions when the Fisher Transform moves from its present downtrending signal to an uptrending signal. Given the present state of the chart, a trade out seems unlikely today.

By Tim Bovee, Portland, Oregon April 23, 2018

Read More »

The Week Ahead: GDP, housing, manufacturing, trade

Traders will get a first look at 1st quarter gross domestic product, including the GDP deflator, a measure of prices said to be the preferred metric of money regulators, on Friday at 8:30 a.m. New York time.

A handful of other major reports during the week spans the economy:

  • Housing: Existing home sales on Monday and new home sales on Tuesday, each at 10 a.m., along with a report that breaks out regional variations, the Case-Shiller home price index for 20 metropolitan areas, out Tuesday at 9 a.m.
  • Manufacturing: Durable goods orders on Thursday at 8:30 a.m. and the Purchasing Managers index composite flash report.
  • Exports vs. imports: international trade in goods on Thursday at 8:30 a.m.

Read More »

Live: Friday, April 20, 2018

4/20 – 3:15 p.m. New York time

With less than an hour to go before the closing bell, SPY and the S&P 500 have traced out a net decline for the day. My count shown in the chart, below, stands.

I placed no trades today. Look for The Week Ahead to be posted on Saturday.

4/20 – 10:40 a.m. New York time

The S&P 500 and its exchange-traded fund SPY are continuing the decline that began on April 18. My bear positions, whose entry analyses are here and here, are benefitting from the decline.

However, the Elliott wave count shows that after the present Submicro 4th wave to the downside is complete, a 5th wave will push upward, exceeding $271.30 on the SPY chart by an unpredictable distance. My positions expire May 18, which is 28 days from today, and so my best strategy will be to exit during the 4th wave of the Submicro degree and roll my positions forward to a later expiration.

I intend to use the daily chart Fisher Transform as my exit signal. It moved to downtrending on April 19 after a two-week-long uptrending signal. A return to uptrending will tell me to get out of the positions immediately.

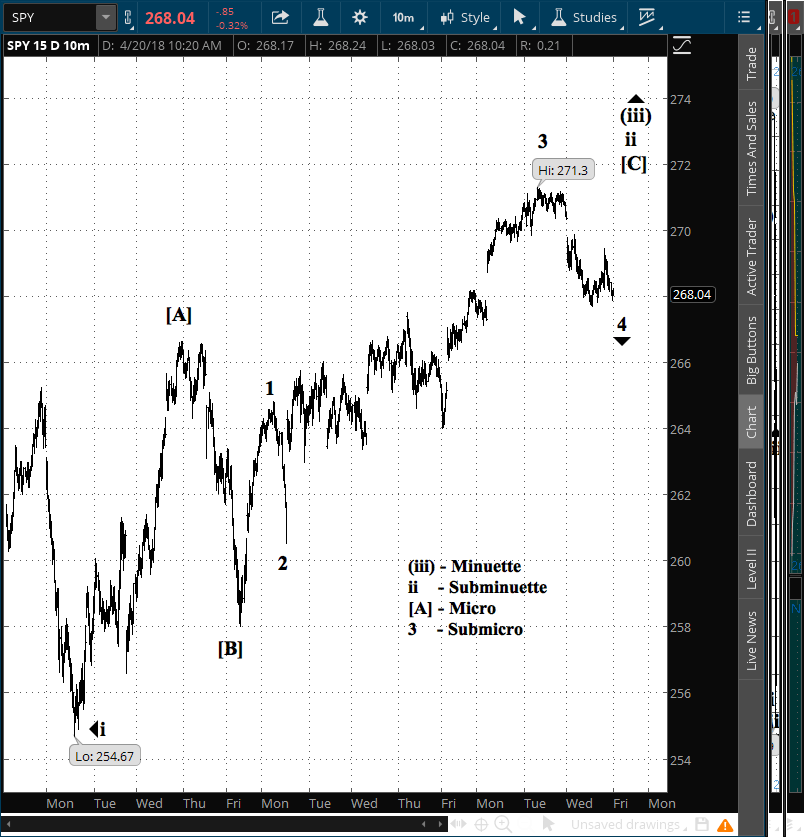
I have updated the 15-day, 10-minute-bars chart this morning to show the current Elliott wave count.

spy20180420

By Tim Bovee, Portland, Oregon, April 20, 2018

Read More »

Live: Thursday, April 19, 2018

4/19 – 3:20 p.m. New York time

The SPY metrics are largely unchanged from the market open, and I have placed no trades today, neither entering nor exiting positions.

4/19 – 10:45 a.m. New York time

The S&P 500 declined in early trading this morning, and more notably, the daily chart Fisher Transform signaled a downtrend for the first time since April 3. Volume continued to fall through Wednesday’s trading, and the advance-decline ratio continued to decline for a second consecutive day.

All of which indicate a waning enthusiasm for the blue chips, which is a good sign for my bear positions in SPY, the fund that tracks the index. The entry analyses are here and here,

In Elliott wave terms, the decline can be interpreted as the beginning of a 4th wave correction of within the Micro-level C wave that began April 6. But it could also be seen as a continuation of the 3rd wave within C. Time will tell.

By Tim Bovee, Portland, Oregon, April 19, 2018Read More »

Live: Wednesday, April 18, 2018

4/18 – 3:05 p.m. New York time

With less than an hour before the closing bell the SPY remains little changed from this morning. I placed no trades today.

4/18 – 10:40 a.m. New York time

The S&P 500 and its largest exchange traded fund SPY has paused this morning, with the advance/decline ratio declining below its level of the last two trading days and implied volatility ticking up a bit. I continue to be in wait-and-see mode and anticipate no trades today. The entry analysis of my SPY positions can be found here and here,

By Tim Bovee, Portland, Oregon, April 18, 2018

Read More »

Live: Tuesday, April 17, 2018

4/17 – 3:15 p.m. New York time

As the closing bell approaches there has no been no change in this morning’s analysis of SPY. I shall end the day without any trades, neither in nor out.

4/17 – 11:45 a.m. New York time

The underlying symbol of my bear positions, SPY, continues to rise as anticipated in my Elliott wave analysis on Monday.

My positions, whose analyses are here and here, expire in 29 days, and practically speaking I would want to roll out in 22 days. The present rise, using the Fisher transform as a marker, has been going on for 13 days. The level i’m looking at on the chart has movements that last a couple of weeks, on average.

Moreover, volume has been declining as the price rises, a suggestion of flagging interest. Contrarily, the Advance/Decline ratio has shown rising breadth — more risers as a percentage of all stocks — suggesting that the rise is a broad movement within the markets.

At this point I’m inclined to wait a bit and see what happens.

By Tim Bovee, Portland, Oregon, April 17, 2018

Read More »

Live: Monday, April 16, 2018

4/16 – 3:10 p.m. New York time

I placed no trades today, opening no new positions and taking no action on my SPY positions, whose analyses are here and here. The positions expire May 18, so there is time, in Elliott wav terms, for Submicro waves 3, 4 and 5 to complete their work.

This morning’s gap to the upside, which carried the price above the presumed end of the Submicro 3rd wave on April 13,  changed my preferred Elliott wave analysis of the SPY chart. The Micro-level C wave remains in progress, with the Submicro 3rd wave continuing to work its way higher.

The quandary is this. the 4th wave , if it follows the common pattern, will be a sideways movement, which may lock my positions into unprofitability until wave 5 is complete. That makes a good case for taking the loss on the positions on Tuesday and re-entering when the Minuette-level 3rd wave to the downside begins.

The chart is for SPY, with a bit more than an hour to go in today’s trading.

spy20180416

4/16 – 11:40 a.m. New York time

No trades in sight today unless there’s a dramatic intra-day move on SPY. My goal today will be to continue my Elliott wave analysis of low level movements to gain a better understanding of where my SPY positions stand.

By Tim Bovee, Portland, Oregon, April 3, 2018

Read More »