7:08 p.m. New York time
Tariff Shock. President Trump announced quid-pro-quo tariffs after the closing bell, and the S&P 500 futures responded with a drop from 5773.25 to 5481.
The magnitude of the drop required an Elliott Wave Theory re-analysis of the chart, which I have done.
In this discussion I shall use the numbering system that appears on the chart. Each wave has a number or a letter followed by a subscript, in curly brackets, that shows the wave’s distance from Intermediate degree in the fractal structure of the chart. The present Intermediate wave is wave 5{0}, which began in February 2016.
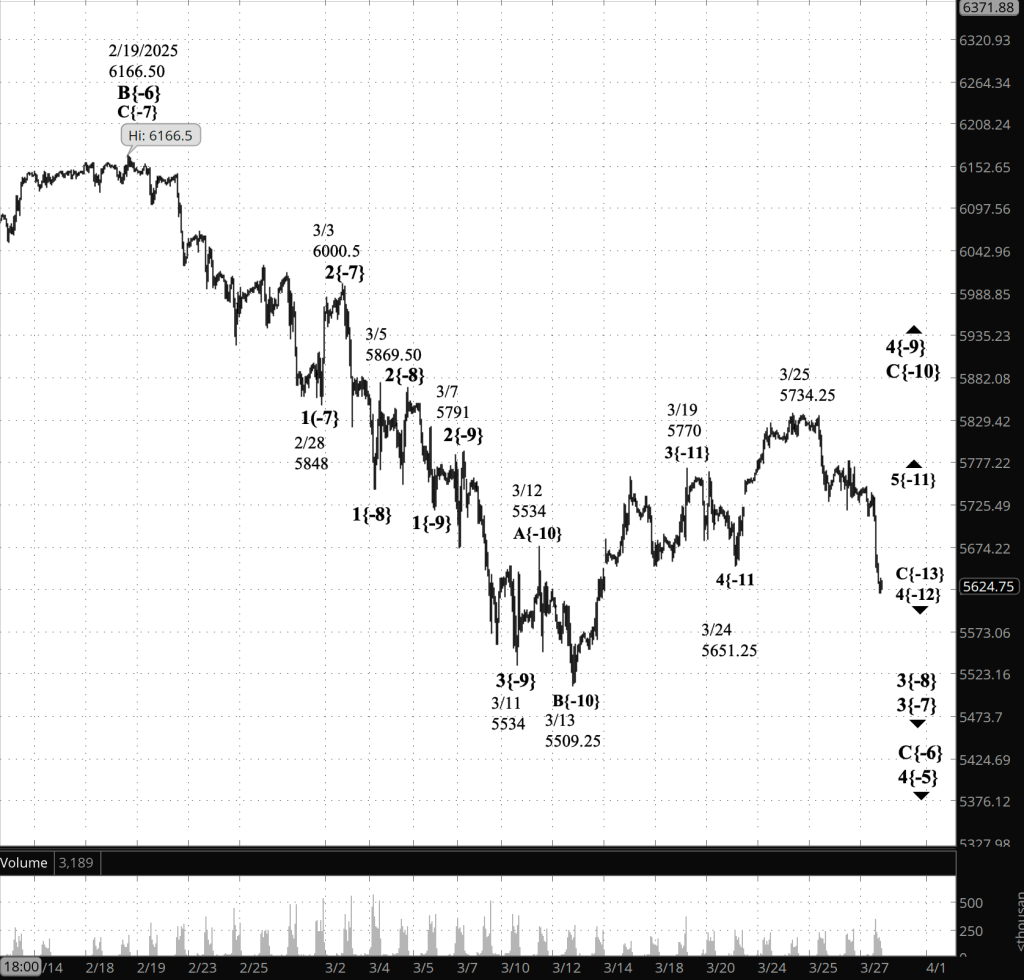
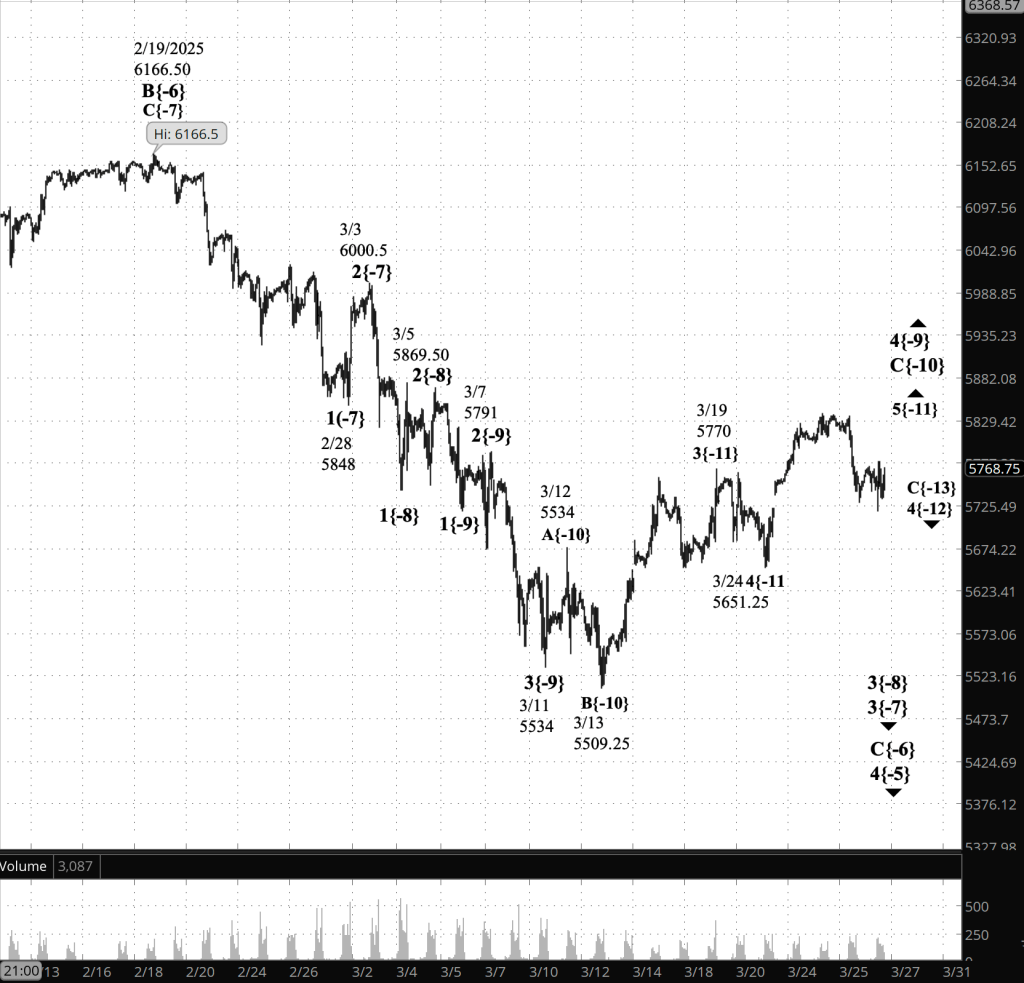
Declining Wave C{-6} within declining wave 4{-5} continues, as it has since last February 19. The March 13 low, 5509.25, marked the end of Wave A{-7}. The March 25 high was the end of wave B{-7} and the decline that began on April 2, including the tariff drop, is wave C{-7} and is still underway. I count today’s decline as being wave 3{-8} within the parent C wave.
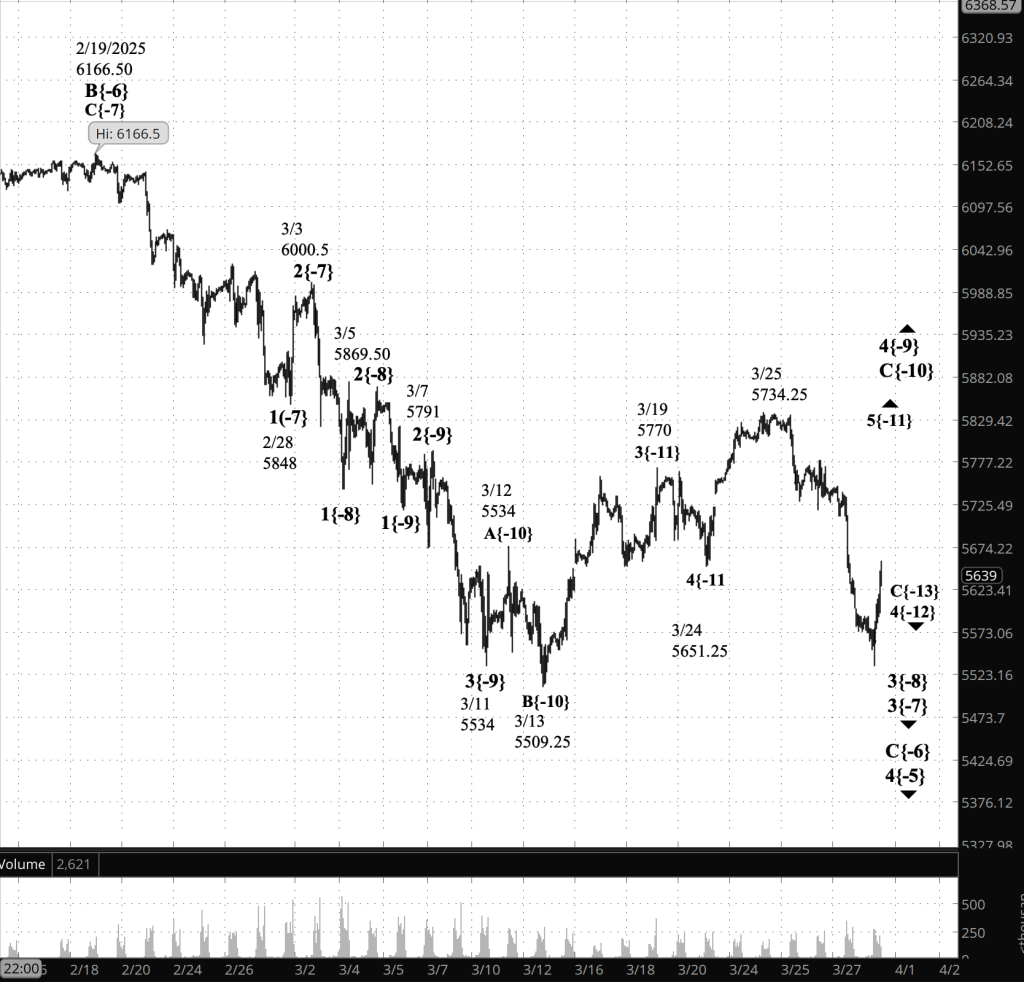
Here’s a post-announcement chart showing the revised analysis, and I’ve retained the earlier session-close analysis below for comparison.

[S&P 500 E-mini futures at 6:42 p.m, 70-minute bars, with volume]
3:30 p.m. New York time
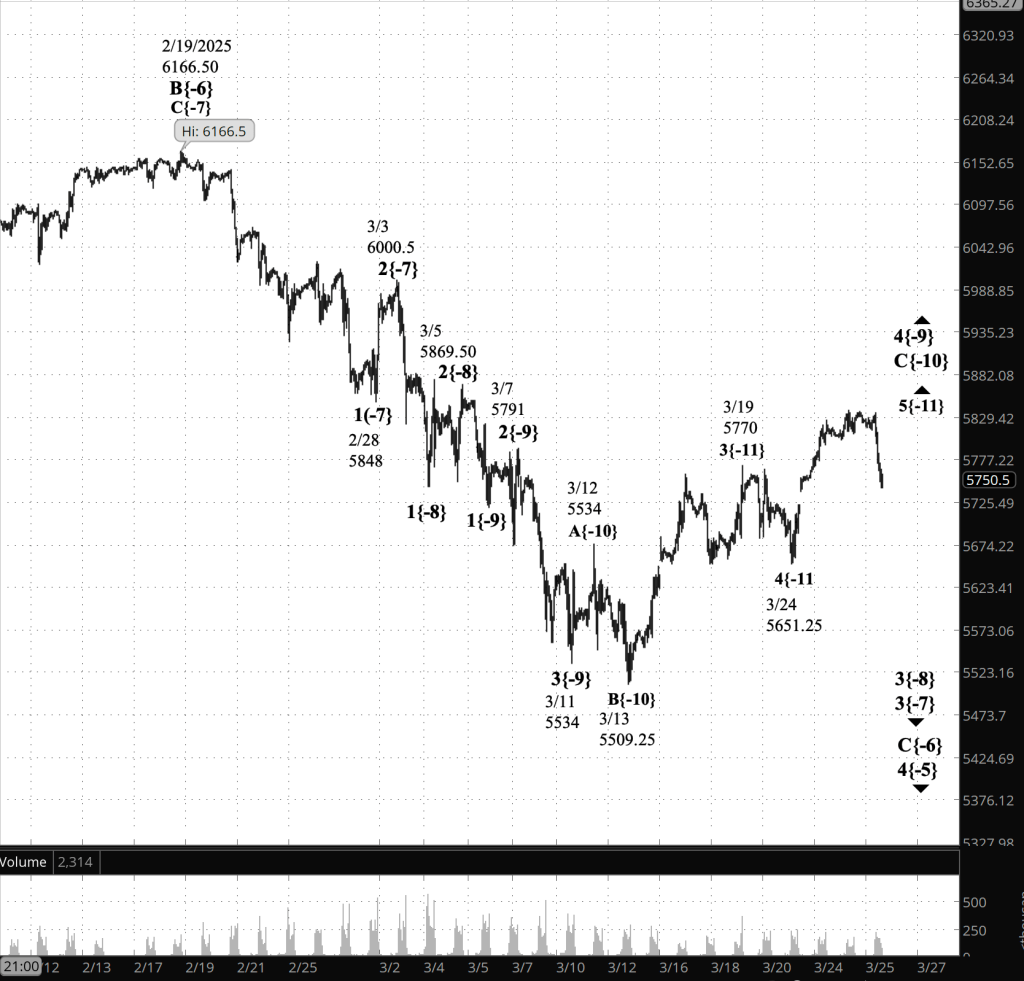
Half an hour before the closing bell. The S&P 500 futures peaked at 5759.25 during the session and then reversed, so far reaching into the 5670s. Today’s session was a waiting game for President Trump’s announcement of new tariffs just after the closing bell sounds.
Meanwhile, the morning Elliott Wave Theory analysis is unchanged.
Since the S&P 500 futures we all follow trade after the closing bell and throughout the night, I’ll be checking the chart after hours and, if there’s anything of interest, I’ll do an additional update.
9:35 a.m. New York time
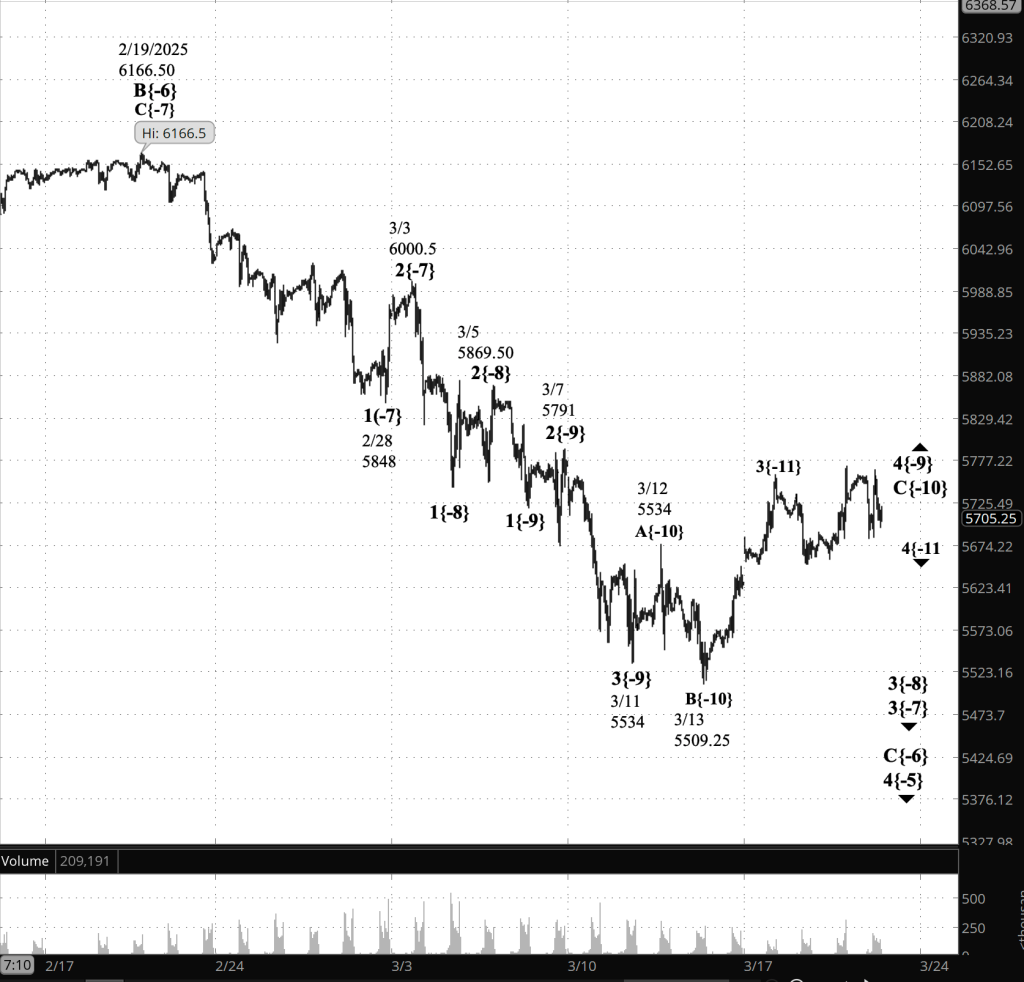
What’s happening now? The S&P 500 E-mini futures fell overnight, from the 5690s to the 5610s.
What does it mean? The decline in Elliott Wave Theory is a counter-movement within a rising wave that began on March 31 from 5533.25. The rise is part of the final subwave, wave C, within a 4th-wave downward correction.
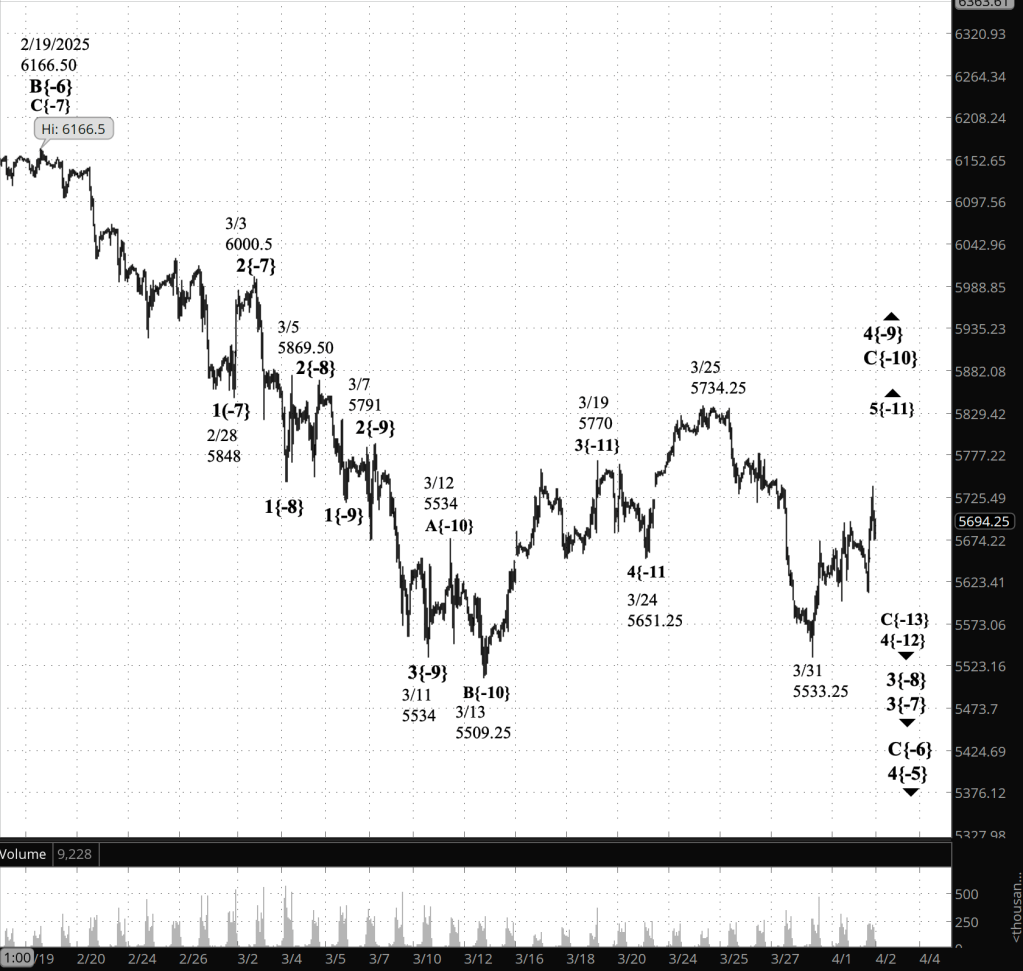
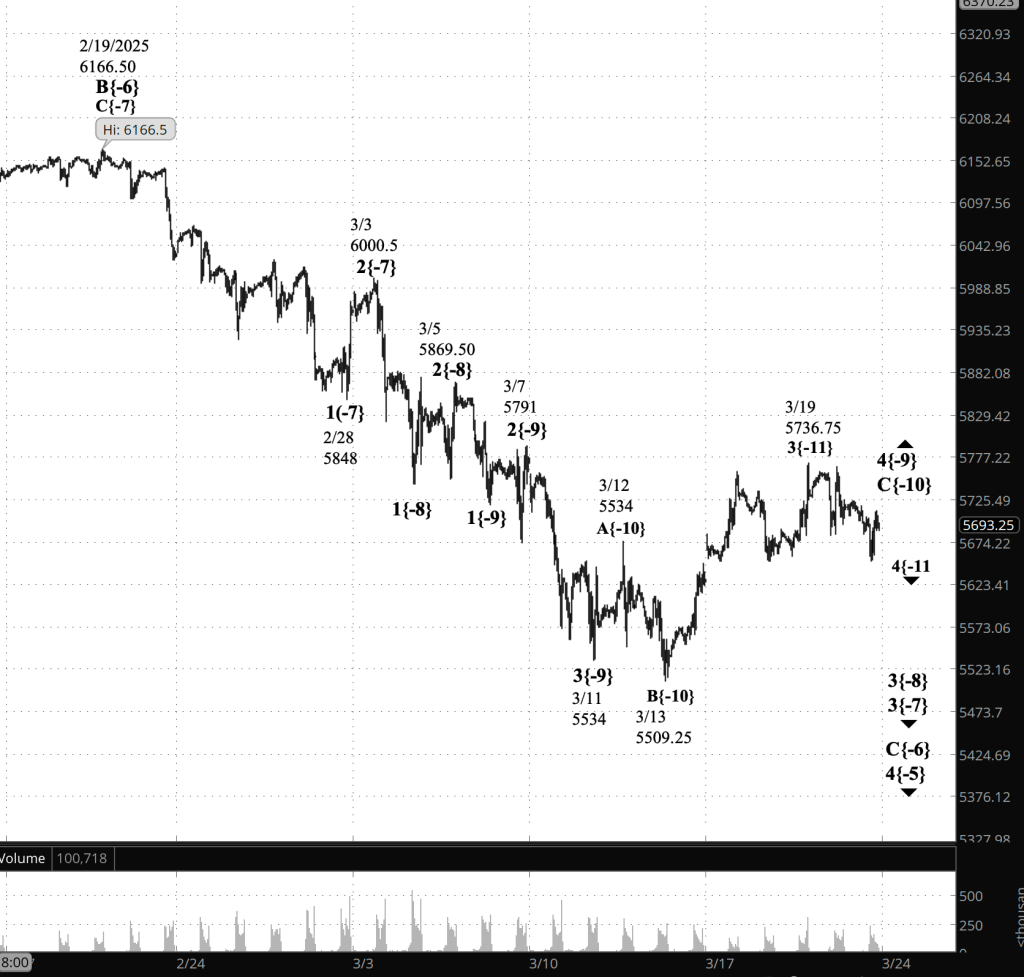
[S&P 500 E-mini futures at 3:30 p.m, hourly bars, with volume]
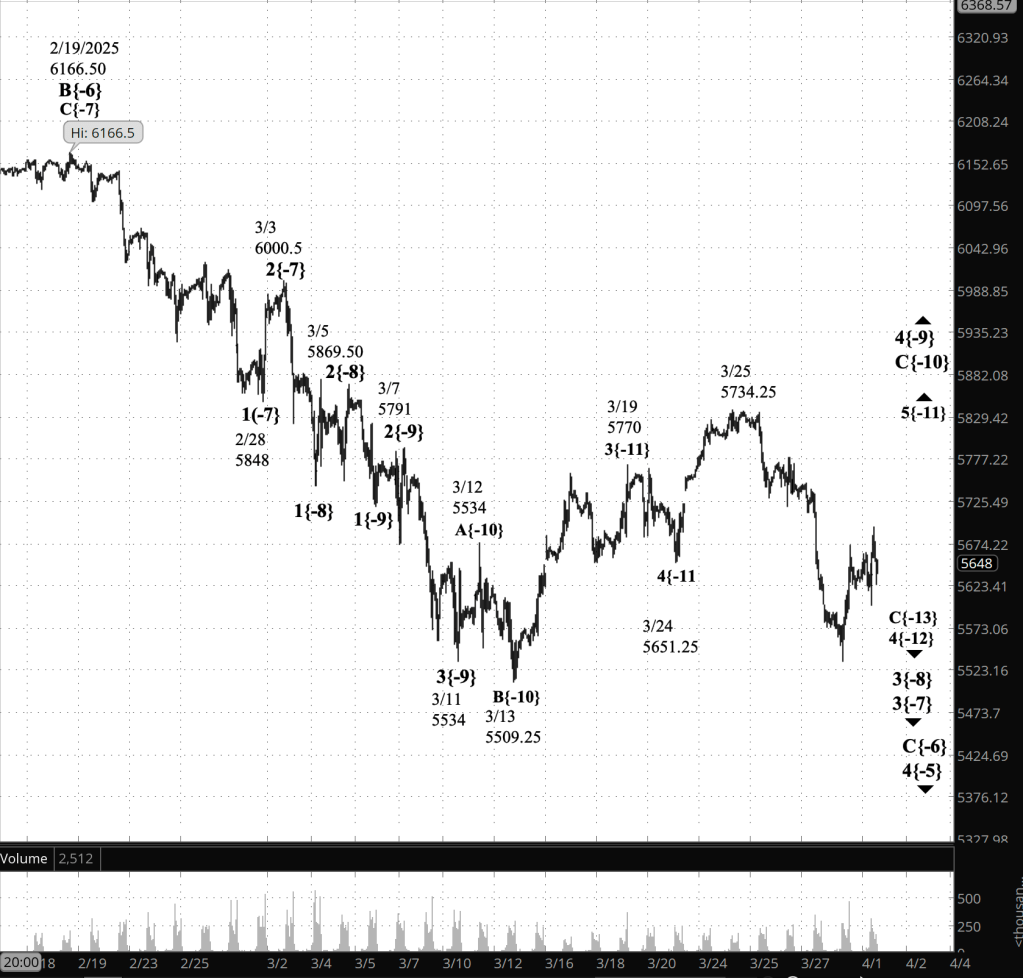
What does Elliott Wave Theory say? Here are the waves that underlie the morning’s analyses as they appeared on the chart.
Principal Analysis
- To be updated on the April 3 morning post.
Long-term Waves
These are the waves currently in progress under my principal analysis. Each line on the list shows the wave number, with the subscript in curly brackets, the traditional degree name, the starting date, the starting price of the S&P 500 E-mini futures, and the direction of the wave. [Updated to match the 7:08 p.m. analysis.)
- S&P 500 Index:
- 5{+3} Supercycle, 7/8/1932, 4.40 (up)
- 5{+2} Cycle, 12/9/1974, 60.96 (up)
- 5{+1} Primary, 3/6/2009, 666.79 (up)
- 5{0} Intermediate, 2/11/2016, 1810.10 (up)
- 3{-1} Minor, 3/23/2020, 2191.36 (up)
- 3{-2} Minute, 10/13/2022, 3491.58 (up)
- S&P 500 Futures
- 5{-3} Minuette, 4/18/2024, 4963.50 (up)
- 3{-4} Subminuette, 8/7/2024, 5182 (up)
- 4{-5} Micro, 12/16/2024, 6163.75 (down)
- C{-6} Submicro, 2/19/2025, 6166.50 (down)
Reading the chart. Price movements — waves – – in Elliott Wave Theory analysis are labeled with numbers within trending waves and letters with corrective waves. The subscripts — numbers in curly brackets — designate the wave’s degree, which, in Elliott Wave analysis, means the relative position of a wave within the larger and smaller structures that make up the chart. R.N. Elliott, who in the 1930s developed the form of analysis that bears his name, viewed the chart as a complex structure of smaller waves nested within larger waves, which in turn are nested within still larger waves. In mathematics it’s called a fractal structure, where at every scale the pattern is similar to the others.
Learning and other resources. Elliott Wave analysis provides context, not prophecy. As the 20th century semanticist Alfred Korzybski put it in his book Science and Sanity (1933), “The map is not the territory … The only usefulness of a map depends on similarity of structure between the empirical world and the map.” And I would add, in the ever-changing markets, we can judge that similarity of structure only after the fact.
See the menu page Analytical Methods for a rundown on where to go for information on Elliott Wave analysis.
By Tim Bovee, Portland, Oregon, April 2, 2025
Disclaimer
Tim Bovee, Private Trader tracks the analysis and trades of a private trader for his own accounts. Nothing in this blog constitutes a recommendation to buy or sell stocks, options or any other financial instrument. The only purpose of this blog is to provide education and entertainment.
No trader is ever 100 percent successful in his or her trades. Trading in the stock and option markets is risky and uncertain. Each trader must make trading decisions for his or her own account, and take responsibility for the consequences.
All content on Tim Bovee, Private Trader by Timothy K. Bovee is licensed under a Creative Commons Attribution-ShareAlike 4.0 International License.
Based on a work at www.timbovee.com


You must be logged in to post a comment.