3:30 p.m. New York time
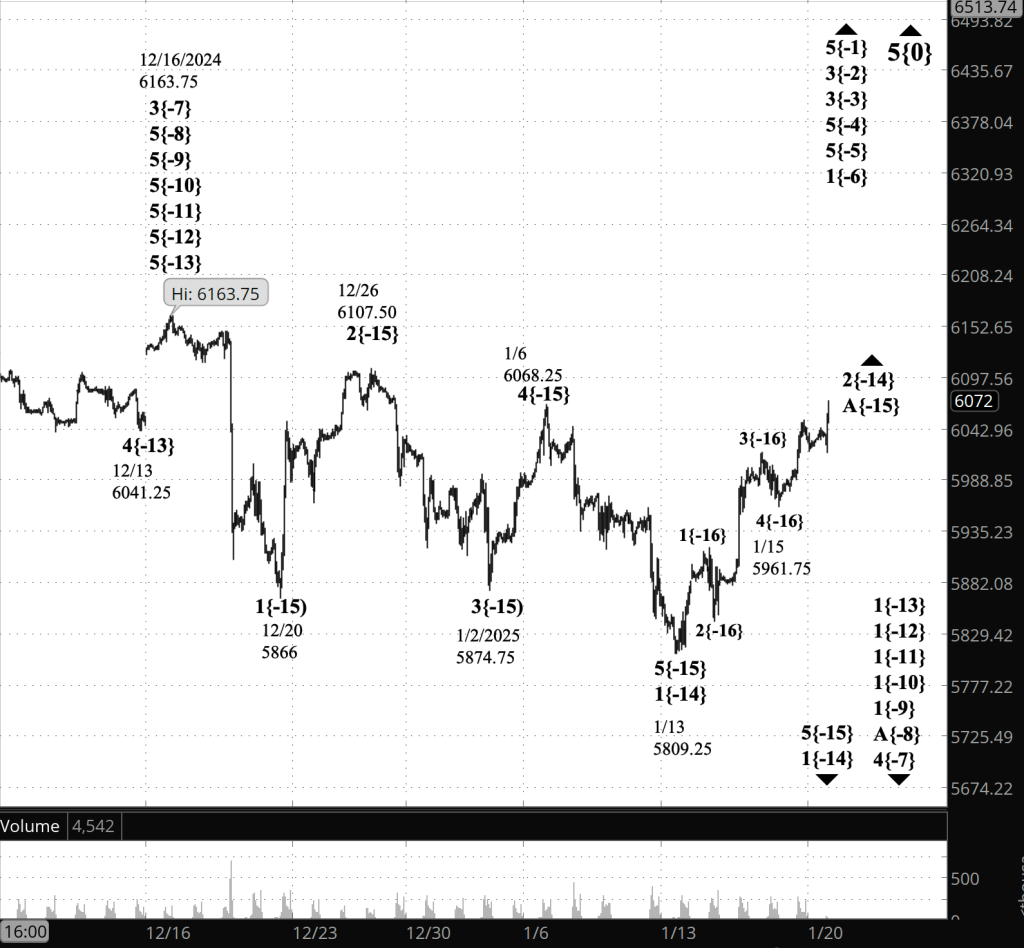
Half an hour before the closing bell. The S&P 500 futures reached a high of 6135.75 during the session, trading sideways thereafter. Elliott Wave theory: The price is 38 points below the wave 1 starting point. If it goes beyond that, it has broken a rule of Elliott Wave Theory and the analysis will be redone.
The wave 2 upward correction that began on January 13 continues.
9:35 a.m. New York time
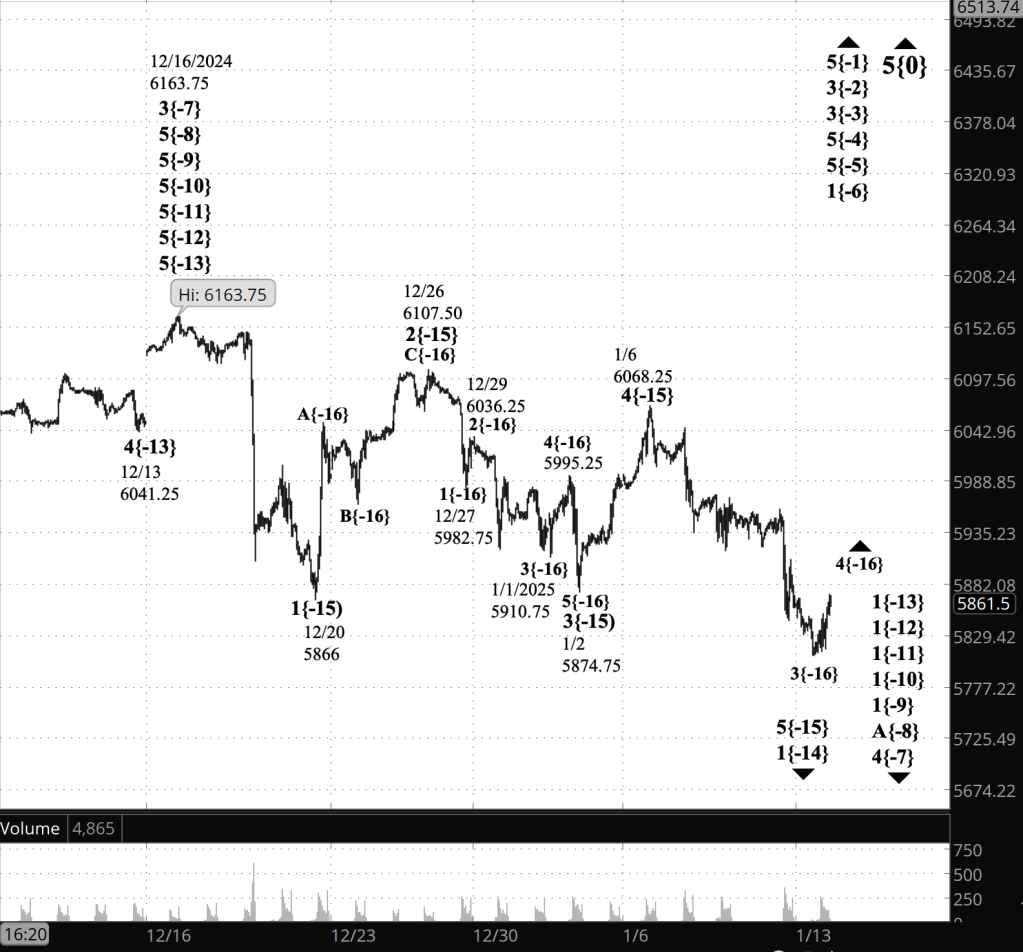
What’s happening now? The S&P 500 E-mini futures rose gently overnight, from the 6080s to the 6110s.
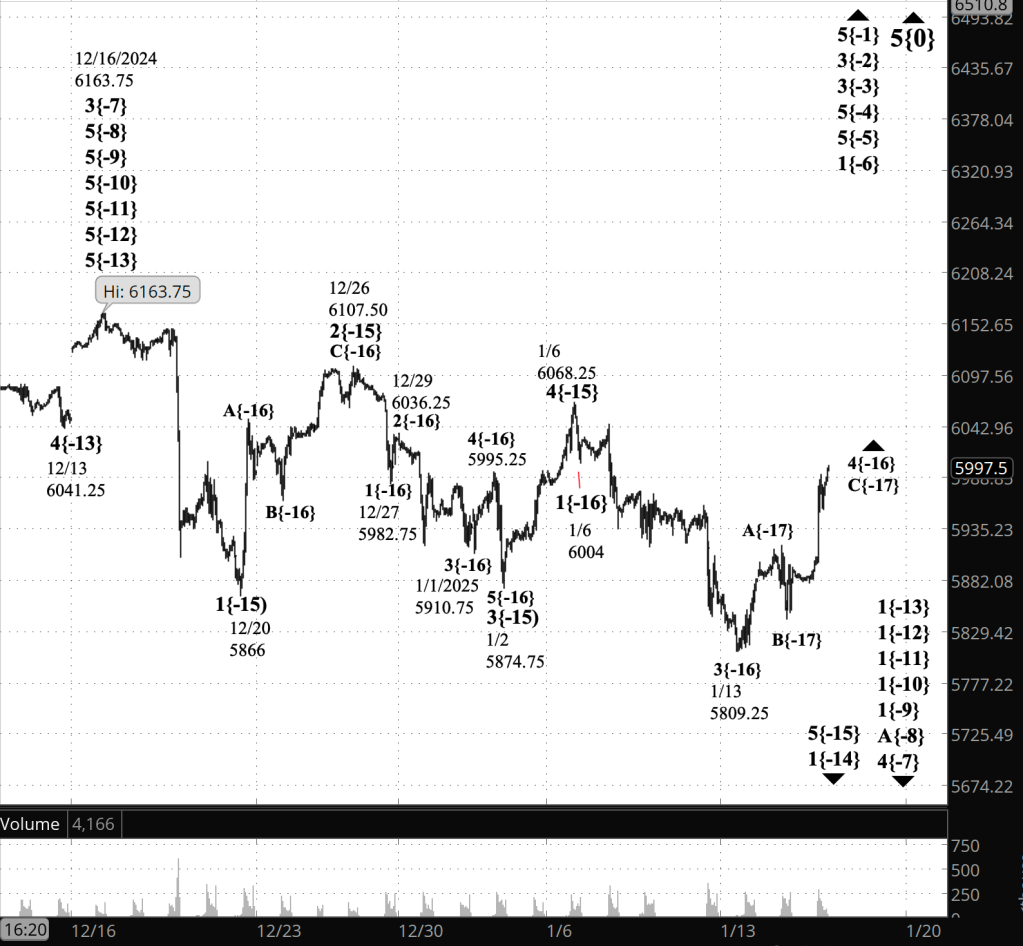
What does it mean? The rise carried the price above the 78.6% Fibonacci retracement level as the 2nd wave upward correction that began on January 13 continues to work through its initial wave. The Fibonacci ladder is shown on the chart in red.
Under the rules of Elliott Wave Theory, no 2nd wave can move past the starting point of the preceding 1st wave of the same degree. If it does, then the analysis no longer matches the reality of the chart and will be redone.
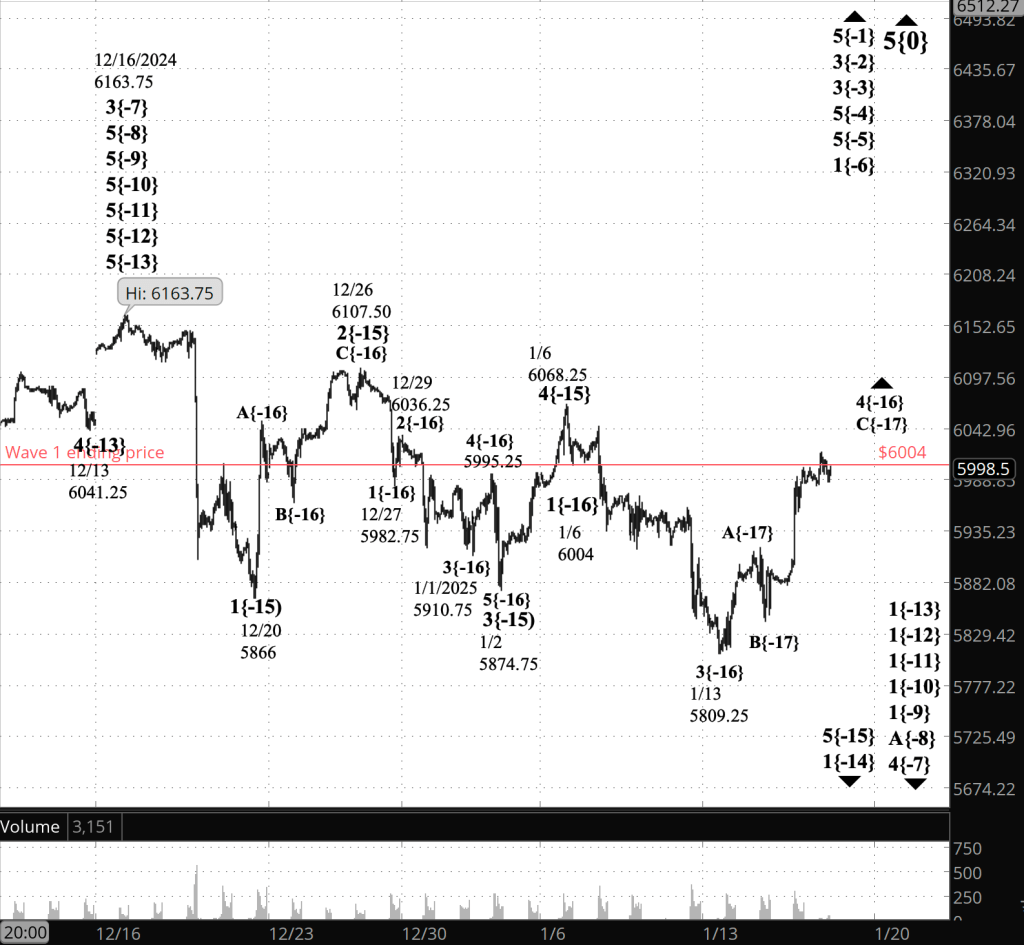
In this case, wave 1 began from 6163.75, meaning wave 2 can rise only about $44 before triggering a re-analysis.
Assuming that the analysis endures, rising wave A will be followed a declining B and wave then by a rising C wave that will complete the correction, if it follows the typical pattern. Corrections sometimes take more complex forms.
It is important to note that wave C has the same upper limit that wave A is testing now, 6163.75. C waves almost always move beyond the A waves that preceded them. So we can expect wave C to move higher, although given the narrowness of the limit, it will be higher by inches, not yards.
Wave 2 will be followed by a 3rd-wave downtrend which, if will move beyond the end of the preceding 1st wave, 5809.25, and perhaps significantly lower.

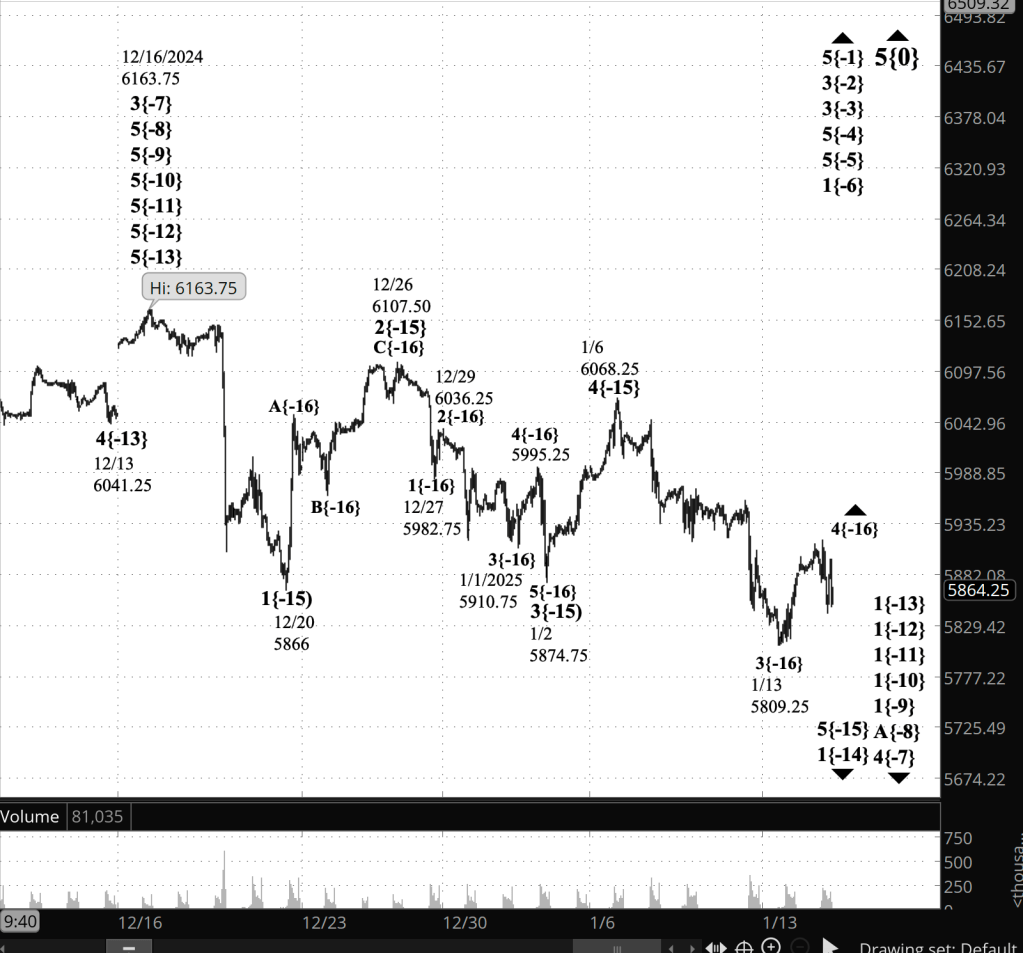
[S&P 500 E-mini futures at 3:30 p.m., hourly bars, with volume]
What are the alternatives? None at present. As always, they will develop.
What does Elliott wave theory say? Here are the waves that underly the analyses.
Principal Analysis:
- Rising wave 5{0} is underway. It is a wave of Intermediate degree that began in December 2018.
- It is in its final subwave, wave 5{-1}.
- Within wave 5{-1}, rising waves 5{-2}, 5{-3} and 5{-4} are underway, as is wave 5{-5}.
- Wave 5{-5} is in its initial subwave, wave 1{-6}, which in turn is in its middle subwave, wave 3{-7}.
- Wave 4{-7} is in its initial; subwave, which is uptrending wave A{-8}, if wave 4{-7} is a Flat structure, with three subwaves, or wave 1{-8} if it is a Zigzag structure, with five subwaves. (I’ll assume Flat as the list continues, since that’s more common within 4th waves)
- Wave A{-8} is in its intial subwave, wave 1{-9}, as are waves 1{-10}, 1{-11}, 1{-12}, and 1{-13}.
- Wave 2{-14}, an upward correction and is in its first subwave, wave A{-15}.
- Wave A{-15] is in its final subwave, wave 5{-16}.
Long-term Waves.
These are the waves currently in progress under my principal analysis. Each line on the list shows the wave number, with the subscript in curly brackets, the traditional degree name, the starting date, the starting price of the S&P 500 E-mini futures, and the direction of the wave.
- S&P 500 Index:
- 5{+3} Supercycle, 7/8/1932, 4.40 (up)
- 5{+2} Cycle, 12/9/1974, 60.96 (up)
- 5{+1} Primary, 3/6/2009, 666.79 (up)
- 5{0} Intermediate, 12/26/2018, 2346.58 (up)
- S&P 500 Futures
- 5{-1} Minor, 10/27/2023, 4127.25 (up)
- 3{-2} Minute, 10/27/23, 4127.75 (up)
- 3{-3} Minuette, 10/27/23, 4127.75 (up)
- 5{-4} Subminuette, 4/18/2024, 4963.50 (up)
- 5{-5} Micro, 8/5/2024, 5120 (up)
- 1{-6} Submicro, 8/5/2024, 5120 (up)
- 4{-7} Minuscule, 12/16/2024, 6163.75 (down)
- A{-8} (unnamed), 12/16/2024, 6163.75 (down)
- 1{-9} (unnamed), 12/16/2024, 6163.75 (down)
- 1{-10} (unnamed), 12/16/2024, 6163.75 (down)
- 1{-11} (unnamed), 12/16/2024, 6163.75 (down)
- 1{-12} (unnamed), 12/16/2024, 6163.75 (down)
- 1{-13} (unnamed), 12/16/2024, 6163.75 (down)
- 2{-14} (unnamed), 1/13/2025, 5809.25 (up)
- A{-15} (unnamed), 1/13/2025, 5809.25 (up)
Reading the chart. Price movements — waves – – in Elliott wave analysis are labeled with numbers within trending waves and letters with corrective waves. The subscripts — numbers in curly brackets — designate the wave’s degree, which, in Elliott wave analysis, means the relative position of a wave within the larger and smaller structures that make up the chart. R.N. Elliott, who in the 1930s developed the form of analysis that bears his name, viewed the chart as a complex structure of smaller waves nested within larger waves, which in turn are nested within still larger waves. In mathematics it’s called a fractal structure, where at every scale the pattern is similar to the others.
Learning and other resources. Elliott wave analysis provides context, not prophecy. As the 20th century semanticist Alfred Korzybski put it in his book Science and Sanity (1933), “The map is not the territory … The only usefulness of a map depends on similarity of structure between the empirical world and the map.” And I would add, in the ever-changing markets, we can judge that similarity of structure only after the fact.
See the menu page Analytical Methods for a rundown on where to go for information on Elliott wave analysis.
By Tim Bovee, Portland, Oregon, January 22, 2025
Disclaimer
Tim Bovee, Private Trader tracks the analysis and trades of a private trader for his own accounts. Nothing in this blog constitutes a recommendation to buy or sell stocks, options or any other financial instrument. The only purpose of this blog is to provide education and entertainment.
No trader is ever 100 percent successful in his or her trades. Trading in the stock and option markets is risky and uncertain. Each trader must make trading decisions for his or her own account, and take responsibility for the consequences.
All content on Tim Bovee, Private Trader by Timothy K. Bovee is licensed under a Creative Commons Attribution-ShareAlike 4.0 International License.
Based on a work at www.timbovee.com.


You must be logged in to post a comment.