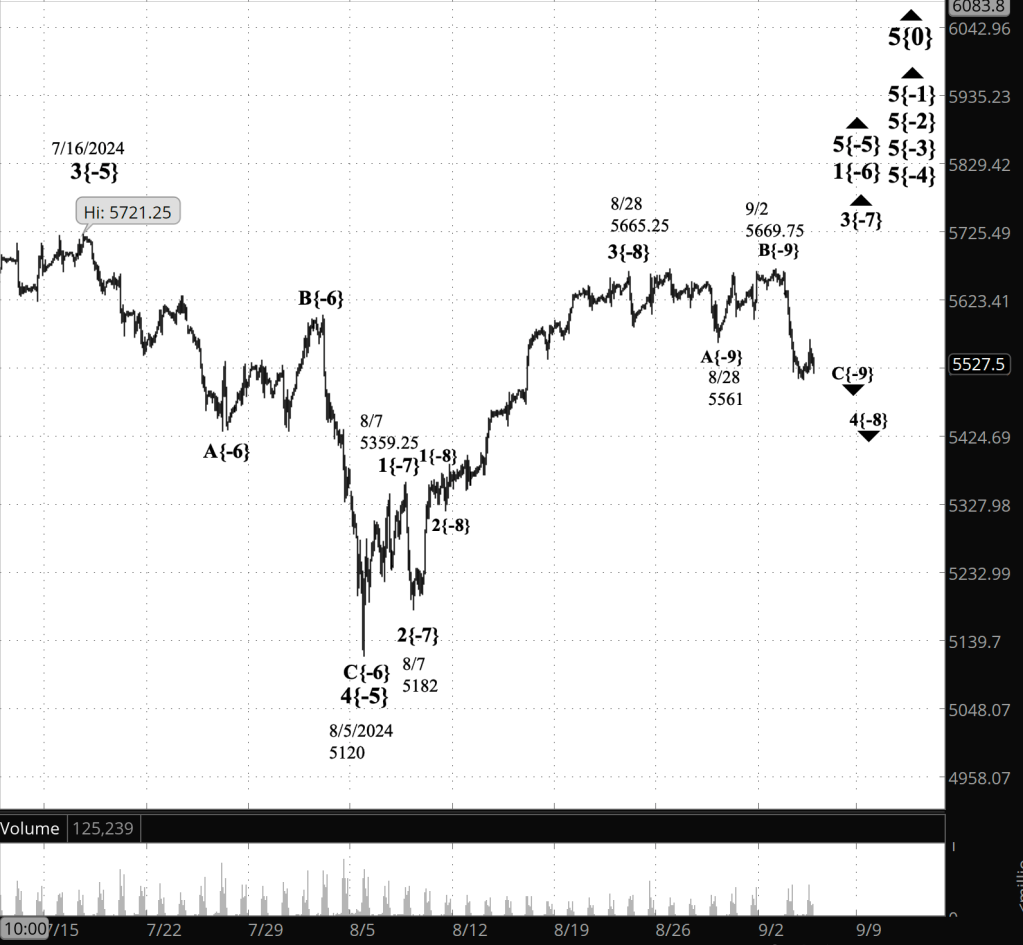
3:30 p.m. New York time
Half an hour before the closing bell. The S&P 500 futures worked their way higher during the session, reaching slightly above 5600 and then falling back slightly
Elliott Wave Theory: The final subwave, wave C, of the 4th-wave upward correction that began on August 28 continues.
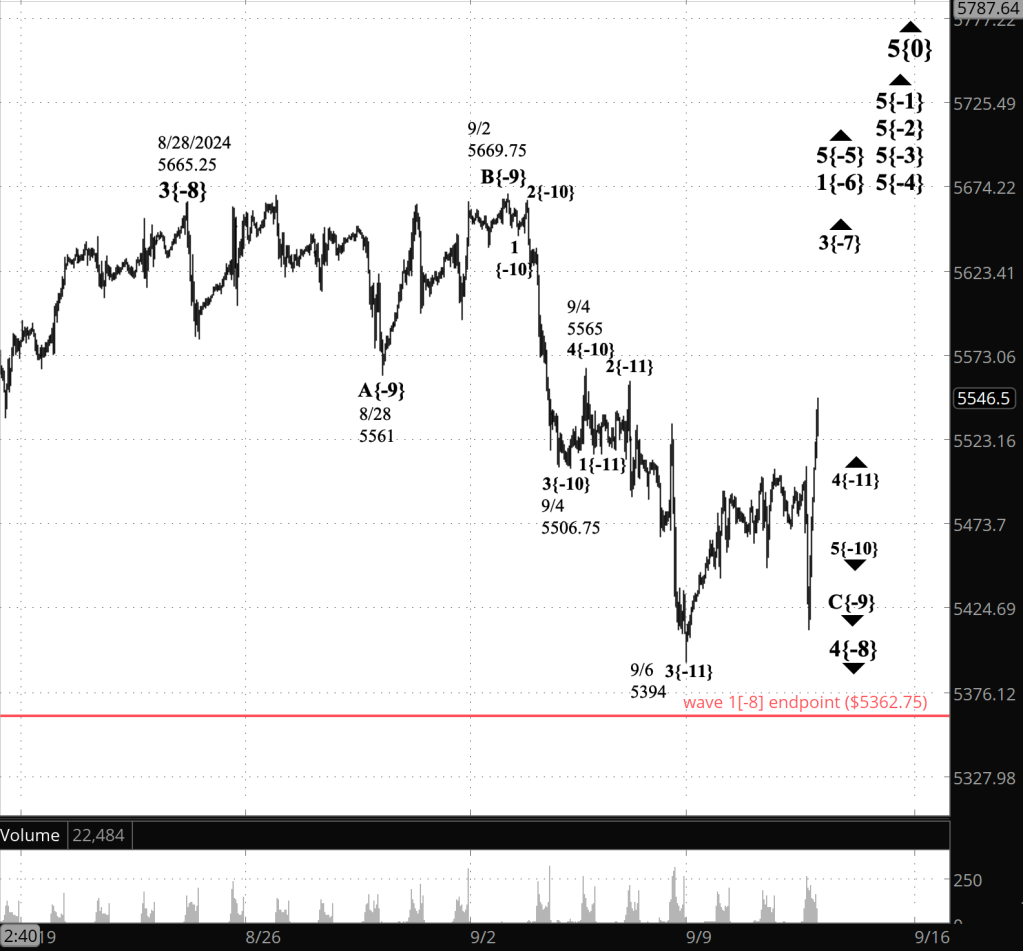
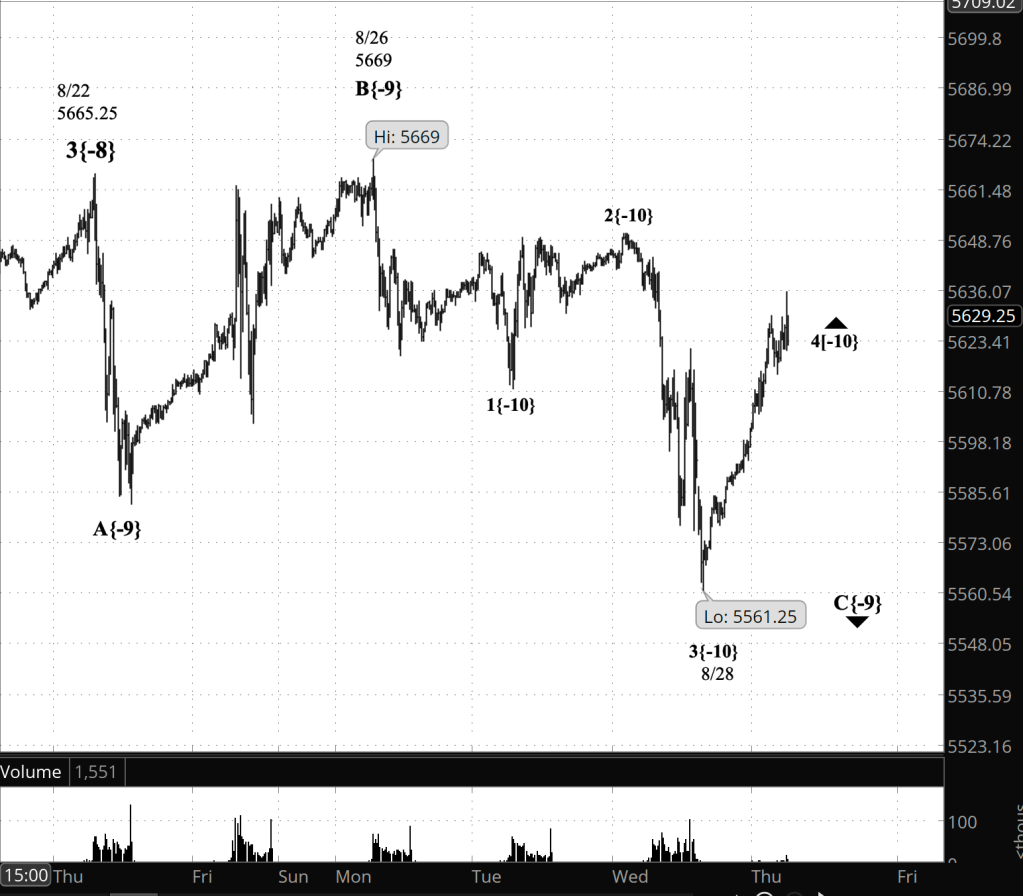
9:35 a.m. New York time
What’s happening now? The S&P 500 E-mini futures rose overnight, from the 5550s, peaking in the 5580s and then retreating upon the release of the weekly jobless claims statistics.
What does it mean? In Elliott Wave Theory terminology, the rise is part of the final subwave — wave C — within a 4th-wave upward correction that began on September 6.
That small correction is in turn a subwave of downtrending wave 5, which began on September 4, the final subwave within the final subwave of a 4th-wave downward correction that began on August 28.
What comes next? The 4th-wave downward correction that began on August 28 will be followed by a 5th-wave downtrend that will in turn be followed by a rising 5th wave, the final subwave of an uptrending 3rd wave that began on August 7.
There are a lot of final and next-to-the-last subwaves in the mix at this point, and that is always a harbinger of change.
The 4th wave that began on August 28, under the rules of Elliott Wave Theory, cannot move below the endpoint of the preceding 1st wave, which was at 5362.75. I’ve marked that level on the chart with a red horizontal line.
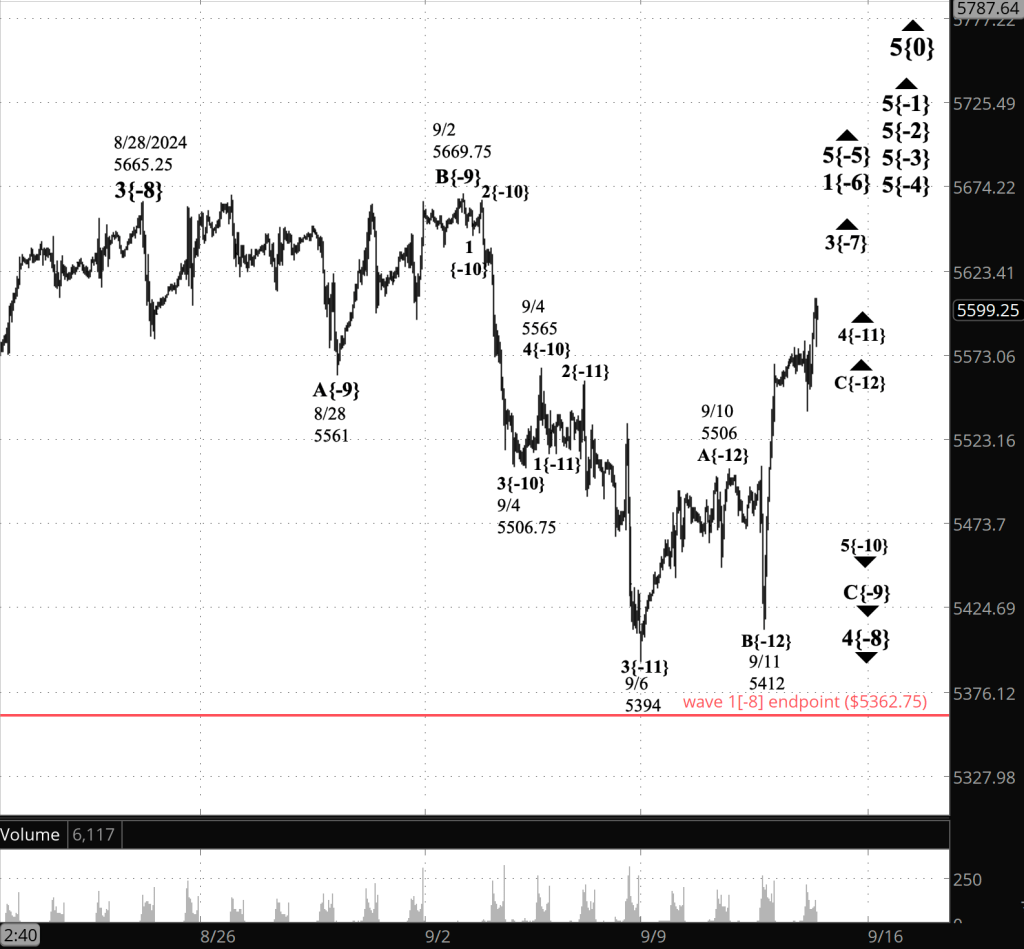
[S&P 500 E-mini futures at 3:30 p.m., 40-minute bars, with volume]
What are the alternatives? There are two.
Alternative #1:
This alternative is a future possibility, after wave C is complete. Typically, a 4th-wave correction will have three subwaves — A, B and C — and then will be complete. Occasionally a subwave will take a compound form, containing two or three corrective patterns, each composed of three subwaves and connected to the prior pattern by a wave called an X wave. This would delay the start of the following 5th wave uptrend.
Alternative #2:
This alternative has to do with how best to interpret the chart’s position within wave C. It plays off of the fact that the 2nd subwave within C under the Principal Analysis is quite small. It is possible that the decline we’ve seen since September 2 is a degree smaller within the fractal structure of the chart than the principal analysis would have. Under this scenario, wave 1 within wave C is underway. This would delay the end of the 4th-wave downward correction and the start of the ensuing 5th wave uptrend.
What does Elliott wave theory say? Here are the waves that underly the analyses.
Principal Analysis:
- Rising wave 5{0} is underway. It is a wave of Intermediate degree that began in December 2018.
- It is in its final subwave, wave 5{-1}.
- Within wave 5{-1}, rising waves 5{-2}, 5{-3} and 5{-4} are underway, as is wave 5{-5}.
- Wave 5{-5} is in its initial subwave, wave 1{-6}, which in turn is in its middle subwave, wave 3{-7}.
- Wave 3{-7} is in its next-to-the-last subwave, wave 4{-8}, a downward correction.
- Wave 4{-8} is in its final subwave, wave C{-9}, which is within wave 3{-10}.
- Wave 3{-10} is in its next-to-the-last subwave, wave 4{-11}.
Alternative Analysis #1, compound correction scenario:
- Wave 4{-8} is in its final subwave, wave C{-9}, which is in its middle subwave, wave 3{-10}.
- Wave 5{-10}, still in the future, will be the end of wave C{-9} but not of the wave 4{-8} downward correction, which under this scenario will take a compound form containing two or three corrective patterns.
- The present wave C{-9} will be followed by a rising connector wave X{-9} and then a declining wave A{-9}, the first wave of the second corrective pattern.
Alternative Analysis #2, wave 1 scenario:
- Wave 4{-8} is in its final subwave, wave C{-9}, which is in its initial subwave wave 1{-10}, which in turn is in its final subwave, wave 3{-11}. And wave 3{-11} is in its final subwave, wave 5{-12}.
Reading the chart. Price movements — waves – – in Elliott wave analysis are labeled with numbers within trending waves and letters with corrective waves. The subscripts — numbers in curly brackets — designate the wave’s degree, which, in Elliott wave analysis, means the relative position of a wave within the larger and smaller structures that make up the chart. R.N. Elliott, who in the 1930s developed the form of analysis that bears his name, viewed the chart as a complex structure of smaller waves nested within larger waves, which in turn are nested within still larger waves. In mathematics it’s called a fractal structure, where at every scale the pattern is similar to the others.
Learning and other resources. Elliott wave analysis provides context, not prophecy. As the 20th century semanticist Alfred Korzybski put it in his book Science and Sanity (1933), “The map is not the territory … The only usefulness of a map depends on similarity of structure between the empirical world and the map.” And I would add, in the ever-changing markets, we can judge that similarity of structure only after the fact.
See the menu page Analytical Methods for a rundown on where to go for information on Elliott wave analysis.
By Tim Bovee, Portland, Oregon, September 12, 2024
Disclaimer
Tim Bovee, Private Trader tracks the analysis and trades of a private trader for his own accounts. Nothing in this blog constitutes a recommendation to buy or sell stocks, options or any other financial instrument. The only purpose of this blog is to provide education and entertainment.
No trader is ever 100 percent successful in his or her trades. Trading in the stock and option markets is risky and uncertain. Each trader must make trading decisions for his or her own account, and take responsibility for the consequences.
License
All content on Tim Bovee, Private Trader by Timothy K. Bovee is licensed under a Creative Commons Attribution-ShareAlike 4.0 International License.
Based on a work at www.timbovee.com.


You must be logged in to post a comment.