3:30 p.m.. New York time
Half an hour before the closing bell. In this morning’s alternative analysis I wrote, “It’s almost always possible for a price to reverse and go a little bit higher”. And so it did.
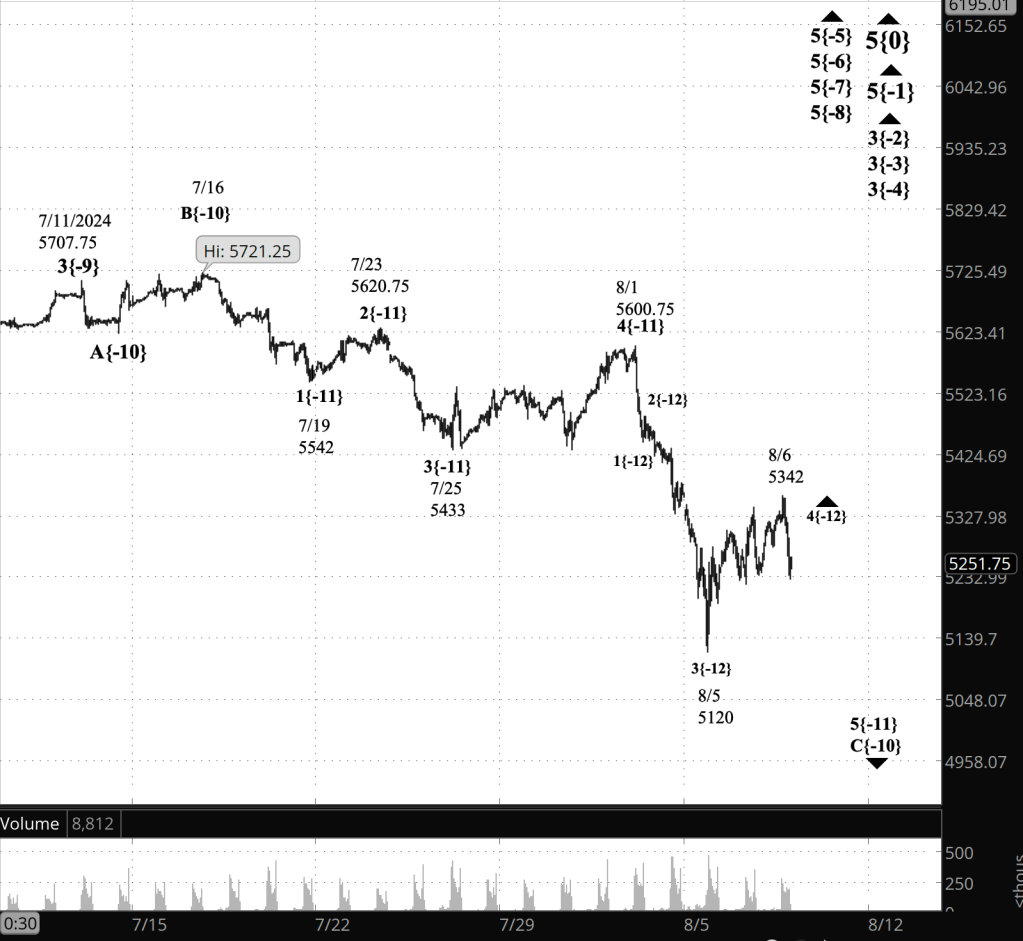
During the session the S&P 500 futures reversed and rose three points higher than the overnight peak, reaching 5586.25. It was a continuation of the final subwave, wave C, within the 4th-wave upward upward correction that began on August 5.
Did the 4th wave end at the new peak, or can it still go a bit higher? A 4th wave can’t move beyond the end of preceding 1st wave. That’s a firm rule in Elliott Wave Theory. The 1st wave ended at 5600.75, and so anywhere below that level there’s still the chance that wave 4 will go a bit higher.
Nonetheless, given how close as the price is to that rule-based upper barrier, I’ve decided to retain this morning’s analysis, marking the session peak as the end of the 4th-wave upward correction and the beginning of downtrending 5th wave.
Three possible outcomes:
- The price continues to decline, meaning wave 5 is underway
- The price goes a bit higher but remains at or below 5600.75, meaning wave 4 continued.
- The price rises beyond 5600.75, meaning the present analysis gets tossed in the trash in favor of a new analysis in which the price complies with the rule.
Time will tell.
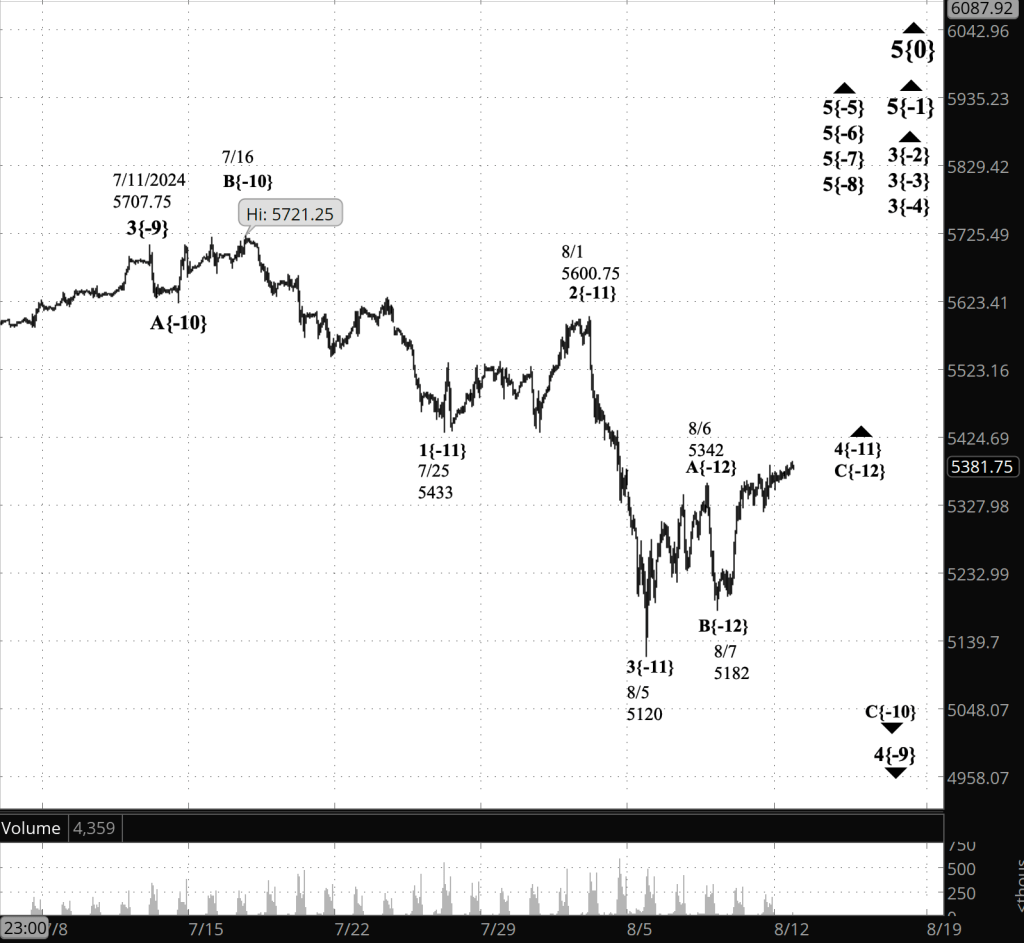
9:35 a.m. New York time
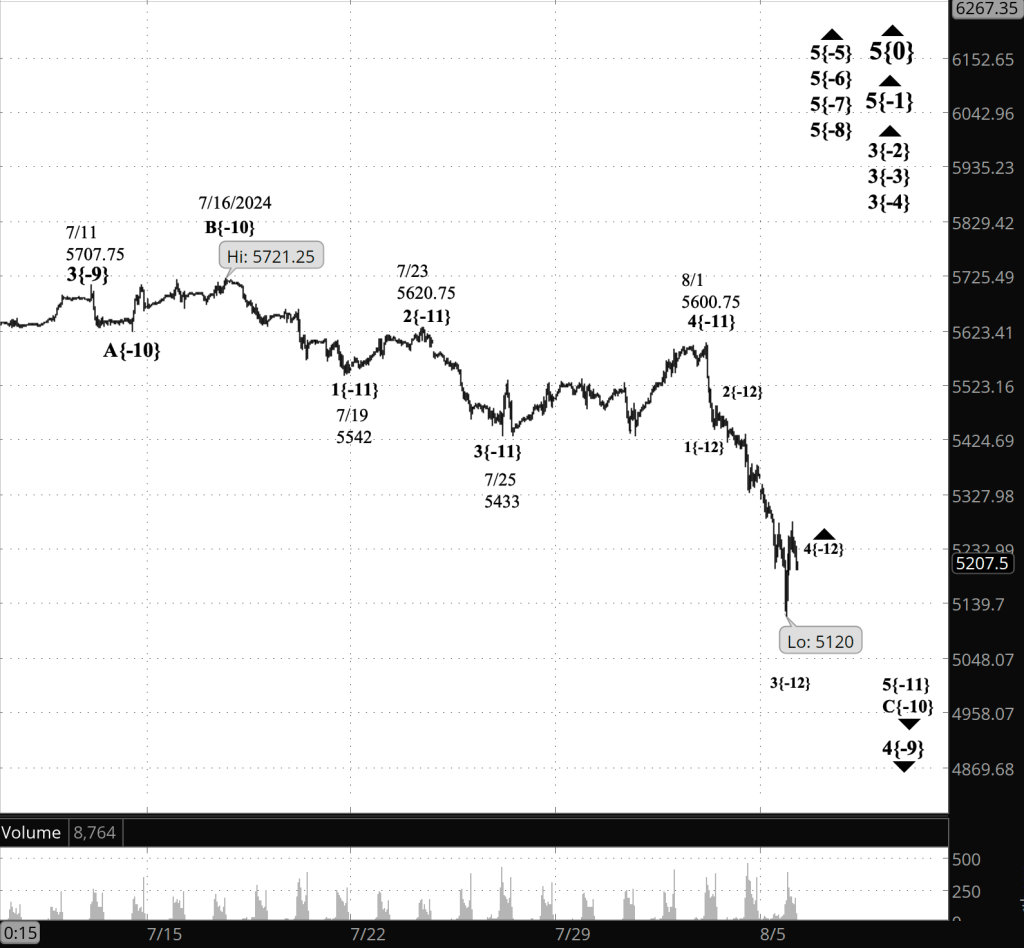
What’s happening now? The S&P 500 E-mini futures fell overnight, from 5583.25 into the 5530s.
What does it mean? Using Elliott Wave Theory for the analysis, I’ve concluded that the 4th-wave upward correction that began on August 5 ended at the overnight high, 5583.25, and a downtrending 5th wave has begun.
Fifth waves have a tendency to move beyond the end of the preceding 3rd wave, although sometimes a 5th wave will come up short, a condition called “truncation” by R.N. Elliott, who the developed the theory that bears his name.
In the case of the current 5th wave, the preceding 3rd wave ended at 5120. Elliott Wave Theory is silent on how far below that level the 5th wave might travel.
The preceding 3rd wave took five days to reach completion, and the 4th wave that followed took twice as long, which gives a hit at how long the 5th wave will continue — call it one or two weeks. However, some 5th waves are extended, covering more distance over more time that a trader would expect. So the future of this wave 5 is a matter of tendencies, not rules.
After the 5th wave. Truth be told, wave 5 is of a rather small degree within the fractal structure of the chart. However, its end will trigger much larger events as it cascades up the fractal structure.
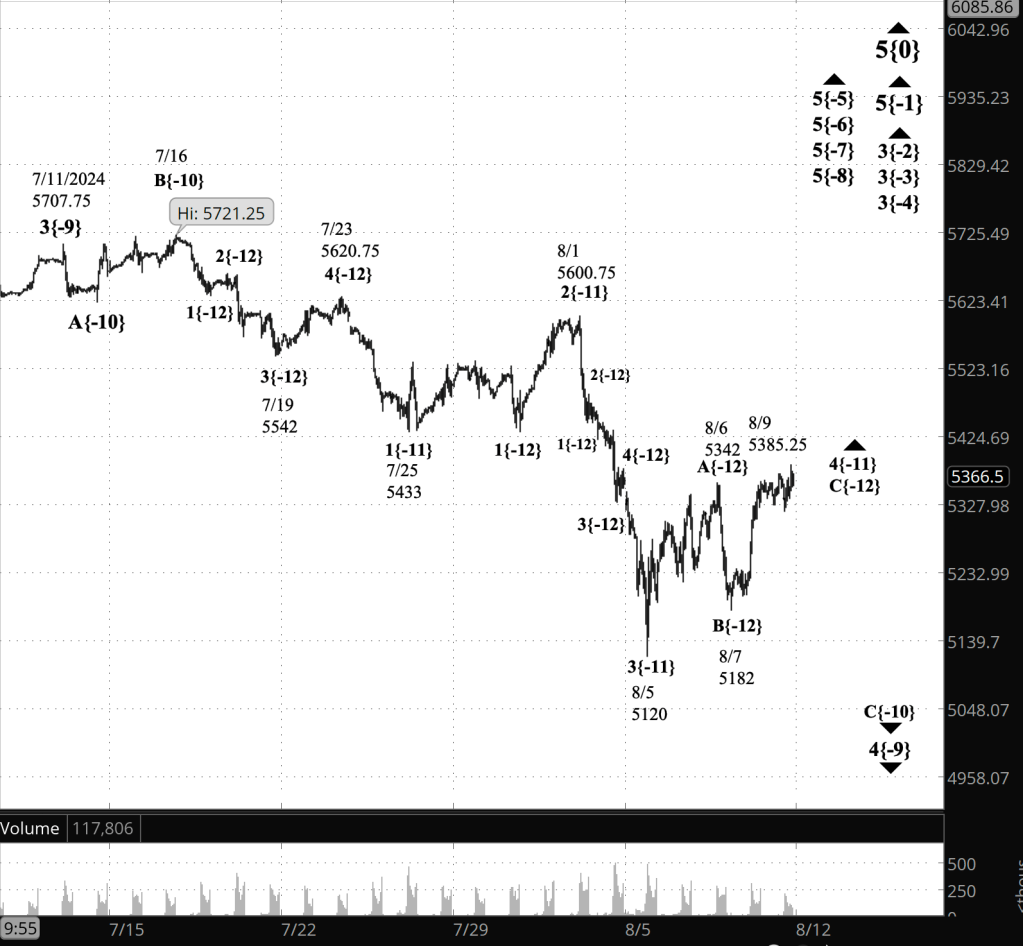
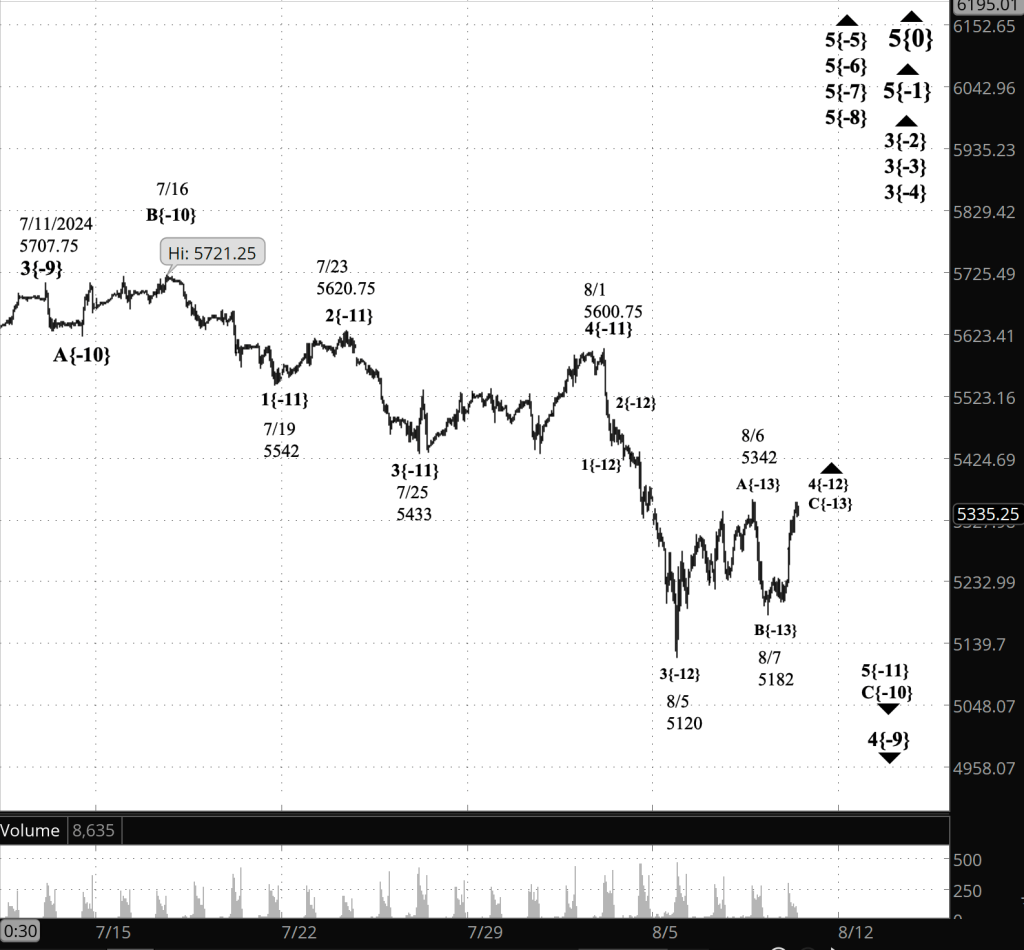
Waves on the chart are labeled with the wave number and a subscript in curly brackets denoting the wave’s distance from Intermediate degree. The present Intermediate degree movment is wave 5{0}, which began in December 2018.
The downtrending 5th-wave now underway is wave 5{-11}. It is a subwave of wave C{-10}, the final wave of a downward correction, wave 4{-9}, which began on June 11.
Wave 4{-9} will be followed by uptrend wave 5{-9}, which, if typical, will move above 5707.75, the end of the preceding 3rd wave. The end of wave 5{-9} will trigger the end of a series of 5th waves, each one degree larger than the one before: Wave 5{-8} through wave 5{-5}.
It will also be the end of the parent wave 3{-4}, which began on February 21 and which will be followed by a downward correction, wave 4{-4}, which is seven degrees larger than the 4th-wave upward correction just ended.
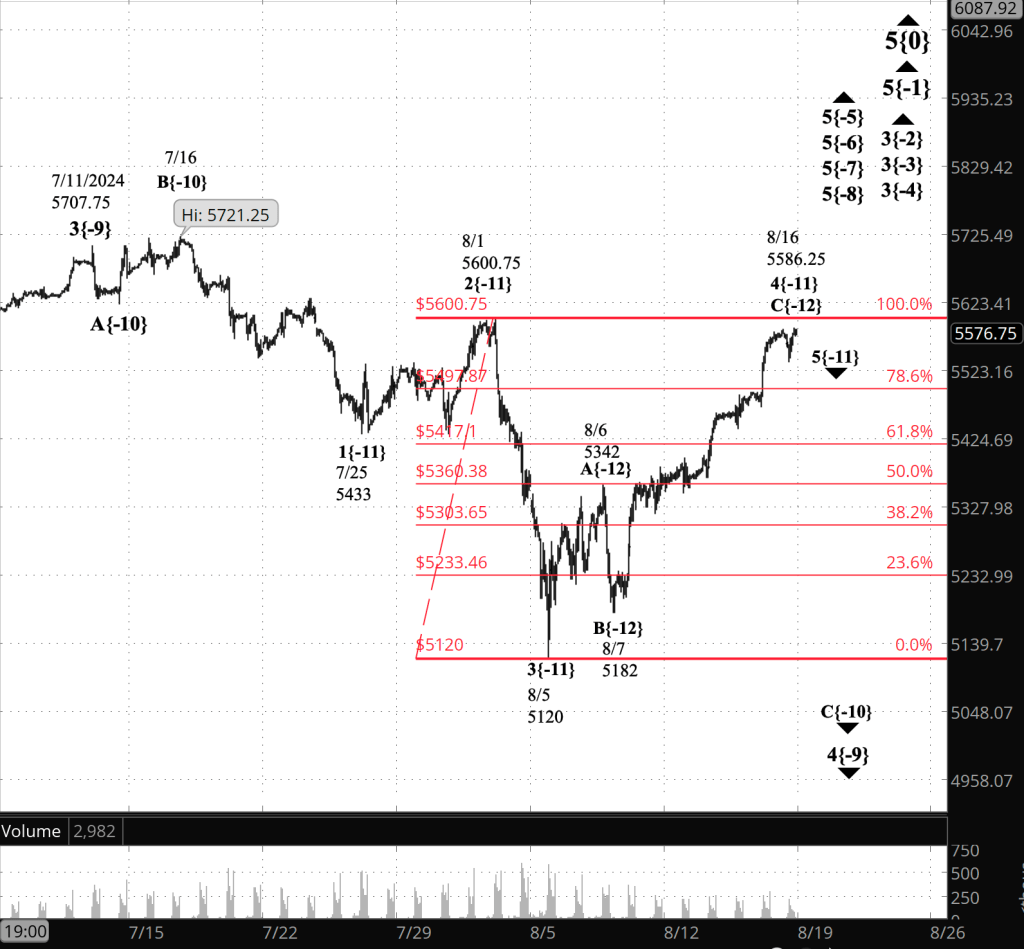
[S&P 500 E-mini futures at 3:30 p.m., 70-minute bars, with volume]
What are the alternatives? Identifying the end of a wave is often little more than an educated guess. It’s almost always possible for a price to reverse and go a little bit higher. That may be the case with the overnight high.
I’ve chosen to mark that high as the end of the 4th wave for two reasons: First, the downward movement is larger than those we’ve previously seen within wave C{-12}, the final subwave of the 4th-wave upward correction, wave 4{-11}, and second, by a firm rule of Elliott Wave Theory, wave 4{-11} cannot move beyond the start of the previous 3rd wave, 5600.25. The overnight high is less than 20 points away from that firm endpoint, and so in any case, wave 4{-11} would have very little upside left.
On the chart I’ve retained the Fibonacci ladder, in red, for the 4th-wave retracement of the preceding 3rd wave, to show how close wave 4{-11} came to a 100% retracement, the absolute boundary beyond which it could not rise.
What does Elliott wave theory say? Here are the waves that underly the analyses.
Principal Analysis:
- Rising wave 5{0} is underway. It is a wave of Intermediate degree that began in December 2018.
- It is in its final subwave, wave 5{-1}.
- Within wave 5{-1}, rising waves 3{-2}, 3{-3} and 3{-4} are underway, as is wave 5{-5}.
- Wave 5{-6} is underway and is in its final subwave, uptrending wave 5{-7}, which in turn is in its final subwave, uptrending wave 5{-8}.
- Within wave 5{-8}, wave 4{-9}, a downward correction, is in progress.
- Wave 4{-9} is in its final subwave, wave C{-10}.
- Wave C{-10} is in its final subwave, wave 5{-11}.
Reading the chart. Price movements — waves – – in Elliott wave analysis are labeled with numbers within trending waves and letters with corrective waves. The subscripts — numbers in curly brackets — designate the wave’s degree, which, in Elliott wave analysis, means the relative position of a wave within the larger and smaller structures that make up the chart. R.N. Elliott, who in the 1930s developed the form of analysis that bears his name, viewed the chart as a complex structure of smaller waves nested within larger waves, which in turn are nested within still larger waves. In mathematics it’s called a fractal structure, where at every scale the pattern is similar to the others.
Learning and other resources. Elliott wave analysis provides context, not prophecy. As the 20th century semanticist Alfred Korzybski put it in his book Science and Sanity (1933), “The map is not the territory … The only usefulness of a map depends on similarity of structure between the empirical world and the map.” And I would add, in the ever-changing markets, we can judge that similarity of structure only after the fact.
See the menu page Analytical Methods for a rundown on where to go for information on Elliott wave analysis.
By Tim Bovee, Portland, Oregon, August 16, 2024
Disclaimer
Tim Bovee, Private Trader tracks the analysis and trades of a private trader for his own accounts. Nothing in this blog constitutes a recommendation to buy or sell stocks, options or any other financial instrument. The only purpose of this blog is to provide education and entertainment.
No trader is ever 100 percent successful in his or her trades. Trading in the stock and option markets is risky and uncertain. Each trader must make trading decisions for his or her own account, and take responsibility for the consequences.
License
All content on Tim Bovee, Private Trader by Timothy K. Bovee is licensed under a Creative Commons Attribution-ShareAlike 4.0 International License.
Based on a work at www.timbovee.com.


You must be logged in to post a comment.