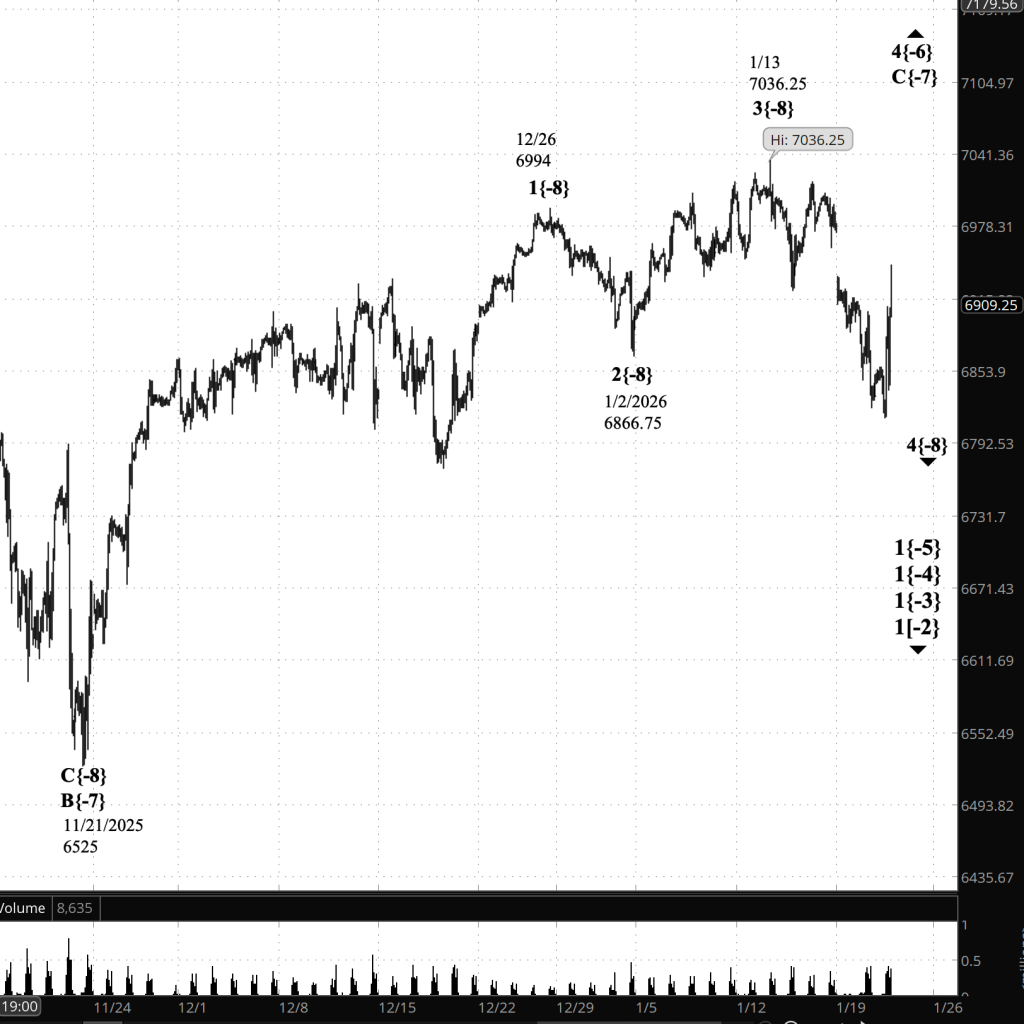
3:30 p.m. New York time
Half an hour before the closing bell. The S&P 500 E-mini futures dropped sharply during the session, falling from 7010.75 to 6898.25. Reports tied the selloff to a post-earnings repricing in Microsoft, where the market reacted less to the headline “beat” and more to concerns about the pace of cloud growth. Microsoft is a top-three S&P 500 weight (roughly 5%), so a fast downgrade in that one name can move the entire index.
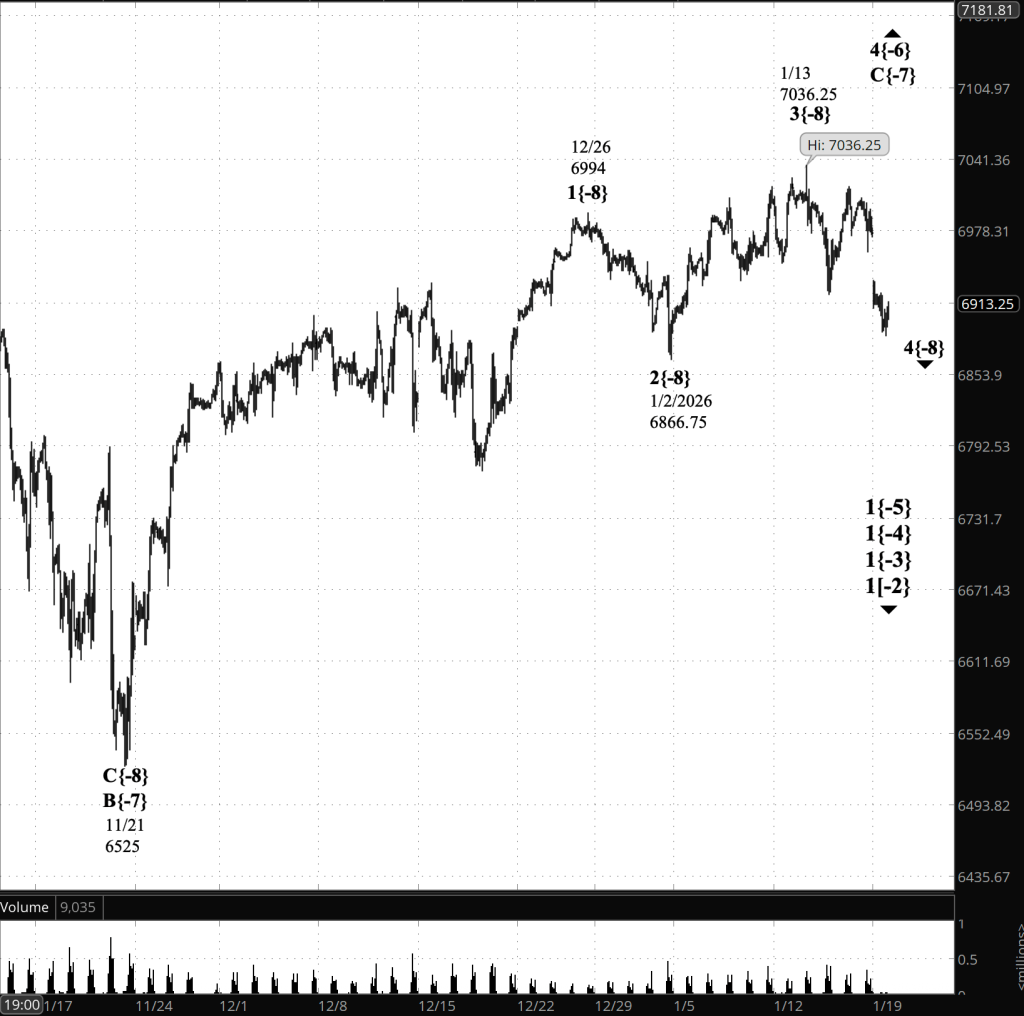
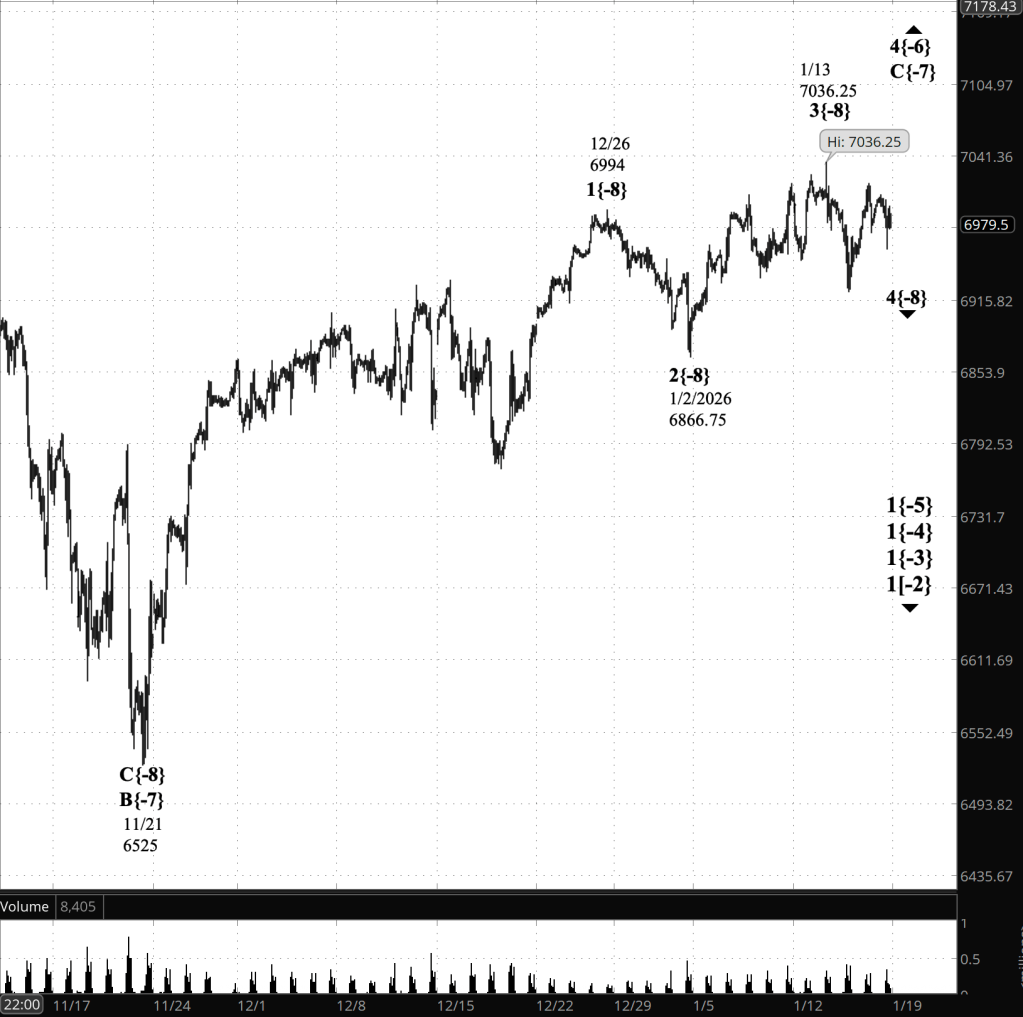
Elliott Wave Theory. Today’s drop has the right “impulse feel” to be more than routine B-wave chop. In particular, the decline broke below 6985.75 (the overnight low) and printed a new low at 6898.25. That combination argues the market may have ended rising wave B{-9} (from the 1/21 low) and begun declining wave C{-9}, both subwaves of falling corrective wave 4{-8}.
Has wave C{-9} actually begun? The working answer is: possibly—but we can demand confirmation. B-waves can throw ugly spikes, but a true C-wave tends to behave differently: it usually does not allow price to casually reclaim broken supports. The first “tell” is whether the market can recover and hold above the breakdown zone. If rebounds stall quickly and the market returns to making lower lows, that strengthens the C{-9} case.
Here are today’s important decision levels.
- Downside confirmation: The day’s low at 6898.25 is now the near-term pivot. A decisive break below 6898.25 (and failure to reclaim it quickly) would reinforce that C{-9} is underway and is gaining traction.
- First reclaim test: 6985.75 (the prior overnight low) is the first big “line back in.” If price can reclaim 6985.75 and hold it, the market is telling you this selloff may be a spike within B{-9} churn, not a sustained C{-9} leg.
- Structure reset / “back to chop”: The larger reset level is the prior support band around 7010–7015. A clean reclaim and hold back above that zone would argue the market is not yet in a directional C-wave, and that B{-9} complexity may still be playing out.
- Upside invalidation of the “B{-9} ended” idea (strong form): A push back toward 7043 (the B{-9} high) that holds would strongly weaken the “C{-9} has begun” thesis and suggest B{-9} is extending again.
Below 6985.75, the burden of proof shifts to the bulls; below 6898.25, the chart starts to act like C{-9}.
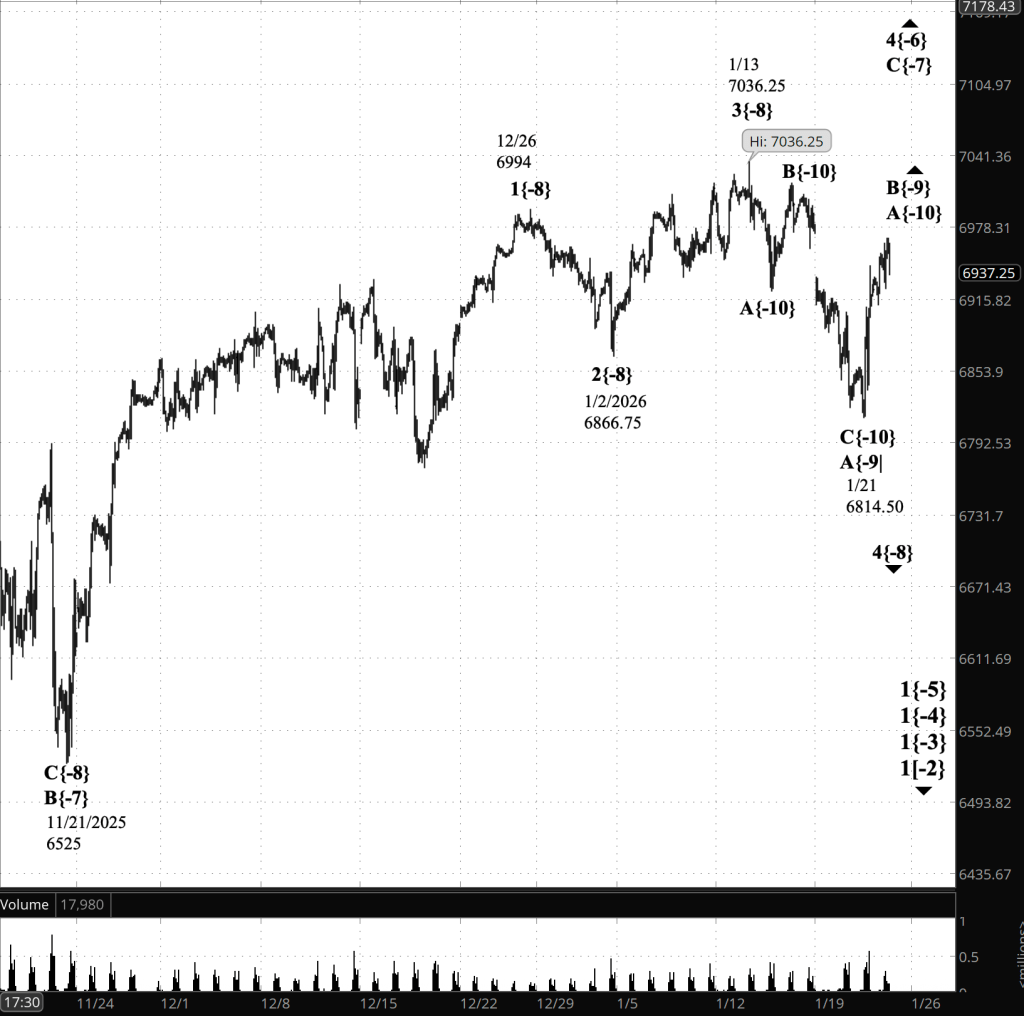
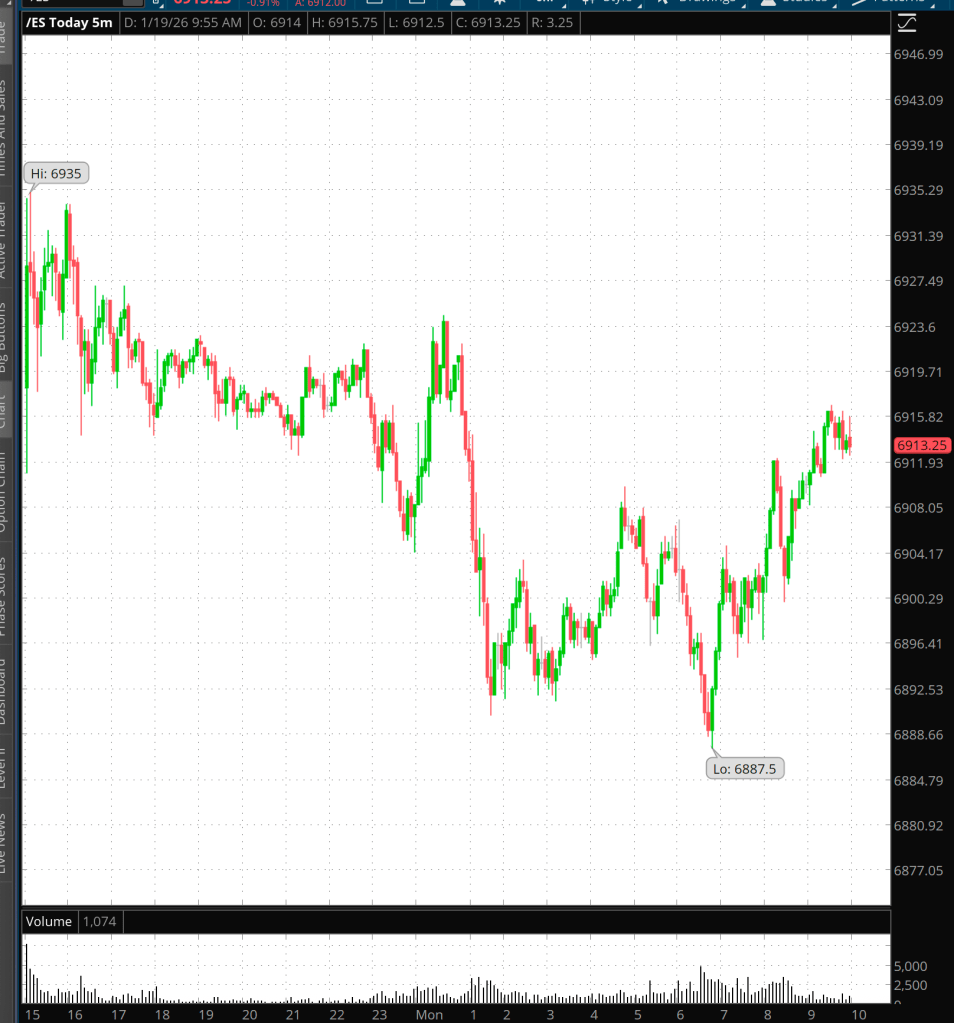
9:35 a.m. New York time.
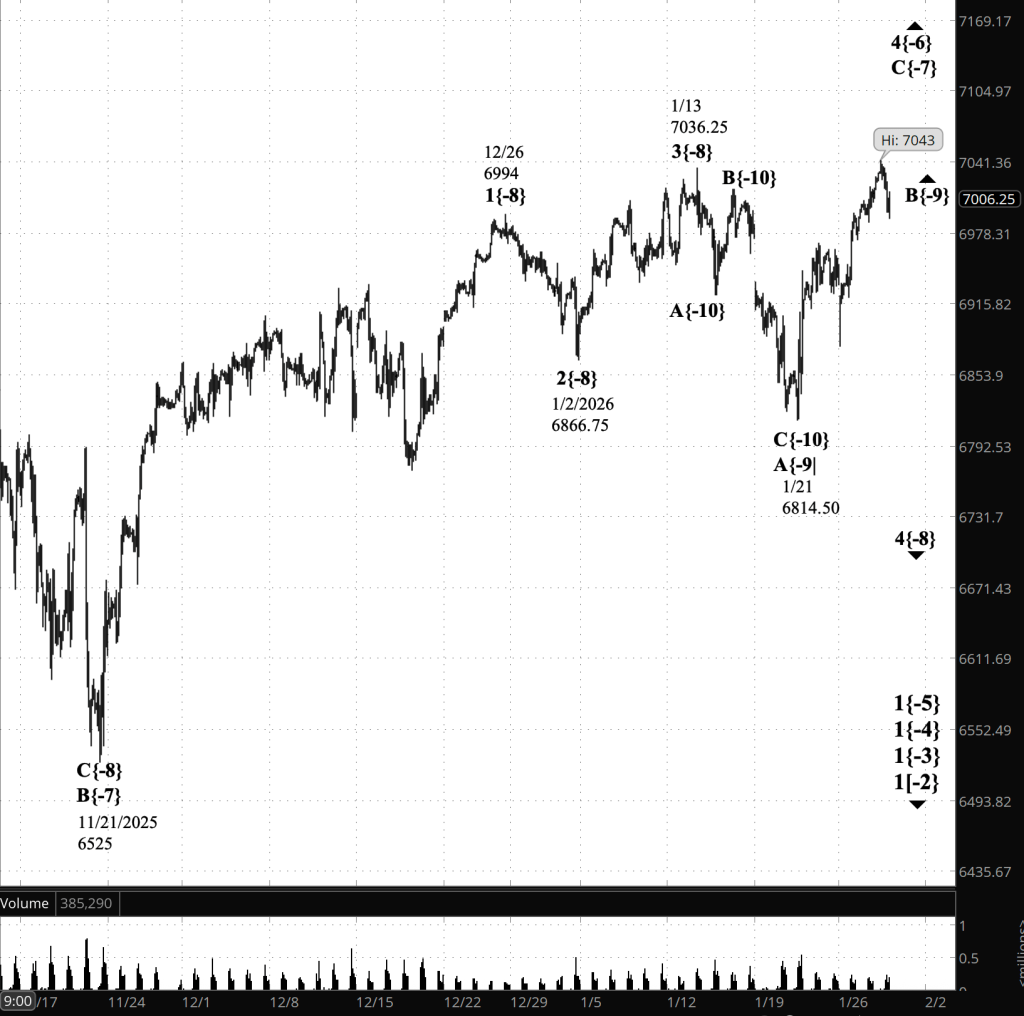
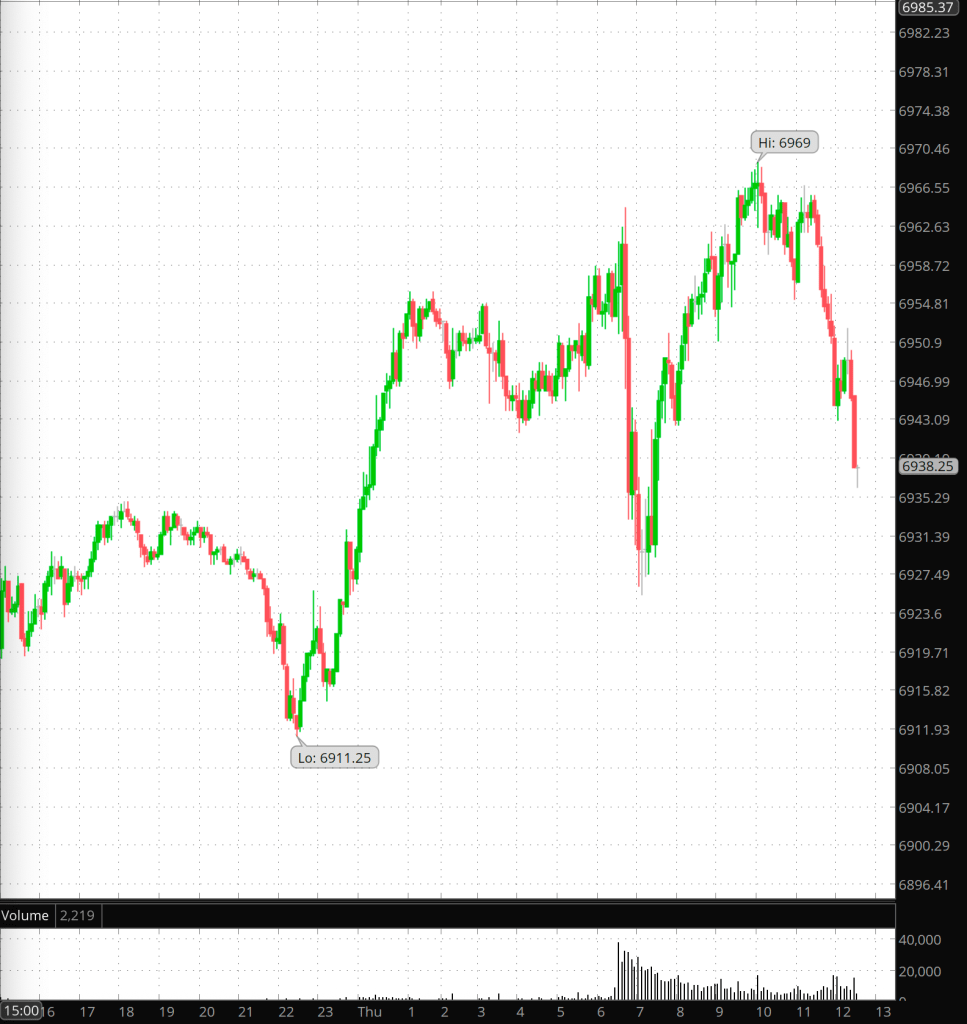
What’s happening now. The S&P 500 E-mini futures fell early overnight to 6985.75 and then rose to 7029.50, thereafter fluctuating from around 7000 into 7020s.
What does it mean? The Elliott Wave Theory analysis remains unchanged since January 21. Rising wave B{-9} is underway, the second subwave within falling corrective wave 4{-8}.
Here are today’s important decision levels. On the upside, the market must reclaim and hold above 7029.50 (the overnight high) to show buyers still have control. The real “line in the sand” is 7043: a clean push above 7043 that holds would argue wave B{-9} is extending and the market is aiming higher. On the downside, the first tell is 7015: if price falls below 7015 and cannot quickly reclaim it, the tone shifts from “chop” to “heavy.” The hard risk line is the overnight low at 6985.75— a decisive break below 6985.75 would be the first signal that the market may be transitioning from B-wave churn into something more directional down.
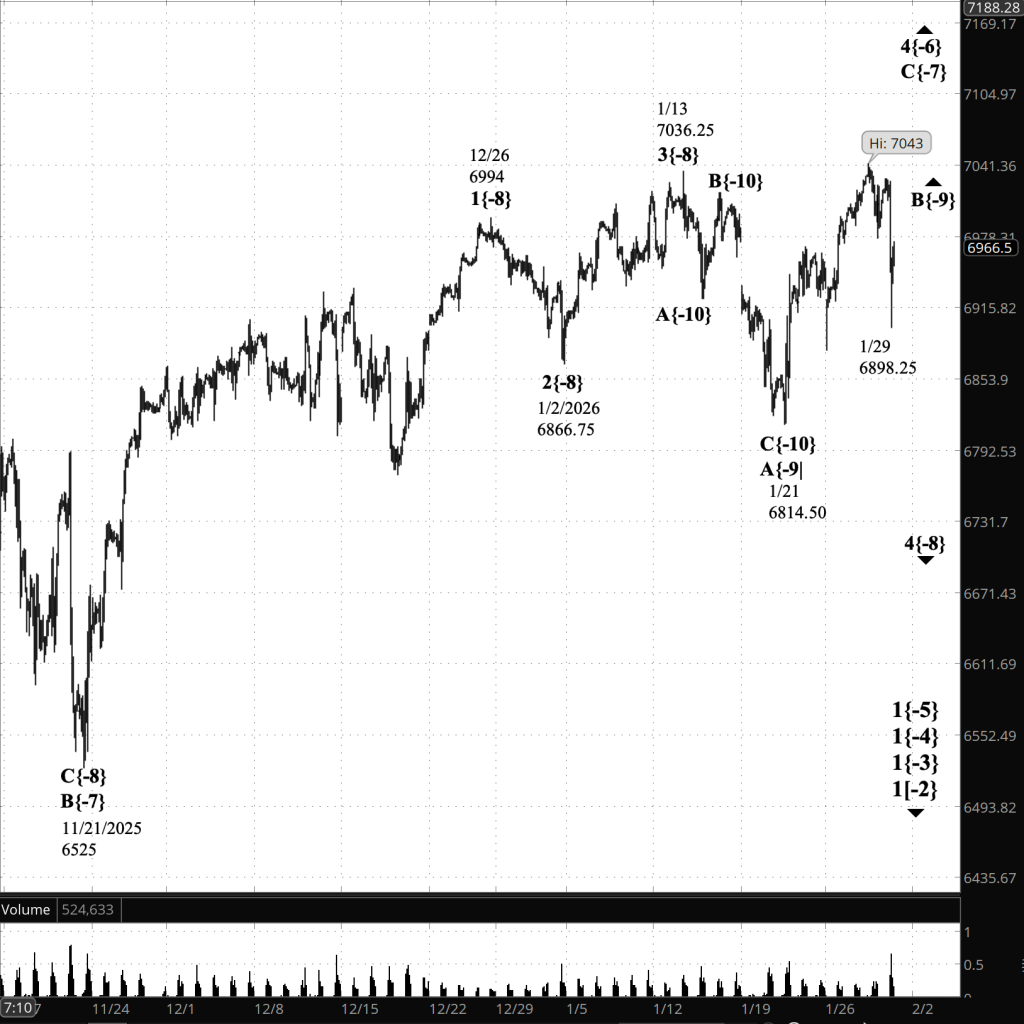
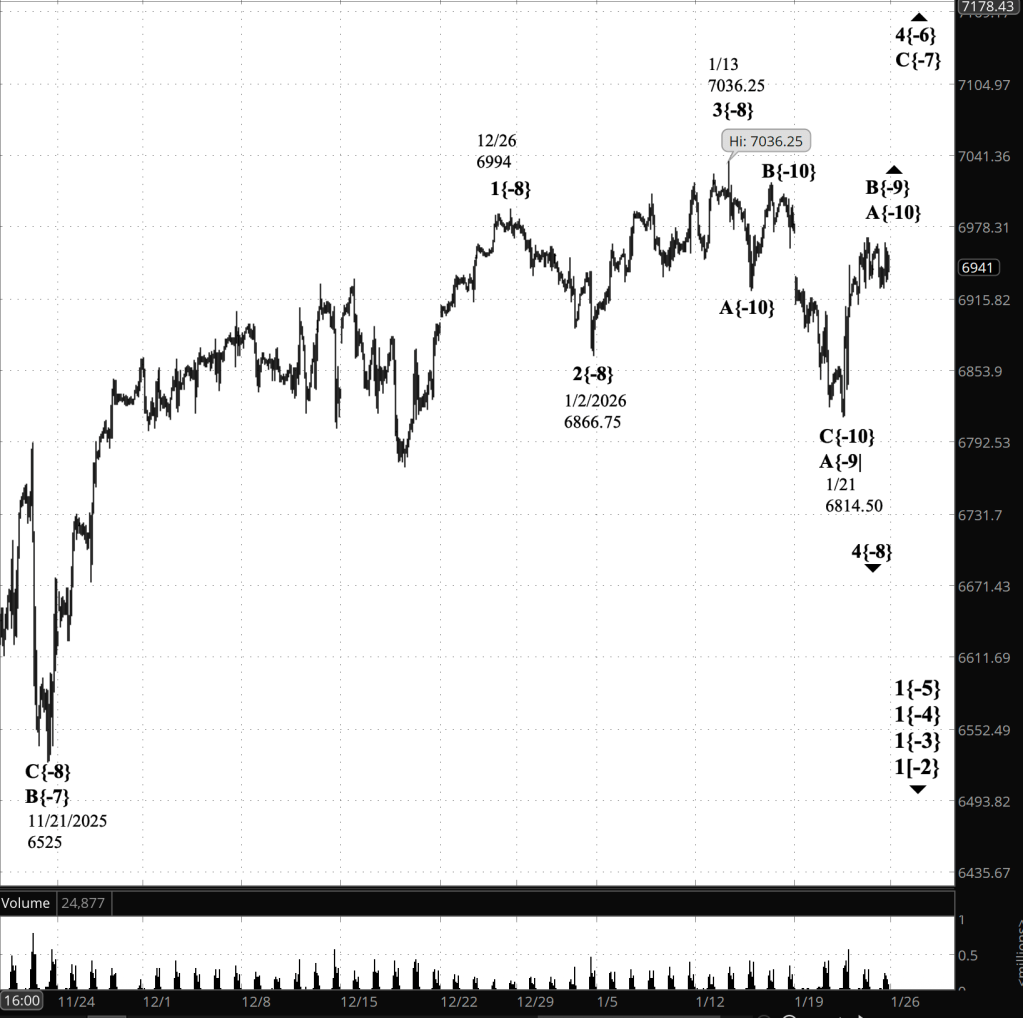
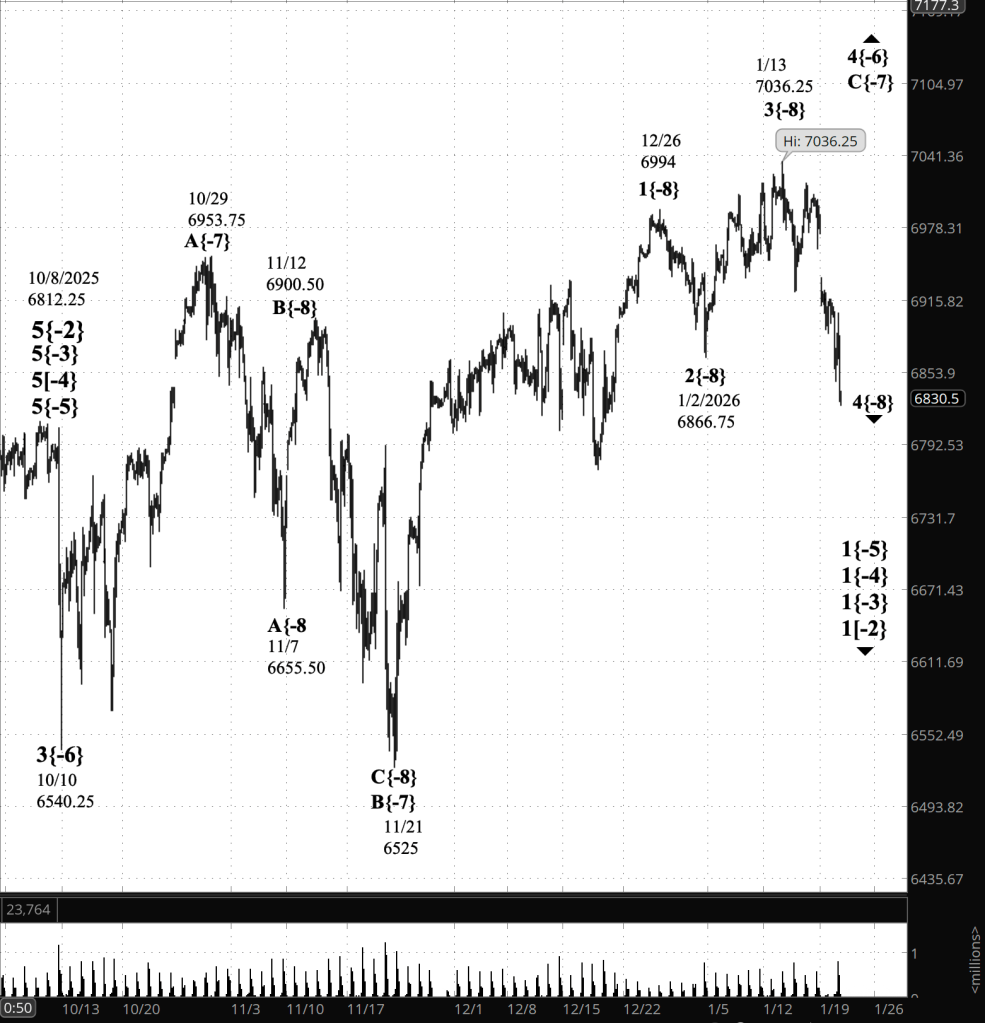
[S&P 500 E-mini futures at 3:30 p.m., 160-minute bars, with volume]
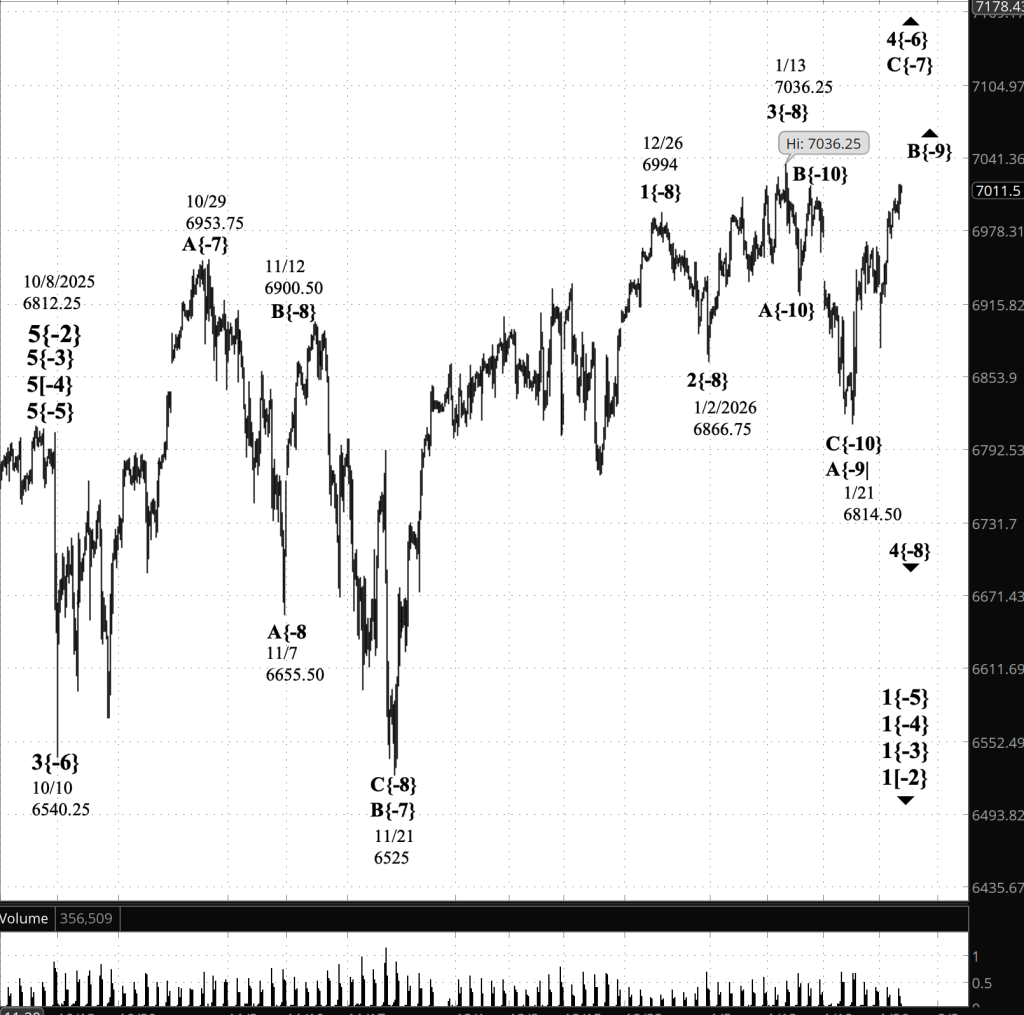
Waves Now Underway
These are the waves currently in progress under my principal analysis. Each line on the list shows the wave number, with the subscript in curly brackets, the traditional degree name, the starting date, the starting price of the S&P 500 E-mini futures, and the direction of the wave.
Most of the waves began not long ago, on October 8, 2025. See my essay posted on October 12, 2025, “The End of the Rise from 1932? Elliott Wave Theory Says ‘Yes’”, for a discussion of how that happened.
The difficult problem of estimating when a wave change should be accept as real rather than a headfake is addressed by the essay titled, “Is This Reversal Real?: How to Tell Without Being Whipsawed”.
- 1{+4} Supermillennium, (unknown start date or start price) {down}
- A hypothetical wave one degree higher than Supercyle, needed to make the wave analysis complete.
- S&P 500 Index:
- 1{+3} Supercycle, 10/8/2025, 6812.25 (down}
- 1{+2} Cycle, 10/8/2025, 6812.25 (down}
- 1{+1} Primary, 10/8/2025, 6812.25 (down}
- 1{0} Intermediate, 10/8/2025, 6812.25 (down}
- 1{-1} Minor, 10/8/2025, 6812.25 (down}
- 1{-2} Minute, 10/8/2025, 6812.25 (down}
- S&P 500 Futures
- 1{-3} Minuette 10/8/2025, 6812.25 (down}
- 1{-4} Subminutte 10/8/2025, 6812.25 (down}
- 1{-5} Micro, 10/8/2025, 6812.25 (down}
- 4{-6} Submicro, 10/10/2025, 6540.25 (up)
- C{-7} Minuscule, 11/21/2025, 6525 (up)
- 4{-8} (none), 1/13/2026, 7036.25 (down)
- B{-9} (none), 1/21/2026, 6814-50 (up)
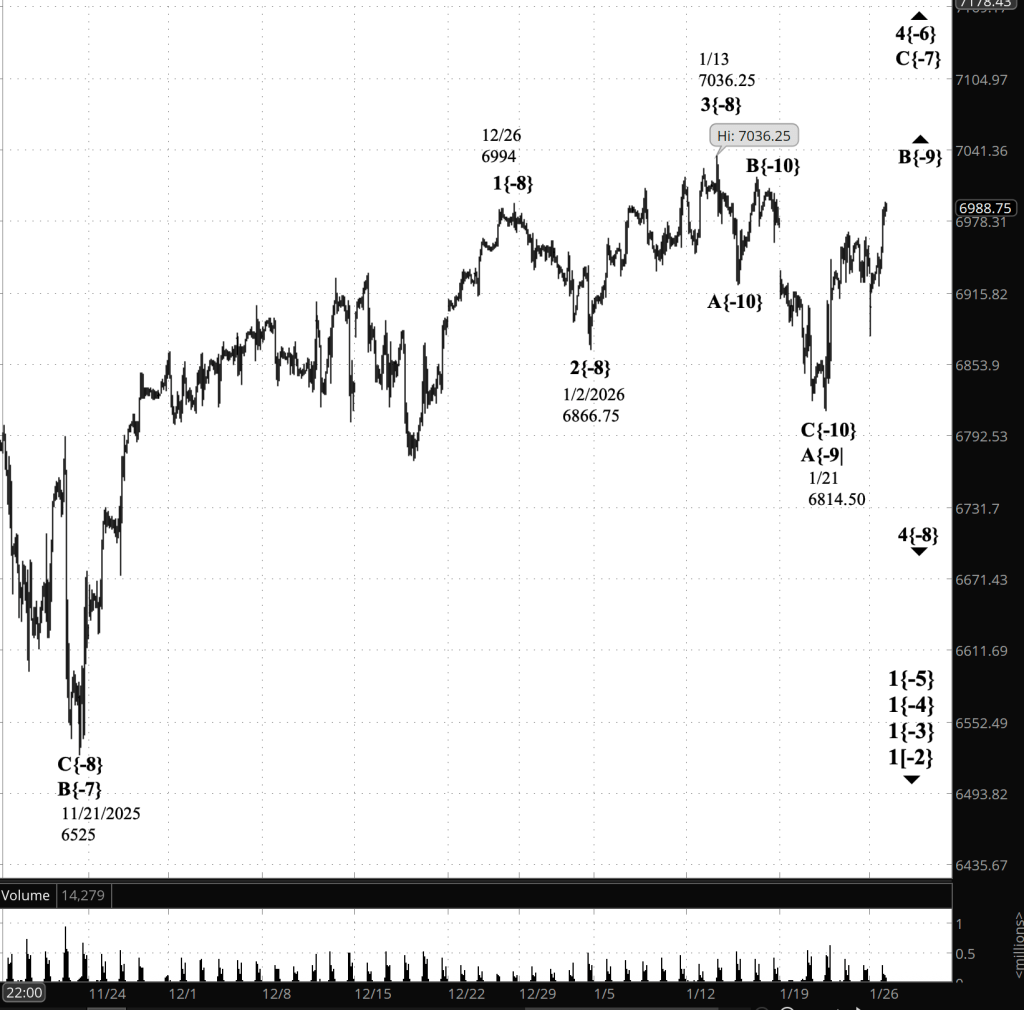
Reading the chart. Price movements — waves – – in Elliott Wave Theory analysis are labeled with numbers within trending waves and letters with corrective waves. The subscripts — numbers in curly brackets — designate the wave’s degree, which, in Elliott Wave analysis, means the relative position of a wave within the larger and smaller structures that make up the chart. R.N. Elliott, who in the 1930s developed the form of analysis that bears his name, viewed the chart as a complex structure of smaller waves nested within larger waves, which in turn are nested within still larger waves. In mathematics it’s called a fractal structure, where at every scale the pattern is similar to the others.
Learning and other resources. Elliott Wave analysis provides context, not prophecy. As the 20th century semanticist Alfred Korzybski put it in his book Science and Sanity (1933), “The map is not the territory … The only usefulness of a map depends on similarity of structure between the empirical world and the map.” And I would add, in the ever-changing markets, we can judge that similarity of structure only after the fact.
See the menu page Analytical Methods for a rundown on where to go for information on Elliott Wave analysis.
By Tim Bovee, Portland, Oregon, January 29, 2026
Disclaimer
Tim Bovee, Private Trader tracks the analysis and trades of a private trader for his own accounts. Nothing in this blog constitutes a recommendation to buy or sell stocks, options or any other financial instrument. The only purpose of this blog is to provide education and entertainment.
No trader is ever 100 percent successful in his or her trades. Trading in the stock and option markets is risky and uncertain. Each trader must make trading decisions for his or her own account, and take responsibility for the consequences.
All content on Tim Bovee, Private Trader by Timothy K. Bovee is licensed under a Creative Commons Attribution-ShareAlike 4.0 International License.
Based on work at www.timbovee.com

You must be logged in to post a comment.