3:30 p.m. New York time
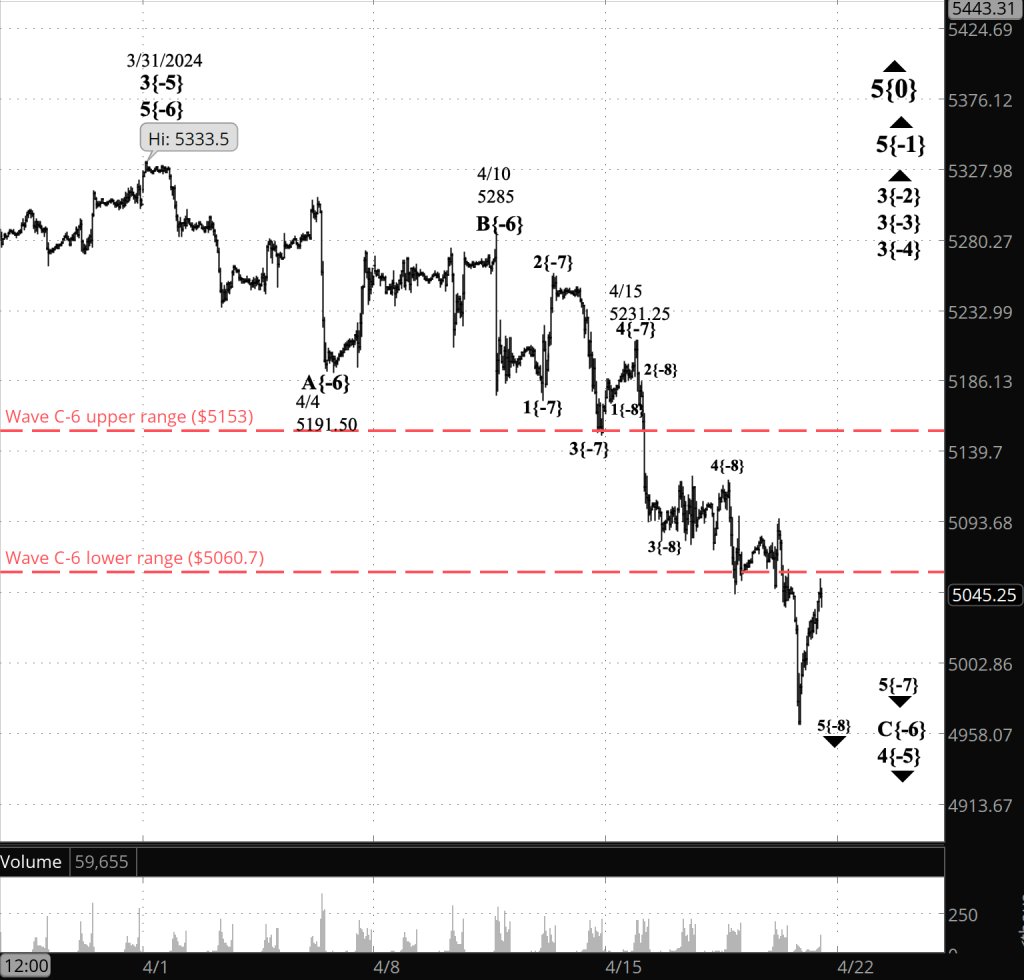
Half an hour before the closing bell. The S&P 500 futures declined during the session, reaching back into the 5080s. The decline is a subwave of the rising 1st wave within a 5th-wave uptrend that began on April 18. The declining subwave is wave 4{-8} on the chart and will soon be followed by a rising 5th wave.
9:35 a.m. New York time
What’s happening now? The S&P 500 E-mini futures the S&P 500 E-mini futures continued to rise overnight, reaching into the 5120s.
What does it mean? The rise carried the price of what had been labeled a low-degree 4th wave above the end of the preceding 1st wave. That breaks a rule of Elliott Wave Theory, and I’ve altered the analysis to match the reality of the chart.
Under the new principal analysis, the downward 4th-wave correction that began on March 31 ended on April 18, and a 5th-wave uptrend began. The 5th wave is in its 1st subwave, and that subwave is in its third of five waves.
Here are the waves under discussion as they appear on the chart, with the wave number followed by a subscript in curly brackets denoting how many degrees distant the wave is from Intermediate degree within the fractal structure of the chart. See the “Reading the chart” section below for more on the fractal structure.
From smaller to larger, under the new analysis the waves in progress are wave 3{-7} within wave 1{-6} within wave 5{-5}, all rising waves.
Fifth waves often carry the price beyond the end of the preceding 3rd wave — wave 3{-5} at 5333.50 in this case — and sometimes considerably beyond. And sometimes a 5th wave is truncated, ending below the end of the 3rd wave.
When wave 5{-5} is complete, it will also signal the end of its parent, wave 3{-4}, and the beginning of a 4th-wave downward correction one degree larger than the March 31 correction just ended.
What are the alternatives? The ambiguity, as is always the case early in a wave’s progress, is the degree of the subwaves. I’ve labeled the three subwaves of the uptrends initial wave as being seven degrees smaller — 3{-7} — than the Intermediate degree. But they could be a degree lower — 3{-8} — or a degree higher — 3{-6}. The course of the uptrend over time will resolve that ambiguity.

[S&P 500 E-mini futures at 3:30 p.m., 45-minute bars, with volume]
What does Elliott wave theory say? Here are the waves that underly the analyses.
Principal Analysis:
- Rising wave 5{0} is underway. It is a wave of Intermediate Degree that began in December 2018.
- It is in its final subwave, wave 5{-1}
- Within wave 5{-1}, rising waves 3{-2}, 3{-3} and 3{-4} are underway, as is wave 5{-5}.
- Uptrendng wave 5{-5} is in its initial subwave, rising wave 1{-6}, which is in its middle subwave, rising wave 3{-7}.
Reading the chart. Price movements — waves – – in Elliott wave analysis are labeled with numbers within trending waves and letters with corrective waves. The subscripts — numbers in curly brackets — designate the wave’s degree, which, in Elliott wave analysis, means the relative position of a wave within the larger and smaller structures that make up the chart. R.N. Elliott, who in the 1930s developed the form of analysis that bears his name, viewed the chart as a complex structure of smaller waves nested within larger waves, which in turn are nested within still larger waves. In mathematics it’s called a fractal structure, where at every scale the pattern is similar to the others.
Learning and other resources. Elliott wave analysis provides context, not prophecy. As the 20th century semanticist Alfred Korzybski put it in his book Science and Sanity (1933), “The map is not the territory … The only usefulness of a map depends on similarity of structure between the empirical world and the map.” And I would add, in the ever-changing markets, we can judge that similarity of structure only after the fact.
See the menu page Analytical Methods for a rundown on where to go for information on Elliott wave analysis.
By Tim Bovee, Portland, Oregon, April 24, 2024
Disclaimer
Tim Bovee, Private Trader tracks the analysis and trades of a private trader for his own accounts. Nothing in this blog constitutes a recommendation to buy or sell stocks, options or any other financial instrument. The only purpose of this blog is to provide education and entertainment.
No trader is ever 100 percent successful in his or her trades. Trading in the stock and option markets is risky and uncertain. Each trader must make trading decisions for his or her own account, and take responsibility for the consequences.
License
All content on Tim Bovee, Private Trader by Timothy K. Bovee is licensed under a Creative Commons Attribution-ShareAlike 4.0 International License.
Based on a work at www.timbovee.com.


You must be logged in to post a comment.