3:30 p.m. New York time
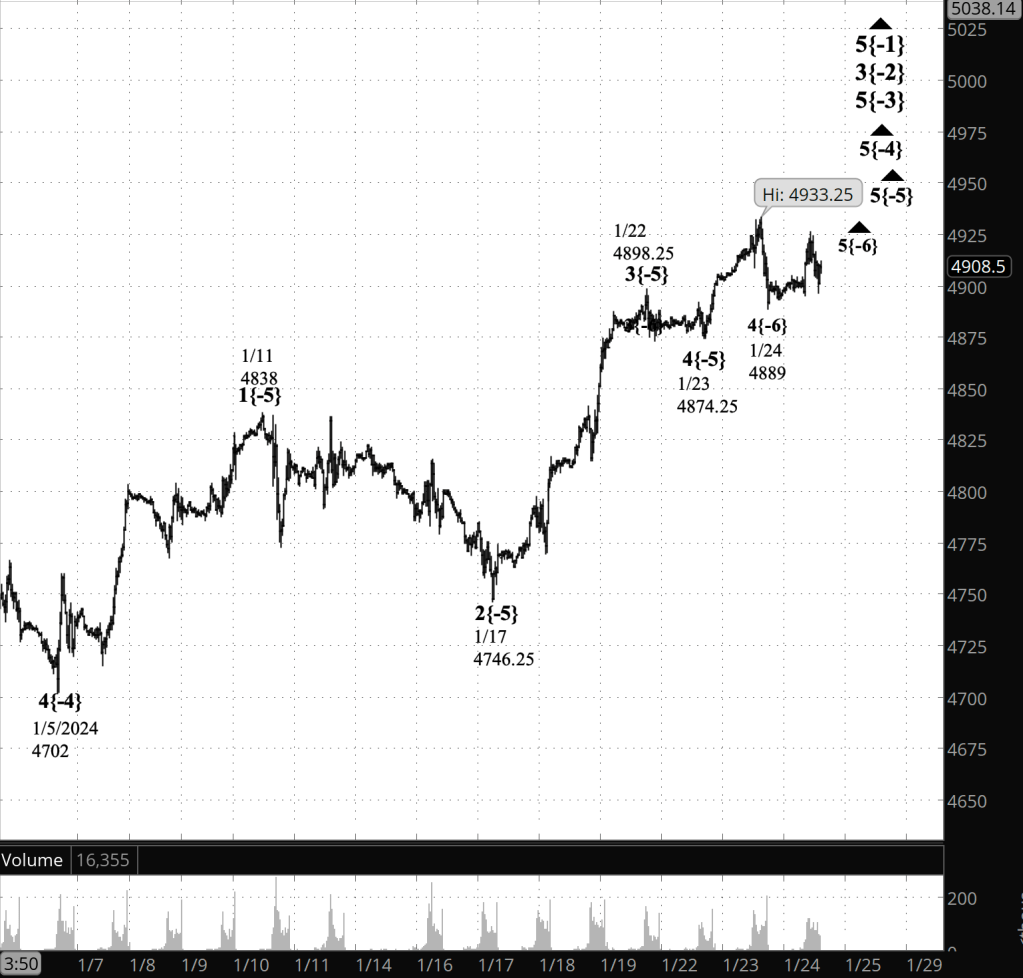
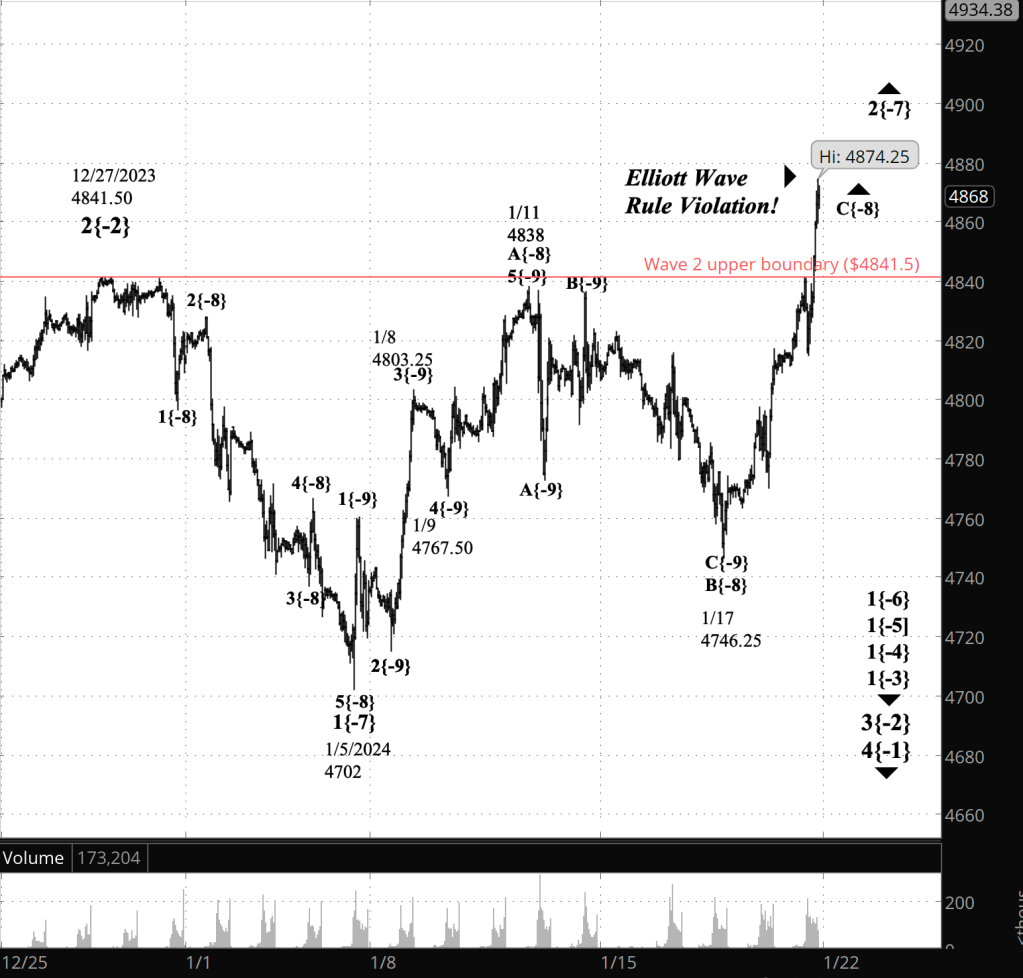
Half an hour before the closing bell. The S&P 500 futures moved higher during the session, to a peak of 4934.25, and then pulled back slightly. The new high gives this morning’s principal analysis an edge over the alternative analysis. It is more likely that the rise that began on January 23 is in its 5th and final subwave. The alternative, that a 4th subwave downward correction is underway, has proven to be less likely. I’ve updated the chart.
2:10 p.m. New York time
Trades. I’ve exited my longer-term short Iron Condor position on IWM with 21 days to expiration, which I entered on January 12, or 35 days to expiration. For longer-term positions, 21 DTE is my standard management day, when I exit profitable positions and figure out what to do with the unprofitable ones. The IWM positions produced a 21.3% profit. I’ve updated the trade analysis with results.
I entered a short-term position on SPY, structured as a short Iron Fly, with goal of holding it over the weekend and exiting on Monday, January 29, shortly after the opening bell. I’ve posted a trade analysis.
9:35 a.m. New York time
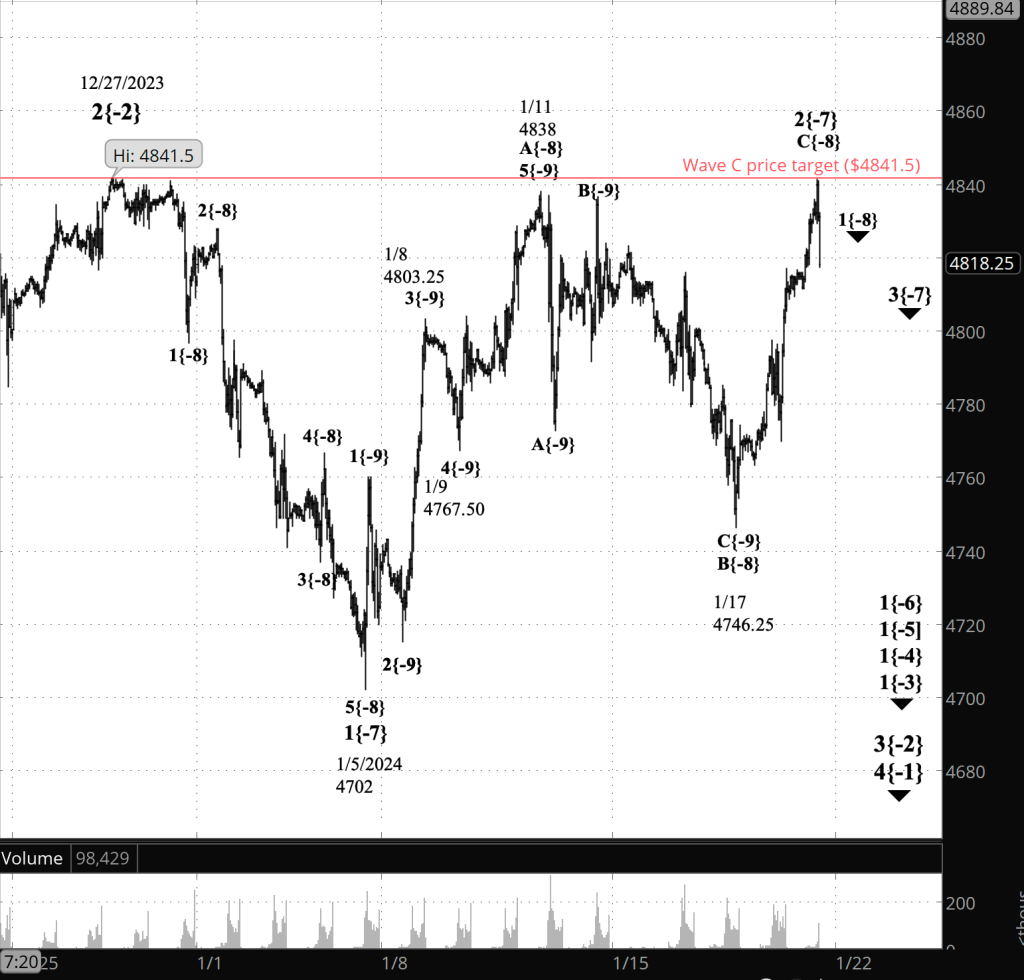
What’s happening now? The S&P 500 E-mini futures slowly worked its way higher with a series of ups and downs that have reached a few points above the prior days high.
What does it mean? The upward tilt, no mater how slight, increases the likelihood that the rise that began on January 24 is a 5th wave, the final subwave within a larger uptrending 5th wave that began on January 5.
What are the alternatives? The alternative interpretation, also of high likelihood, sees the price movement from January 24 as a 4th wave, the next-to-the last subwave within the larger uptrending 5th wave. [Note: The afternoon analysis makes this alternative less likely.]

[S&P 500 E-mini futures at 3:30 p.m., 40-minute bars, with volume]
What does Elliott wave theory say? Here are the waves that underly the analyses.
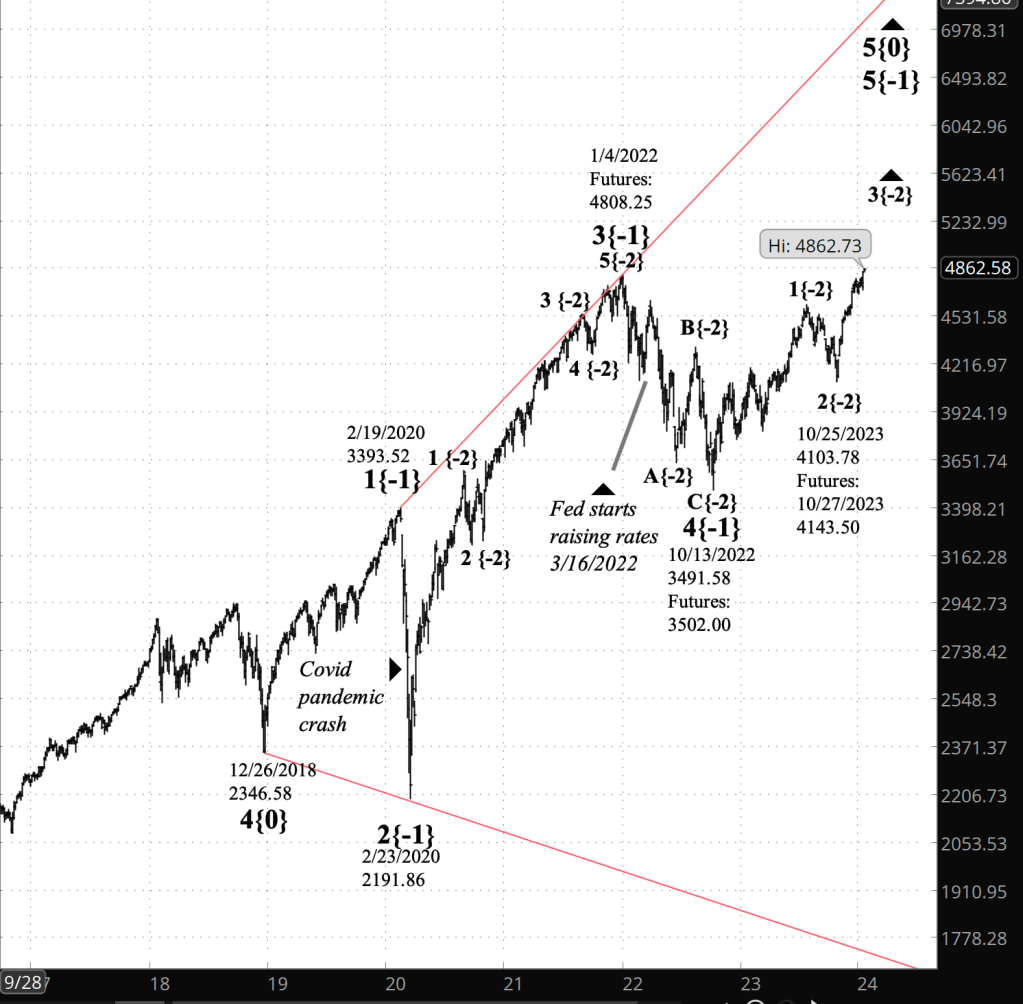
Principal Analysis:
- Wave 5{0}, an expanding Diagonal Triangle, began on December 26, 2018.
- Within it, an uptrend, wave 5{-1}, began on October 13, 2022 and is underway.
- Wave 5{-1} is the parent wave of a uptrend, wave 3{-2}, that began on October 25, 2023 and is in wave 5{-3}, the last of five subwaves.
- Wave 5{-3} is in turn in its last subwave, wave 5{-4}, which is also in its final subwave, wave 5{-5}.
- When wave 5{-5} is complete, it will also be the end of waves 5{-4}, 5{-3} and 3{-2}, and a downward correction, wave 4{-2}, will begin.
- At a very small degree — hours rather than days — wave 5{-6} has begun its rise.
Alternative Analysis
- At a very small degree, wave 4{-6}, a downward correction, has entered its middle subwave, rising wave B{-7}. [Note: The afternoon analysis makes this alternative less likely.]
We Are Here.
These are the waves currently in progress under my principal analysis. Each line on the list shows the wave number, with the subscript in curly brackets, the traditional degree name, the starting date, the starting price of the S&P 500 E-mini futures, and the direction of the wave.
- S&P 500 Index:
- 5{+3} Supercycle, 7/8/1932, 4.40 (up)
- 5{+2} Cycle, 12/9/1974, 60.96 (up)
- 5{+1} Primary, 3/6/2009, 666.79 (up)
- 5{0} Intermediate, 12/26/2018, 2346.58 (up)
- S&P 500 Futures and index:
- 5{-1} Minor, 10/13/2022, 3502 (up) (futures), 3491.58 (up) (index)
- S&P 500 Futures:
- 3{-2} Minute, 10/27/2023, 4143.50 (up)
- 5{-3} Minuette, 10/27/2023, 4143.50 (up)
Reading the chart. Price movements — waves – – in Elliott wave analysis are labeled with numbers within trending waves and letters with corrective waves. The subscripts — numbers in curly brackets — designate the wave’s degree, which, in Elliott wave analysis, means the relative position of a wave within the larger and smaller structures that make up the chart. R.N. Elliott, who in the 1930s developed the form of analysis that bears his name, viewed the chart as a complex structure of smaller waves nested within larger waves, which in turn are nested within still larger waves. In mathematics it’s called a fractal structure, where at every scale the pattern is similar to the others.
Learning and other resources. Elliott wave analysis provides context, not prophecy. As the 20th century semanticist Alfred Korzybski put it in his book Science and Sanity (1933), “The map is not the territory … The only usefulness of a map depends on similarity of structure between the empirical world and the map.” And I would add, in the ever-changing markets, we can judge that similarity of structure only after the fact.
See the menu page Analytical Methods for a rundown on where to go for information on Elliott wave analysis.
By Tim Bovee, Portland, Oregon, January 26, 2024
Disclaimer
Tim Bovee, Private Trader tracks the analysis and trades of a private trader for his own accounts. Nothing in this blog constitutes a recommendation to buy or sell stocks, options or any other financial instrument. The only purpose of this blog is to provide education and entertainment.
No trader is ever 100 percent successful in his or her trades. Trading in the stock and option markets is risky and uncertain. Each trader must make trading decisions for his or her own account, and take responsibility for the consequences.
License
All content on Tim Bovee, Private Trader by Timothy K. Bovee is licensed under a Creative Commons Attribution-ShareAlike 4.0 International License.
Based on a work at www.timbovee.com.


You must be logged in to post a comment.