3:30 p.m. New York time
Half an hour before the closing bell. The S&P 500 futures fluctuated sideways during the session, leaving unresolved the ambiguities identified by this morning’s alternatives.
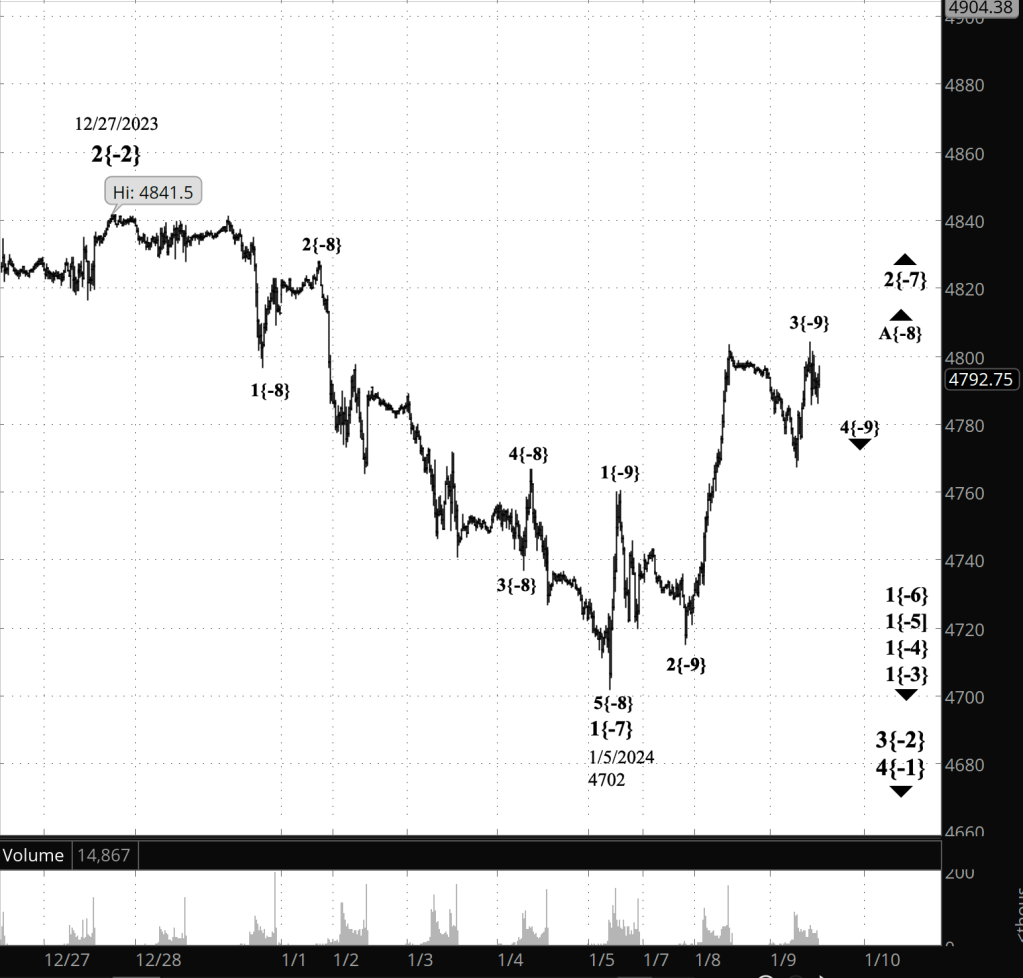
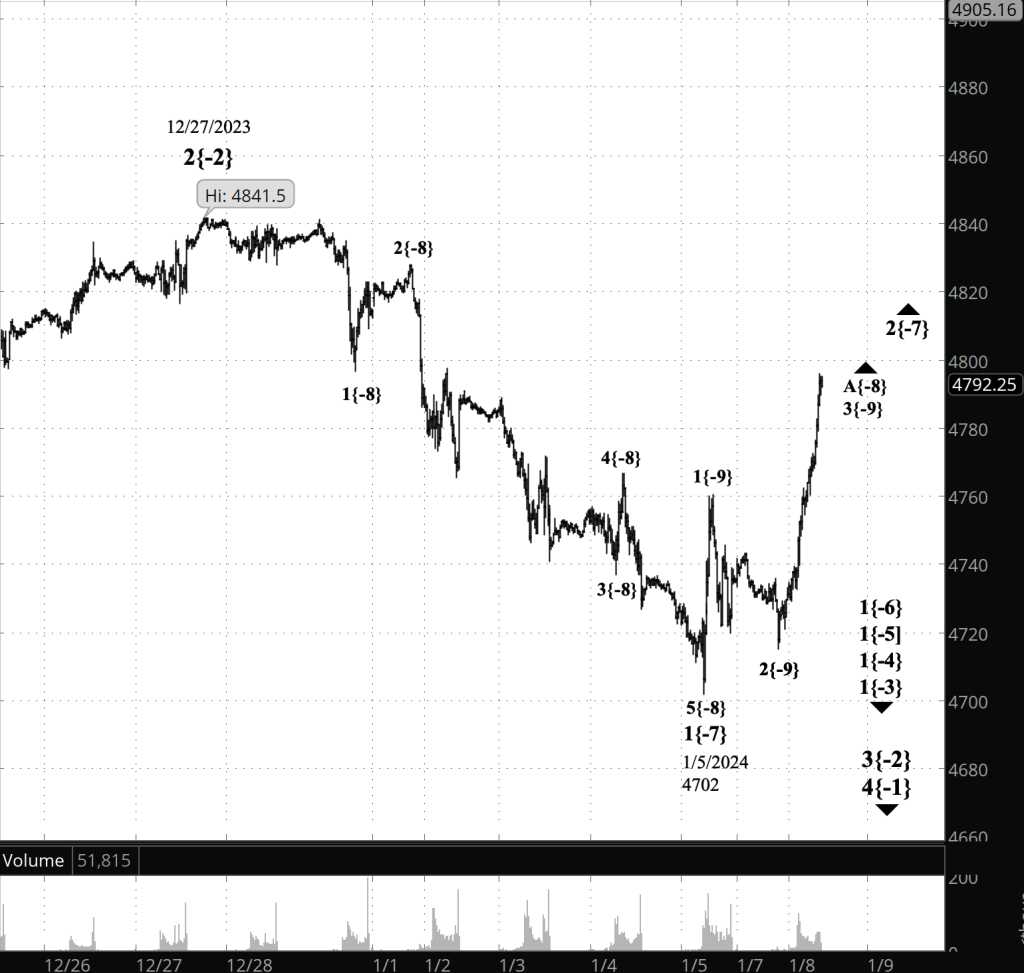
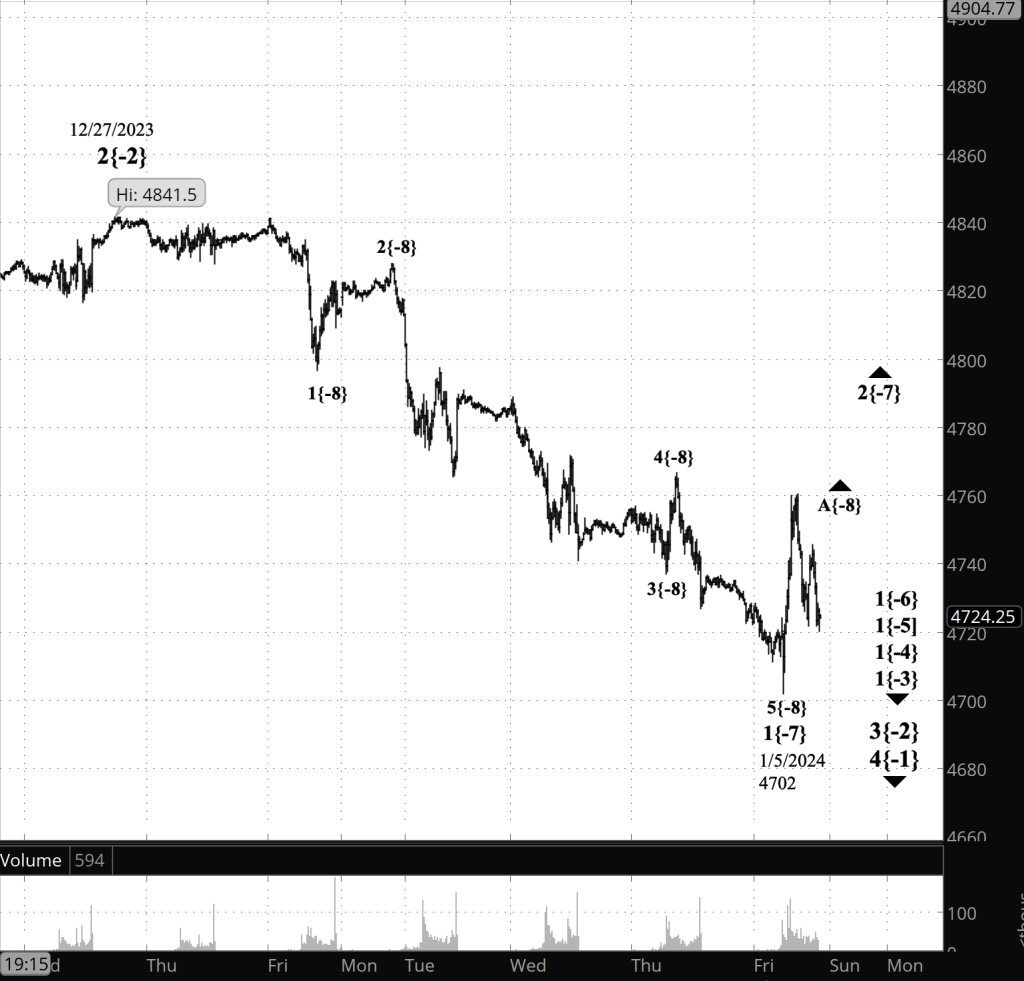
The principal analysis remains unchanged: The middle subwave, a B wave, within the 2nd-wave upward correction that began on January 5 continues.
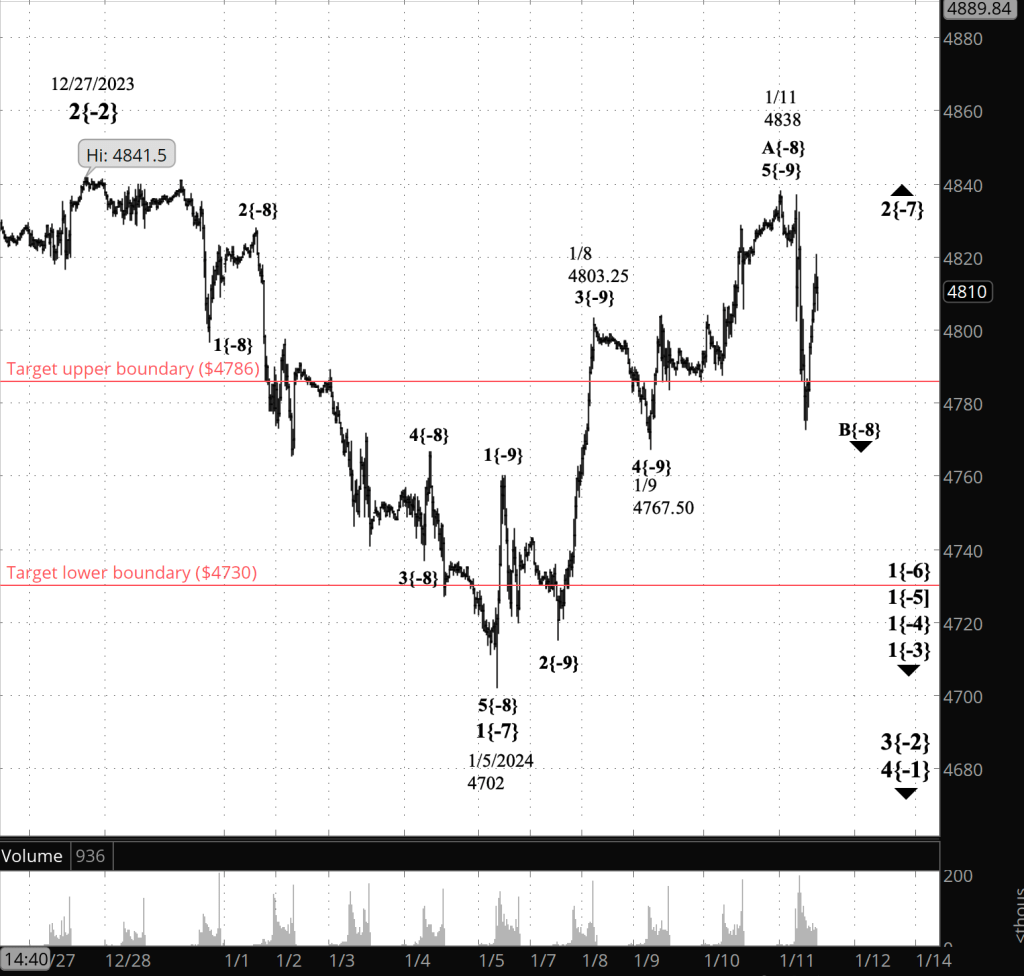
I’ve updated the upper chart, a close-up view of the correction as traced by the futures.
3:15 p.m. New York time
Markets on Monday. Markets in the U.S. will be closed on Monday for Martin Luther King Day, a holiday honoring the civil rights leader. The S&P 500 futures will resume trading Monday evening at 6:30 p.m., and my next Trader’s Notebook post will be Tuesday morning at 9:35 a.m., both New York time.
2:05 p.m. New York time
Trades. I’ve entered two options trades today: A short Iron Condor on IWM that expires on February 16 and a short Iron Fly on SPY that expires on January 16, after the long holiday weekend. I’ve added trade analyses for IWM and SPY
9:35 a.m. New York time
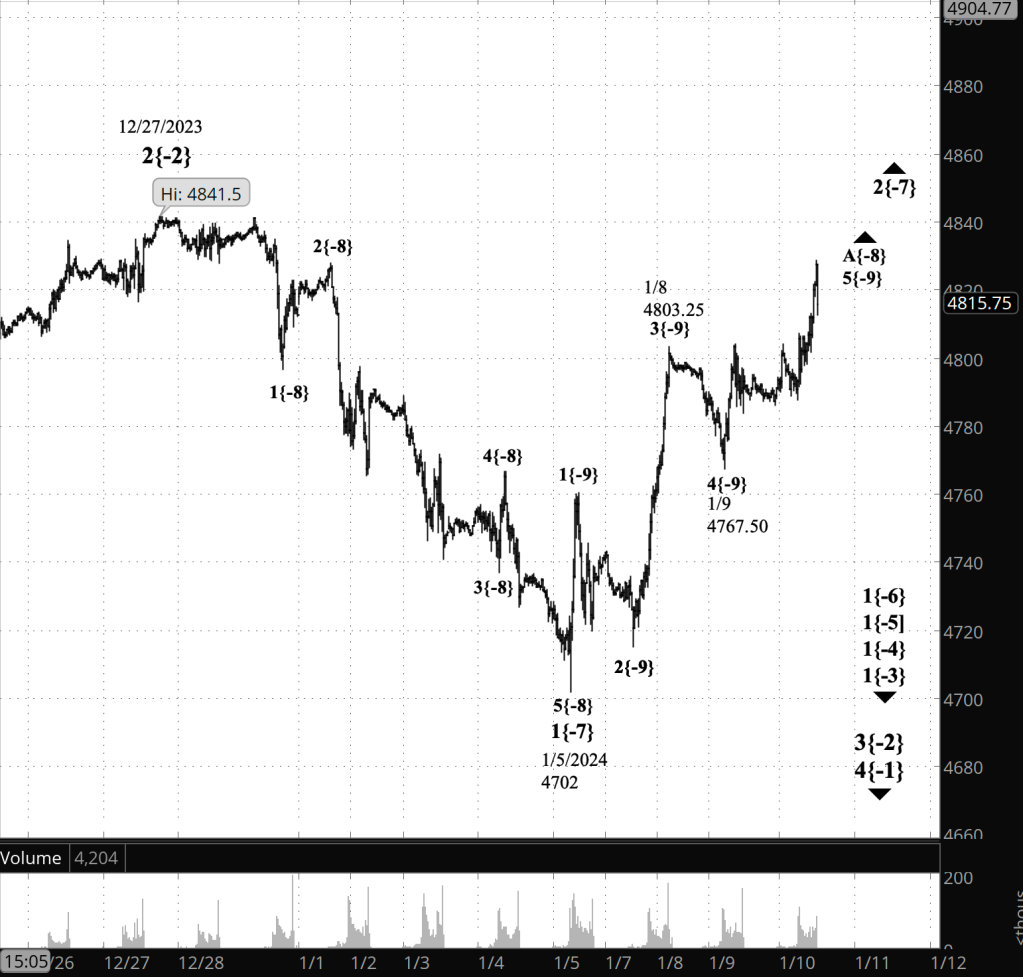
What’s happening now? The S&P 500 E-mini futures fluctuated between the 4820s and the 4790s overnight, rising into the 4830s as the opening bell sounded.
What does it mean? The relatively small 2nd-wave upward correction that began on January 5 continues to work through its middle subwave, wave B. The correction is part of a much larger 3rd-wave downtrend that began on December 27, 2023.
The red lines on the upper chart are the boundaries of wave B’s target range.
What are the alternatives? In the following discussion, indicate a wave’s position within the fractal hierarchy of the price movements with a subscript in curly brackets. The position indicator shows the number of degree away from what the developer of Elliott Wave Theory, R.N. Elliott, call the Intermediate Degree, which I designate as wave position {0}. Negative position indicators are smaller than position {0}, and positive indicators are larger.
There are three alternatives:
Alternative #1: The 2nd wave rise (wave 2{-2} on the chart) that preceded the 3rd wave (wave 3{-2}) is still underway and is taking a compound form. The present decline is an X wave, which will link the first corrective pattern within wave 2 to a second corrective pattern. A compound correction contains up to three corrective patterns.
Alternative #2: This is more of a general observation. Assigning a degree to subwaves early in a correction is, frankly, little more than an educated guess. The degrees I’ve assigned may change over time as the downtrend progresses. So for example, wave 2{-7} on the chart could well be wave 2{-6} or 2{-5}.
Alternative #3: The low-degree B subwave — wave B{-8} — may in have have ended at the overnight low, and if so, then the rise that followed is part of wave C{-8}, the final subwave within wave 2{-7}.
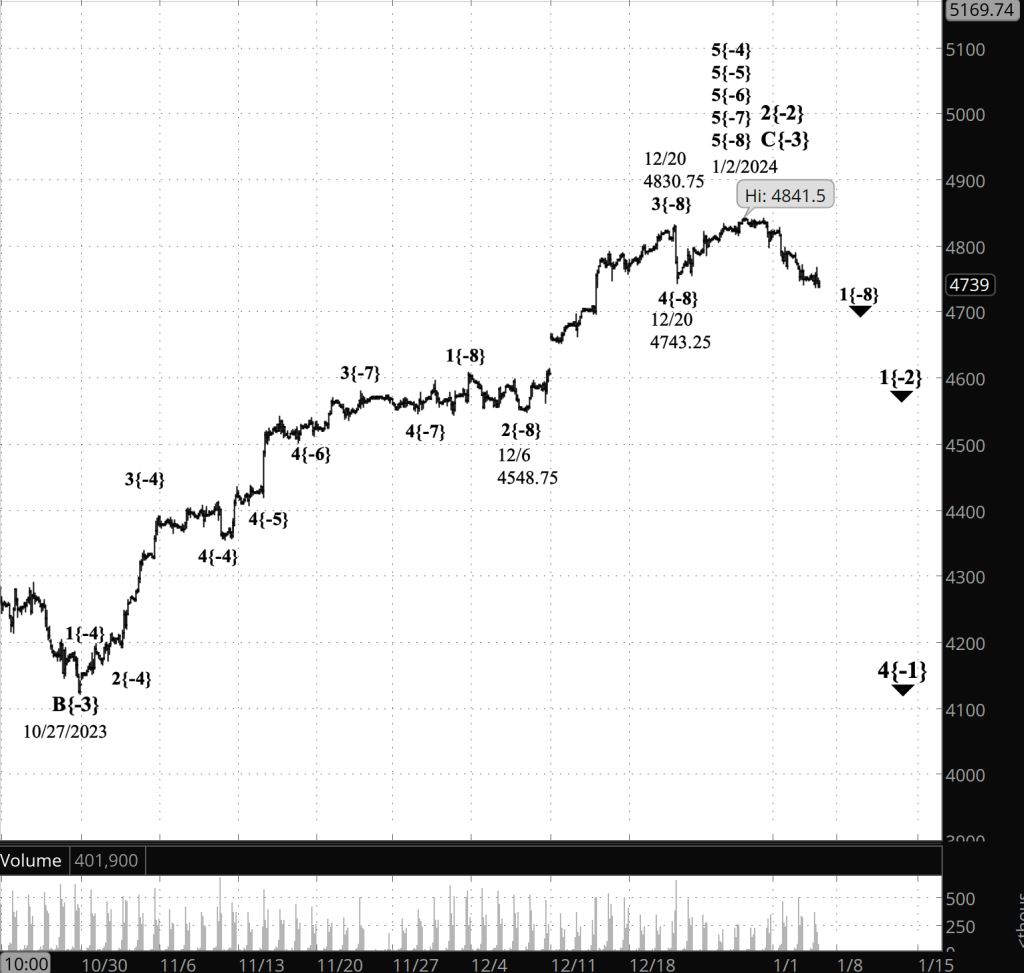
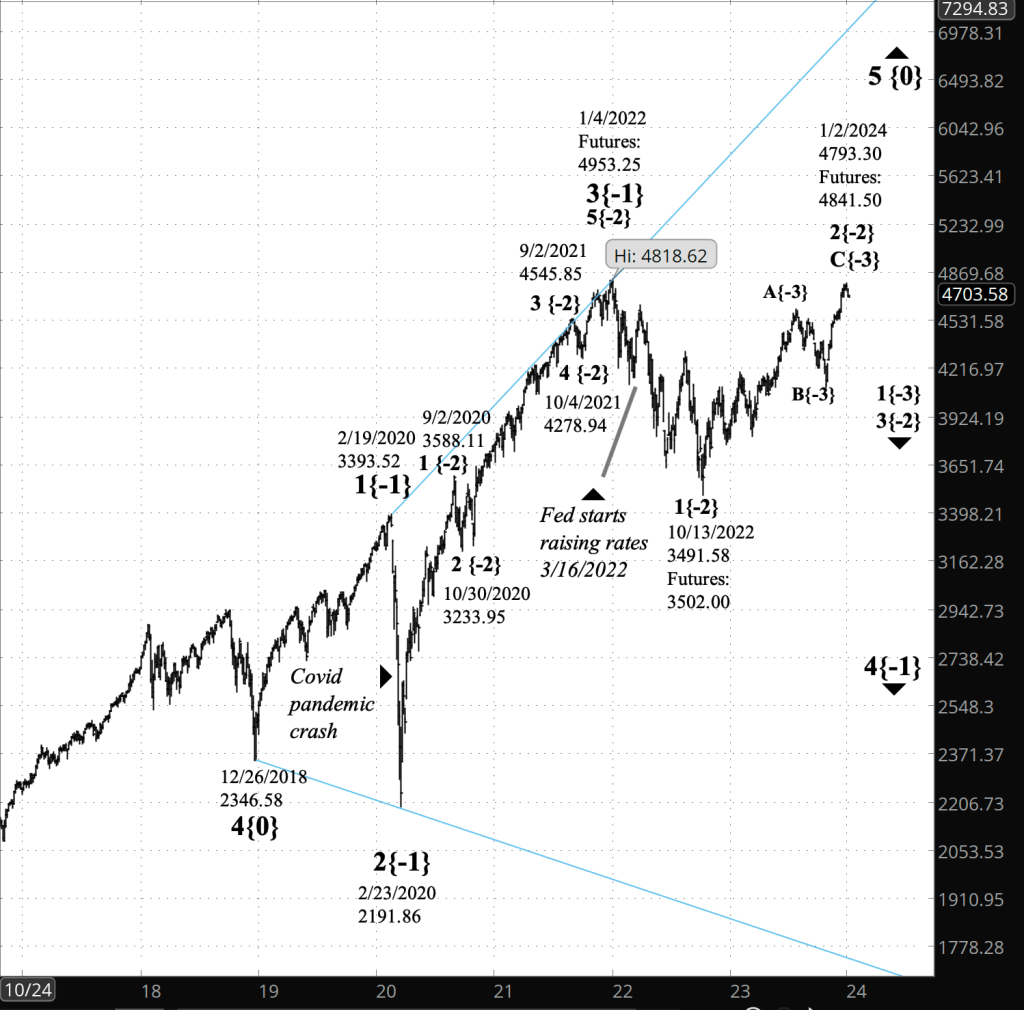
Charts. The upper chart, of the S&P 500 futures, shows the 3rd wave downtrend that began on December 27, wave 3{-2}. the lower chart, of the S&P 500 index, shows the 5th wave that began on December 26, 2018, wave 5{0}, which is taking the form of an expanding Diagonal Triangle.
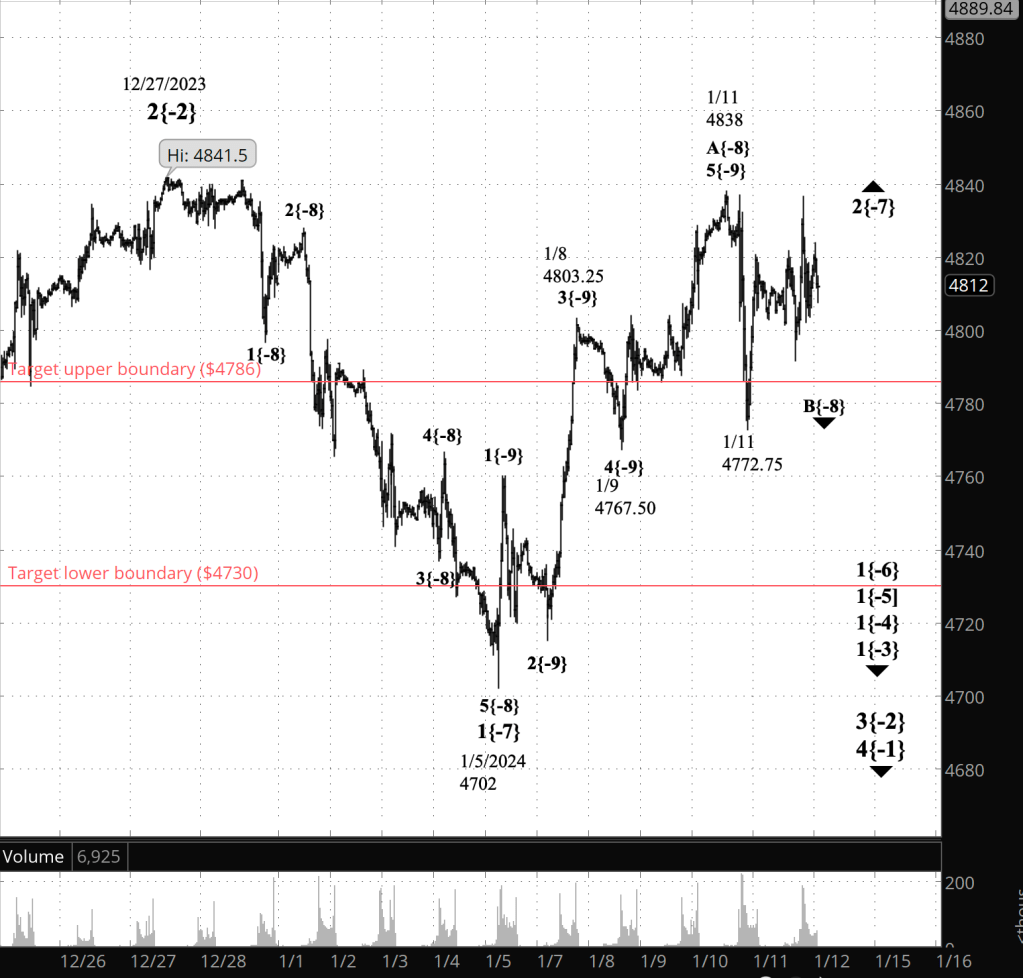
[S&P 500 E-mini futures at 3:30 p.m., 30-minute bars, with volume]
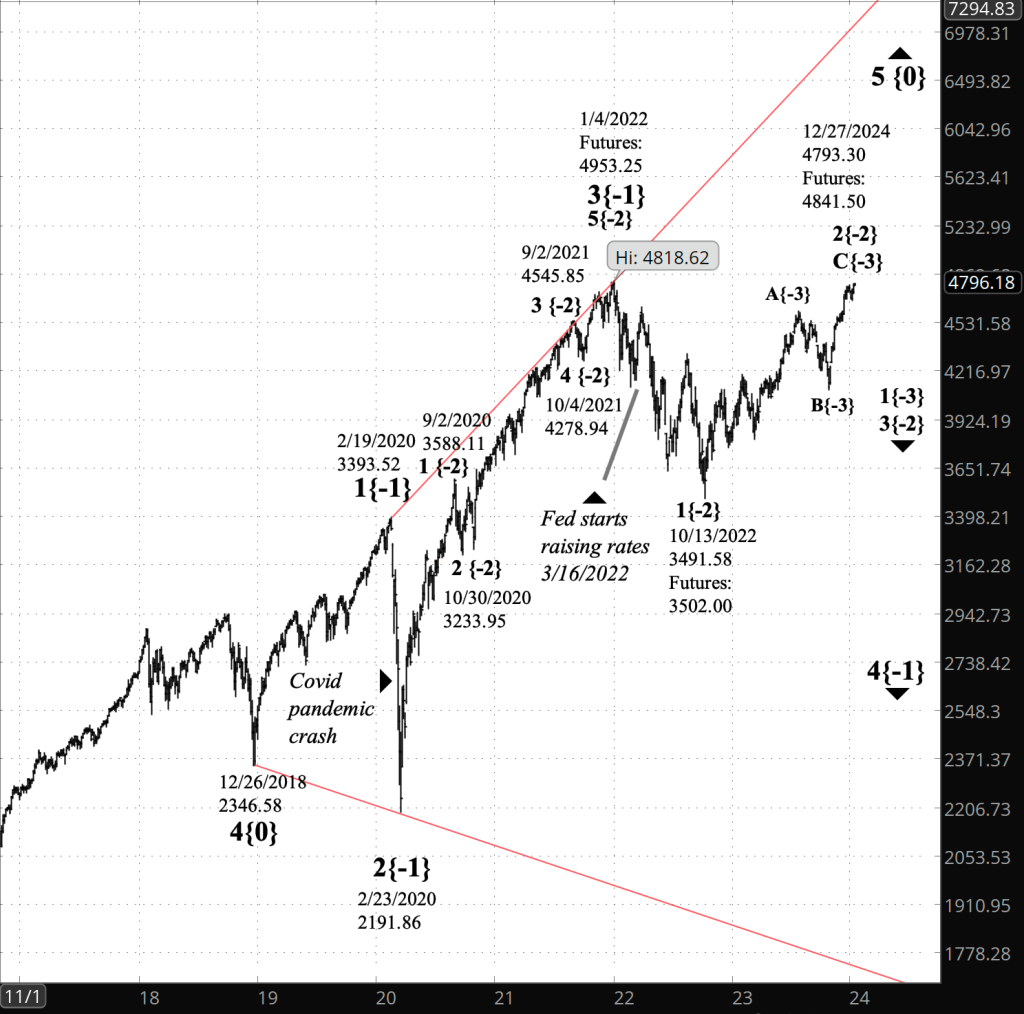
[S&P 500 index at 9:34 a.m., 3-day bars]
What does Elliott wave theory say? Here are the waves that underly the analyses.
Principal Analysis:
- Wave 5{0}, an expanding Diagonal Triangle, began on December 26, 2018.
- Within it, a downtrend, wave 4{-1}, began on January 4, 2022 and is underway.
- Wave 4{-1} is the parent wave of a downtrend, wave 3{-2}, that began on January 2, 2024 and is in wave 1{-3}, the first of five subwaves.
- Deep within that downtrend’s 1st wave, downtrending wave 5{-8} and its parent, wave 1{-7}, ended at the overnight low, 4702. Wave 2{-7} is now underway, an upward correction of low degree, and within it, declining wave B{-8} is underway and is within the first, wave A{-9}, of three subwaves.
Alternative #1:
- Wave 2{-2}, an upward correction that began on October 13, 2022, continues and is taking a compound form.
- Wave X{-3} is underway, connecting the now complete first corrective pattern and the not-yet-begun second corrective pattern.
Alternative #2:
- The upward correction that began on January 5, labeled on the chart was wave 2{-7}, is actually wave 2{-6}, or perhaps wave 2{-5}, or maybe even larger.
Alternative #3:
- Wave B{-8} ended overnight and wave C{-8} is underway.
We Are Here.
These are the waves currently in progress under my principal analysis. Each line on the list shows the wave number, with the subscript in curly brackets, the traditional degree name, the starting date, the starting price of the S&P 500 E-mini futures, and the direction of the wave.
- S&P 500 Index:
- 5{+3} Supercycle, 7/8/1932, 4.40 (up)
- 5{+2} Cycle, 12/9/1974, 60.96 (up)
- 5{+1} Primary, 3/6/2009, 666.79 (up)
- 5{0} Intermediate, 12/26/2018, 2346.58 (up)
- S&P 500 Futures and index:
- 4{-1} Minor, 1/4/2022, 4953.25 (down) (futures), 4818.62 (down) (index)
- S&P 500 Futures:
- 3{-2} Minute, 12/27/2023, 4841.50 (down)
- 1{-3} Minuette, 12/27/2023, 4841.50 (down)
Reading the chart. Price movements — waves – – in Elliott wave analysis are labeled with numbers within trending waves and letters with corrective waves. The subscripts — numbers in curly brackets — designate the wave’s degree, which, in Elliott wave analysis, means the relative position of a wave within the larger and smaller structures that make up the chart. R.N. Elliott, who in the 1930s developed the form of analysis that bears his name, viewed the chart as a complex structure of smaller waves nested within larger waves, which in turn are nested within still larger waves. In mathematics it’s called a fractal structure, where at every scale the pattern is similar to the others.
Learning and other resources. Elliott wave analysis provides context, not prophecy. As the 20th century semanticist Alfred Korzybski put it in his book Science and Sanity (1933), “The map is not the territory … The only usefulness of a map depends on similarity of structure between the empirical world and the map.” And I would add, in the ever-changing markets, we can judge that similarity of structure only after the fact.
See the menu page Analytical Methods for a rundown on where to go for information on Elliott wave analysis.
By Tim Bovee, Portland, Oregon, January 12, 2024
Disclaimer
Tim Bovee, Private Trader tracks the analysis and trades of a private trader for his own accounts. Nothing in this blog constitutes a recommendation to buy or sell stocks, options or any other financial instrument. The only purpose of this blog is to provide education and entertainment.
No trader is ever 100 percent successful in his or her trades. Trading in the stock and option markets is risky and uncertain. Each trader must make trading decisions for his or her own account, and take responsibility for the consequences.
License
All content on Tim Bovee, Private Trader by Timothy K. Bovee is licensed under a Creative Commons Attribution-ShareAlike 4.0 International License.
Based on a work at www.timbovee.com.


You must be logged in to post a comment.