3:30 p.m. New York time
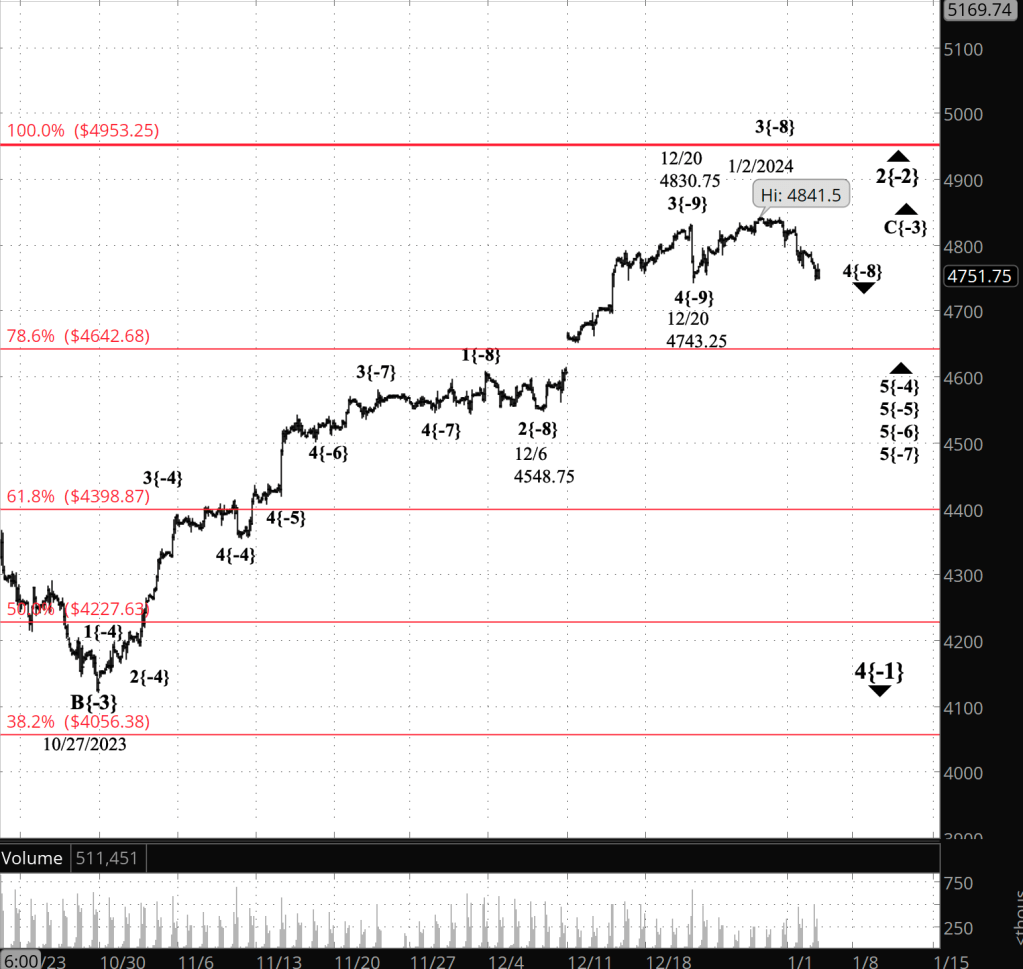
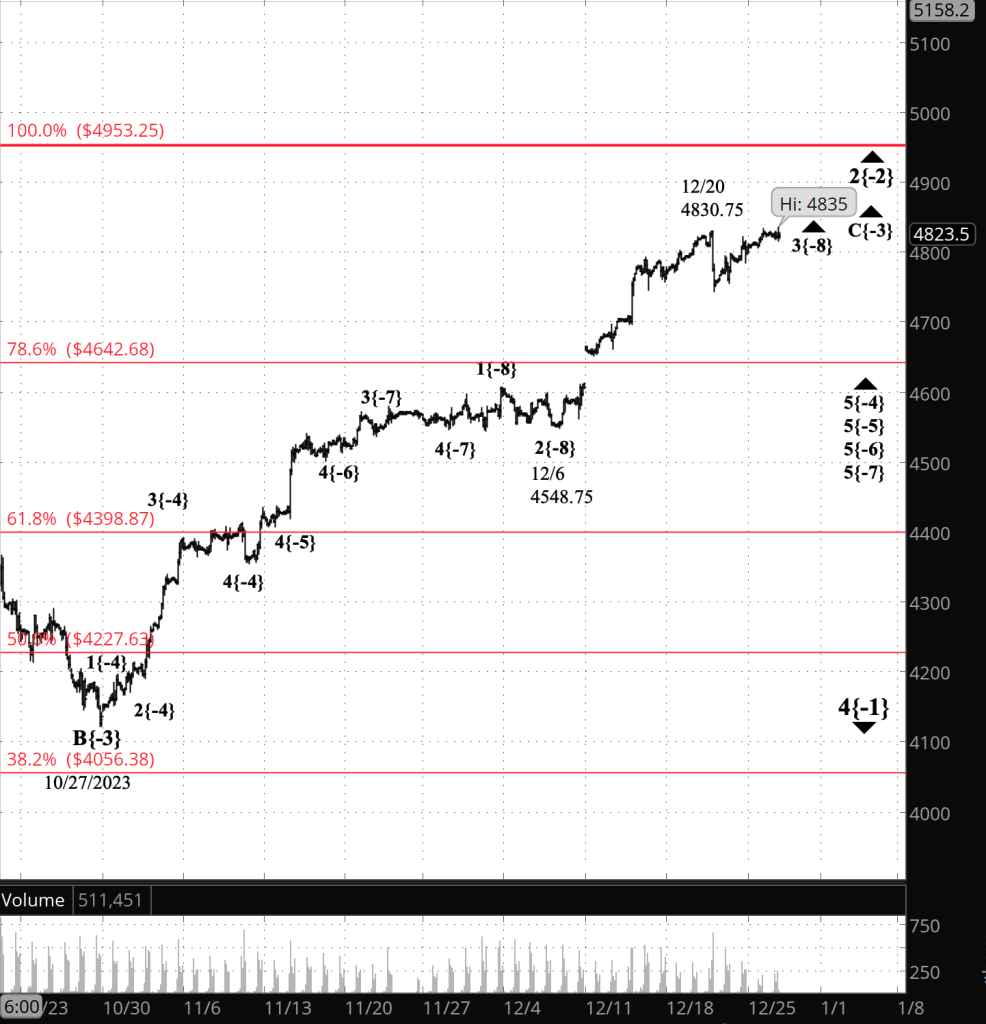
Half an hour before the closing bell. The S&P 500 futures hit a low of 4746.50 early in the session, and then rose slightly, into the 4770s. The reversal price was within the typical range of a 4th wave correction. If the price remains above the lower boundary of the range, 4743.25, then I’ll retain my present analysis: A 4th wave of low degree is underway as its much larger parent, a wave 2 upward correction, continues to work through its end game.
I’ve updated the chart.
2:50 p.m. New York time
Trades. I exited my short Iron Fly options position, the day after entry, on XSP for a 3.6% loss. It was a significant down day on the S&P 500, and XSP, which tracks the index, moved far enough so as to be unprofitable. I’ve updated the trade analysis with results.
No other trades today. I passed on entering another 1DTE trade because the ADP sneak preview to the employment numbers will be released before the opening bell. It often causes unanticipated moves in the price.
I also analyzed three possible earnings plays, on CAG, LW and WBA, and passed on all three. None produced sufficient return for a position that covered the expected moves sufficiently.
9:35 a.m. New York time
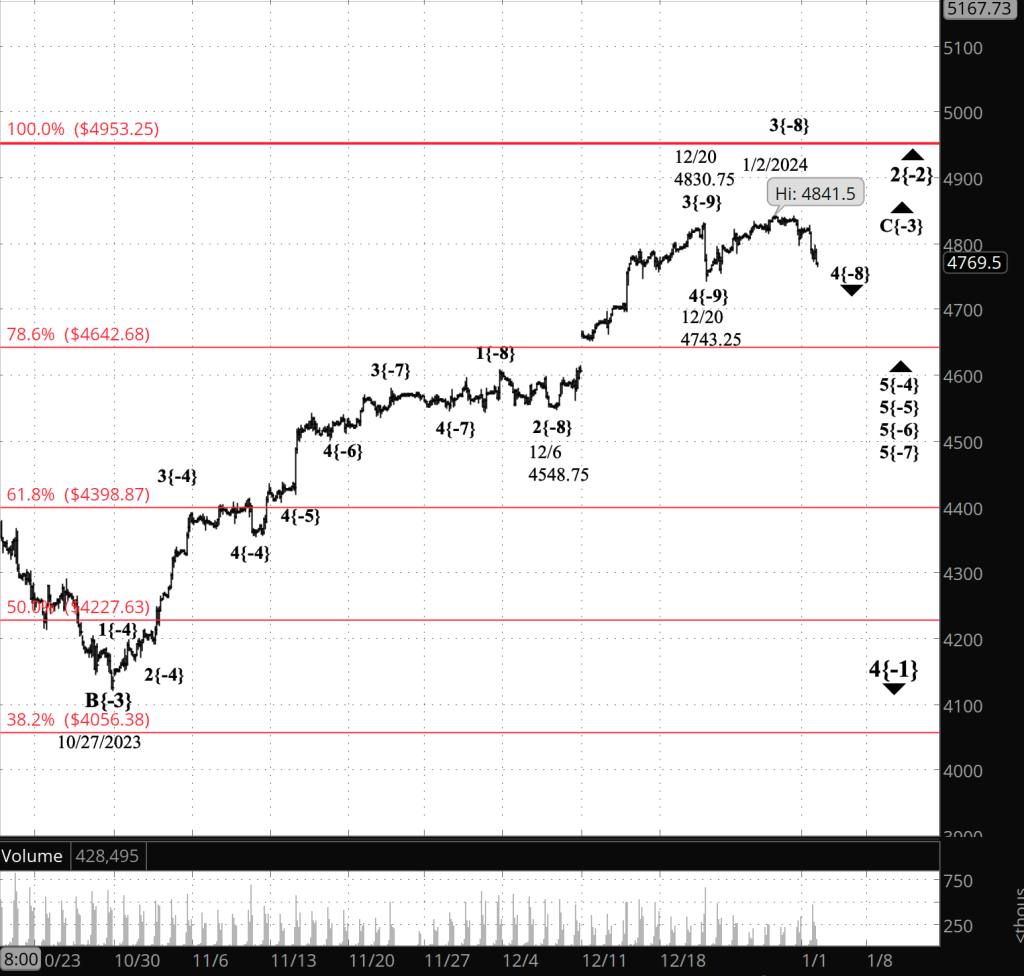
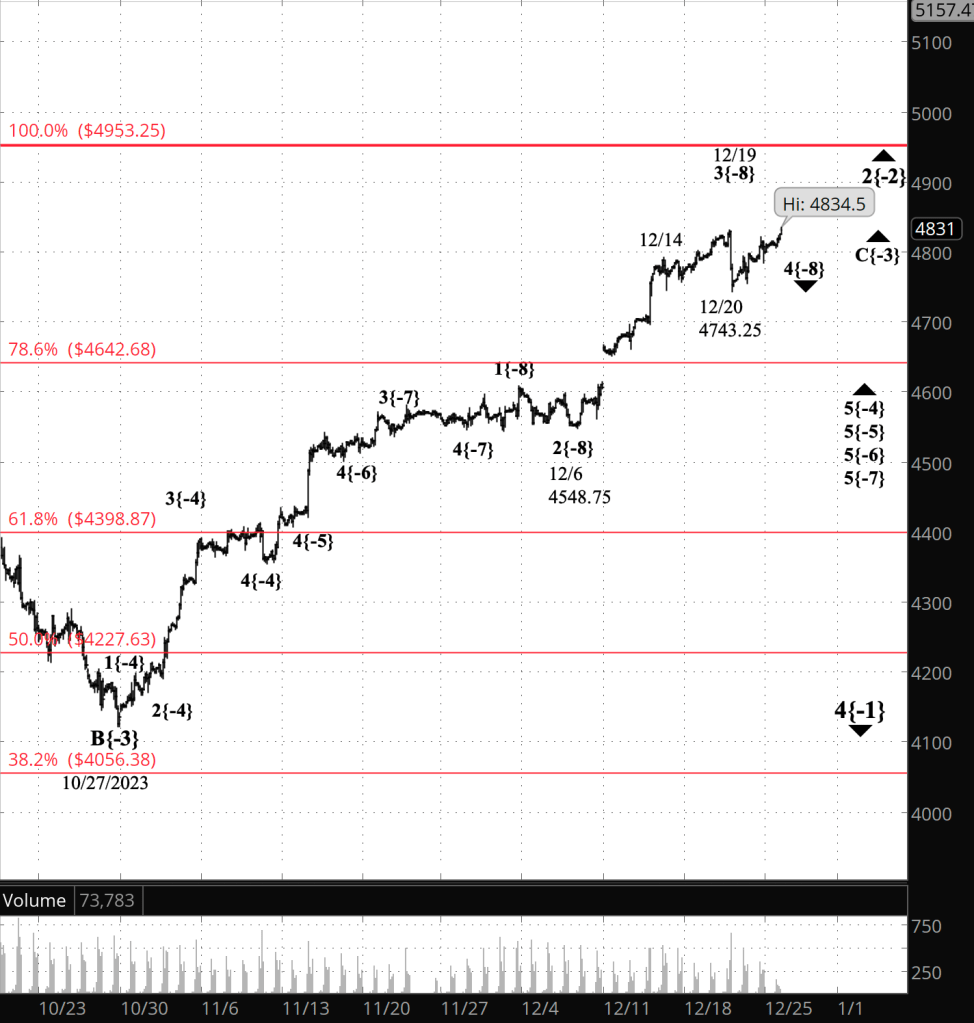
What’s happening now? The S&P 500 E-mini futures continued to decline overnight, reaching deep into the 4760s.
What does it mean? The greater the decline, the more likely the first alternative analysis becomes: The 2nd-wave upward correction ended on January 2, and a 3rd-wave downtrend has begun.
I’ve chose to retain yesterday’s principal analysis for the moment: A low degree wave 3 within the final subwave of the correction, rising wave C, ended on January 2. A low-degree 4th wave within with the much larger correction is underway and will be followed by a rising 5th wave that will end the correction.
The low-degree 4th wave remains within its typical range: The 4th subwave within the preceding 3rd wave of the same degree. That range stretches from 4830.75 to 4743.25.
If the price moves below that lower number, I will switch the chart to Alternative #1: The correction ended on January 2 and wave 3 began, retaining this morning’s principal analysis as a new 1st alternative.
What are the alternatives? There are two, the same as yesterday.
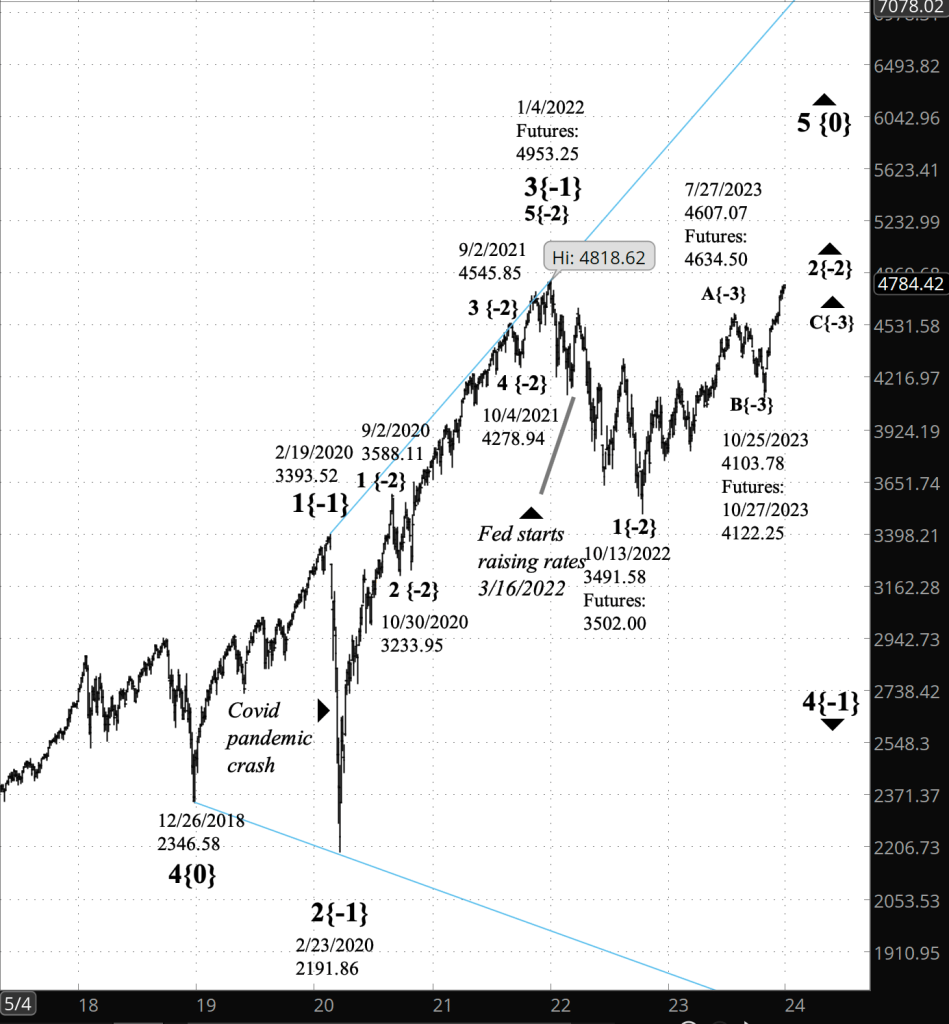
Alternative #1: It’s possible that the January 2 peak was the end of wave 5{-8}. If that proves to be the case, then the large 2nd wave — wave 2{-2} on the chart — ended at that peak, and wave 3{-2} has begun its energetic decline that will carry the price below the start of the preceding 1st wave — 3491.58 — and perhaps significantly below.
Alternative #2: It’s also possible that wave 2{-2} will take a compound form, containing two or three corrective patterns. if that proves to be the case, then the present declining is an X wave, separating the first corrective pattern, which ended overnight, from the second corrective pattern.
[S&P 500 E-mini futures at 9:35 a.m., 2-hour bars, with volume]
What does Elliott wave theory say? Here are the waves that underly the analyses.
Principal Analysis:
- A downtrend, wave 4{-1}, began on January 4, 2022 and is underway.
- Within wave 4{-1}, an upward correction, wave 2{-2}, began on October 13, 2022.
- The third wave of the correction, wave C{-3}, is underway.
- Wave C{-3} has reached its 5th and final subwave, wave 5{-4} and a series of smaller 5th waves, down to wave 5{-7}.
- Within wave 5{-7}, the next-to-the-last subwave is underway, wave 4{-8}, a decline that began on January 2, 2024.
Alternative #1:
- Wave 5{-8}, the final wave of the upward correction, ended on January 2, also ending wave C{-3} and the upward correction, wave 2{-2}.
- Wave 3{-2} is underay.
Alternative #2:
- Wave 2{-2} is taking a compound form.
- The first corrective pattern ended on January 2, the end of wave C{-3}.
- A declining connector wave is underway, wave X{-3}.
We Are Here.
These are the waves currently in progress under my principal analysis. Each line on the list shows the wave number, with the subscript in curly brackets, the traditional degree name, the starting date, the starting price of the S&P 500 E-mini futures, and the direction of the wave.
- S&P 500 Index:
- 5{+3} Supercycle, 7/8/1932, 4.40 (up)
- 5{+2} Cycle, 12/9/1974, 60.96 (up)
- 5{+1} Primary, 3/6/2009, 666.79 (up)
- 5{0} Intermediate, 12/26/2018, 2346.58 (up)
- S&P 500 Futures and index:
- 4{-1} Minor, 1/4/2022, 4953.25 (down) (futures), 4818.62 (down) (index)
- S&P 500 Futures:
- 2{-2} Minute, 10/13/2022, 3491.58 (up)
- C{-3} Minuette, 10/27/2023, 4122.25 (up)
Reading the chart. Price movements — waves – – in Elliott wave analysis are labeled with numbers within trending waves and letters with corrective waves. The subscripts — numbers in curly brackets — designate the wave’s degree, which, in Elliott wave analysis, means the relative position of a wave within the larger and smaller structures that make up the chart. R.N. Elliott, who in the 1930s developed the form of analysis that bears his name, viewed the chart as a complex structure of smaller waves nested within larger waves, which in turn are nested within still larger waves. In mathematics it’s called a fractal structure, where at every scale the pattern is similar to the others.
Learning and other resources. Elliott wave analysis provides context, not prophecy. As the 20th century semanticist Alfred Korzybski put it in his book Science and Sanity (1933), “The map is not the territory … The only usefulness of a map depends on similarity of structure between the empirical world and the map.” And I would add, in the ever-changing markets, we can judge that similarity of structure only after the fact.
See the menu page Analytical Methods for a rundown on where to go for information on Elliott wave analysis.
By Tim Bovee, Portland, Oregon, January 3, 2024
Disclaimer
Tim Bovee, Private Trader tracks the analysis and trades of a private trader for his own accounts. Nothing in this blog constitutes a recommendation to buy or sell stocks, options or any other financial instrument. The only purpose of this blog is to provide education and entertainment.
No trader is ever 100 percent successful in his or her trades. Trading in the stock and option markets is risky and uncertain. Each trader must make trading decisions for his or her own account, and take responsibility for the consequences.
License
All content on Tim Bovee, Private Trader by Timothy K. Bovee is licensed under a Creative Commons Attribution-ShareAlike 4.0 International License.
Based on a work at www.timbovee.com.


You must be logged in to post a comment.