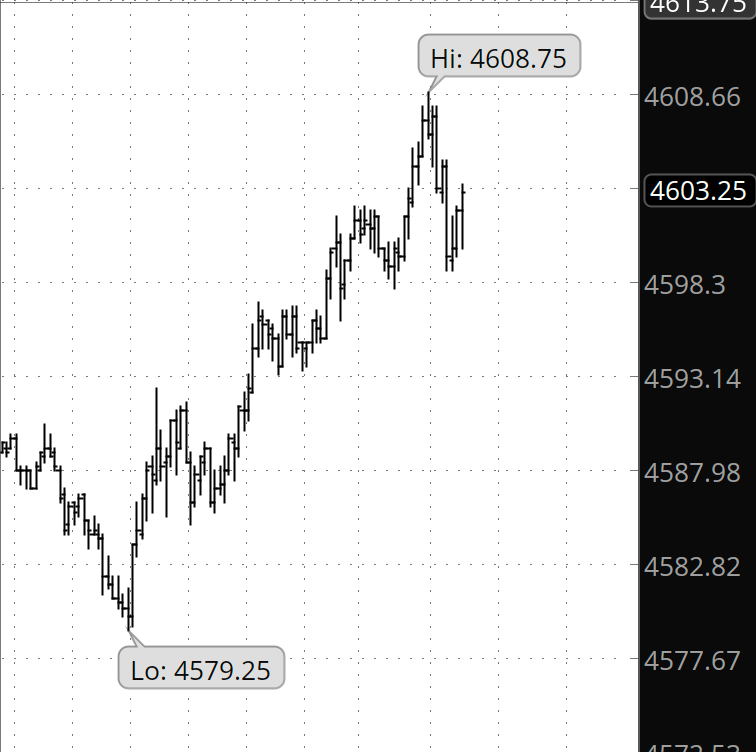
3:30 p.m. New York time
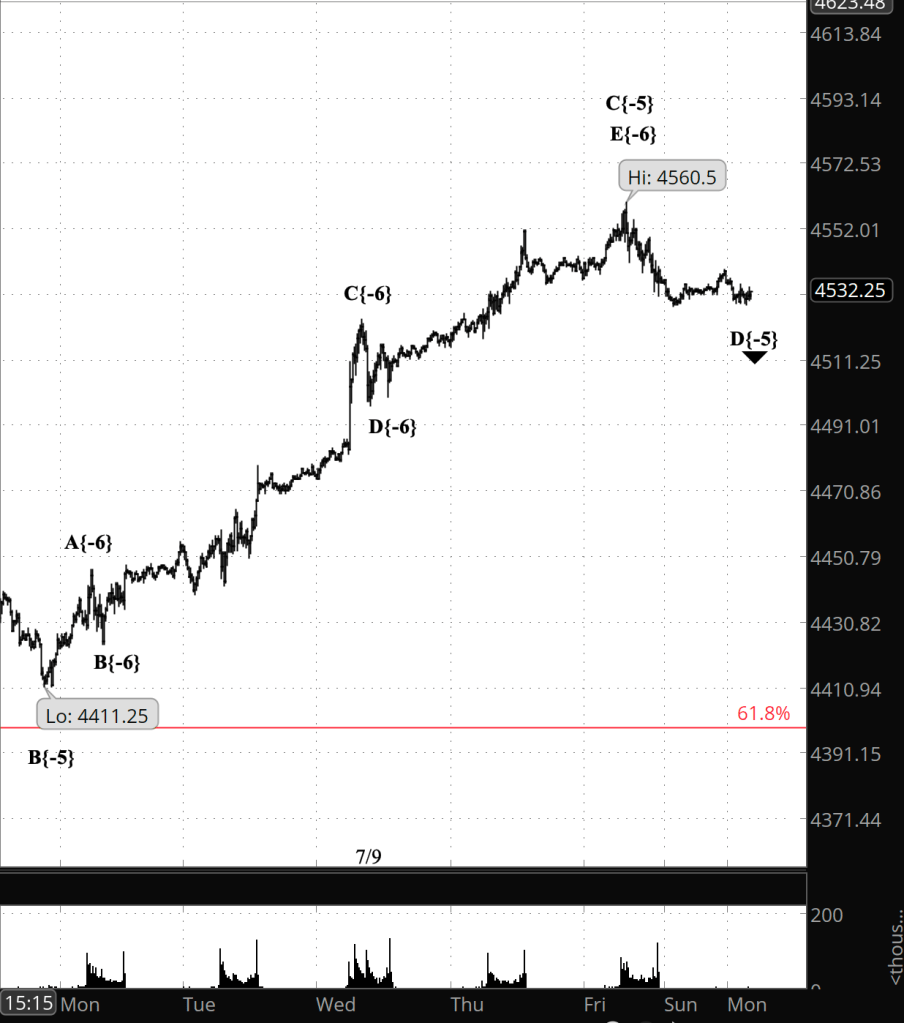
Half an hour before the closing bell. The S&P 500 futures rose into the 4610s during session, remaining below the July 27 high, 4634.50. This morning’s inventory of the ambiguities on the chart is unchanged. I’ve updated the chart.
9:37 a.m. New York time
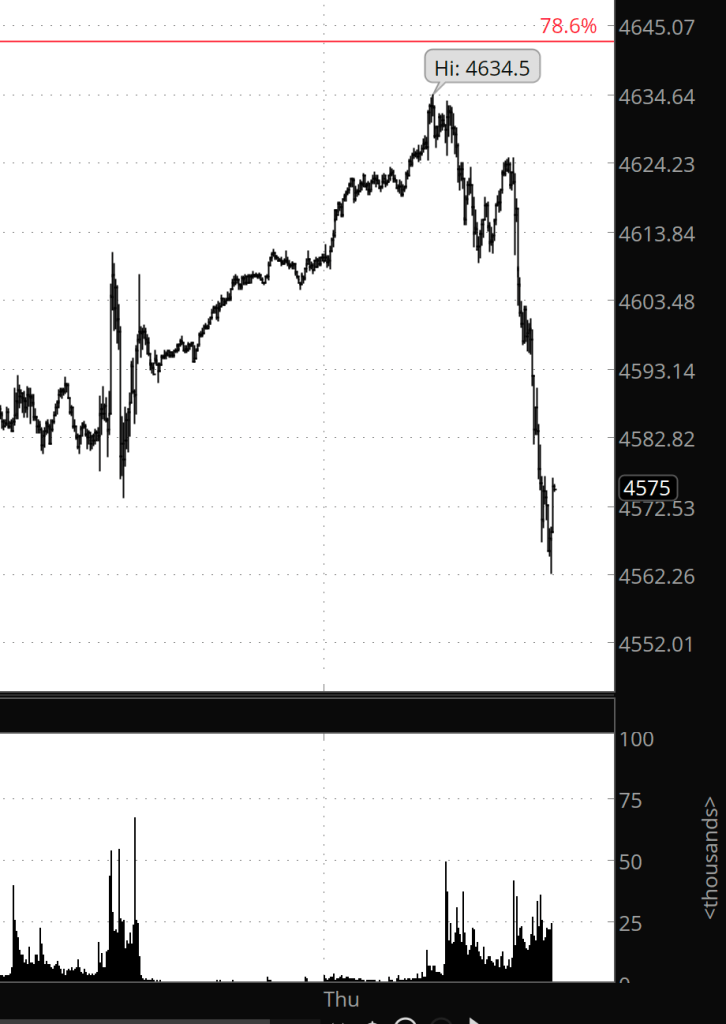
What’s happening now? The S&P 500 E-mini futures rose back into the 4590s after falling sharply in yesterday’s session, from a high of 4634.50 down to 4553.75.
What does it mean? The fall and partial recovery open up a number of mutually exclusive interpretations regarding the upward correction that began on October 13, 2022. The correction took a compound form and contains two corrective patterns.
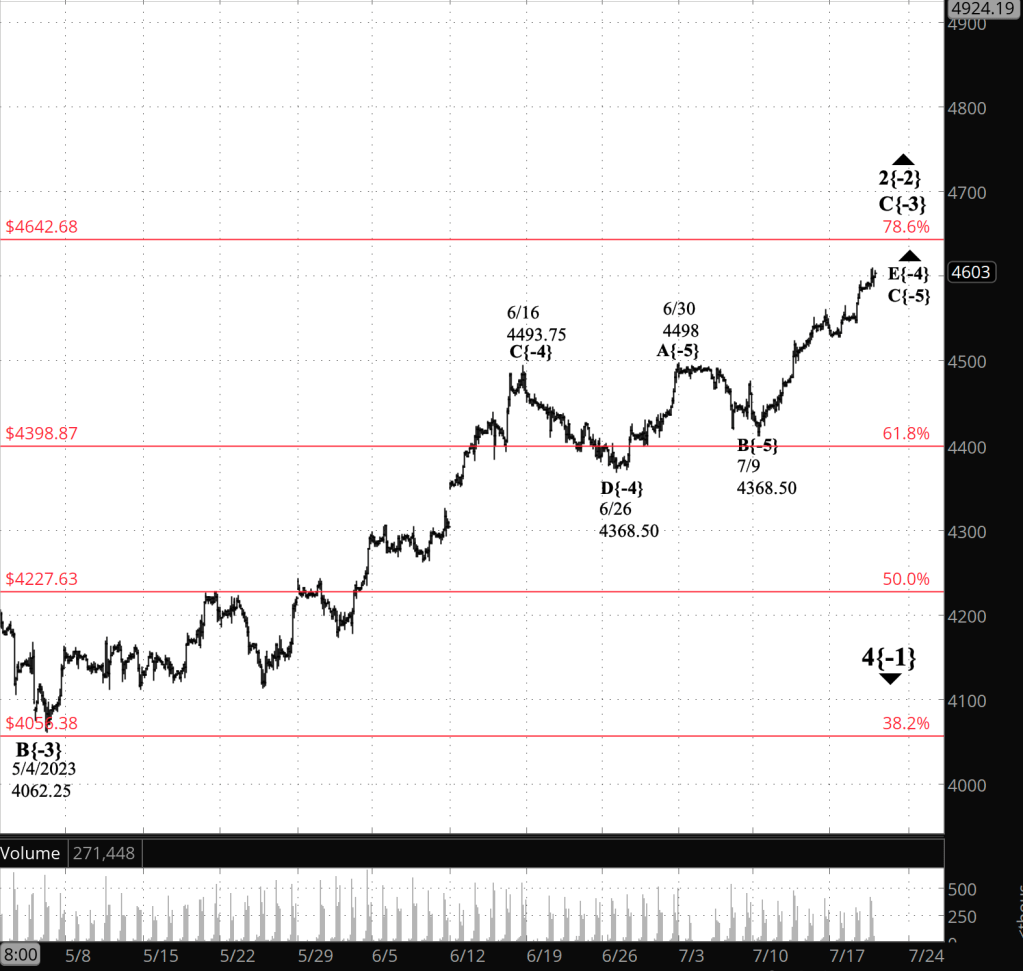
I’ve moved the chart in to show the final leg of the second corrective pattern.
This is no “What are the alternatives?” section to this analysis. They’re all alternatives.
The possible waves are marked on the chart with question marks.
Here’s the list:
- The second corrective pattern with an upward correction, wave 2{-2}, ended at the July 27 peak, 4734.50.
- That sets up the following scenarios:
- Wave 2{-2} will only contain two corrective patterns. Therefore, wave 2{-2} has ended and the first steps of a major downtrend, wave 3{-2}, are underway.
- Or, wave 2{-2} will move on to a 3rd corrective pattern and a connector, downward wave X{-3}, is underway.
Another set of possibilities:
- The second corrective pattern within wave 2{-2}, a compound correction, is still underway and is nearing its end.
- That sets up the following scenarios:
- Within the last leg of the second corrective pattern, wave C{-3}’s final subwave is underway, wave E{-4}, and within it, a final subwave one degree lower, wave E{-5}, is underway.
- Or, the middle subwave, wave C{-5}, is still continuing its rise.
Complex enough? I expect the whole ambiguous mess to resolve itself fairly quickly, if not today then next week.
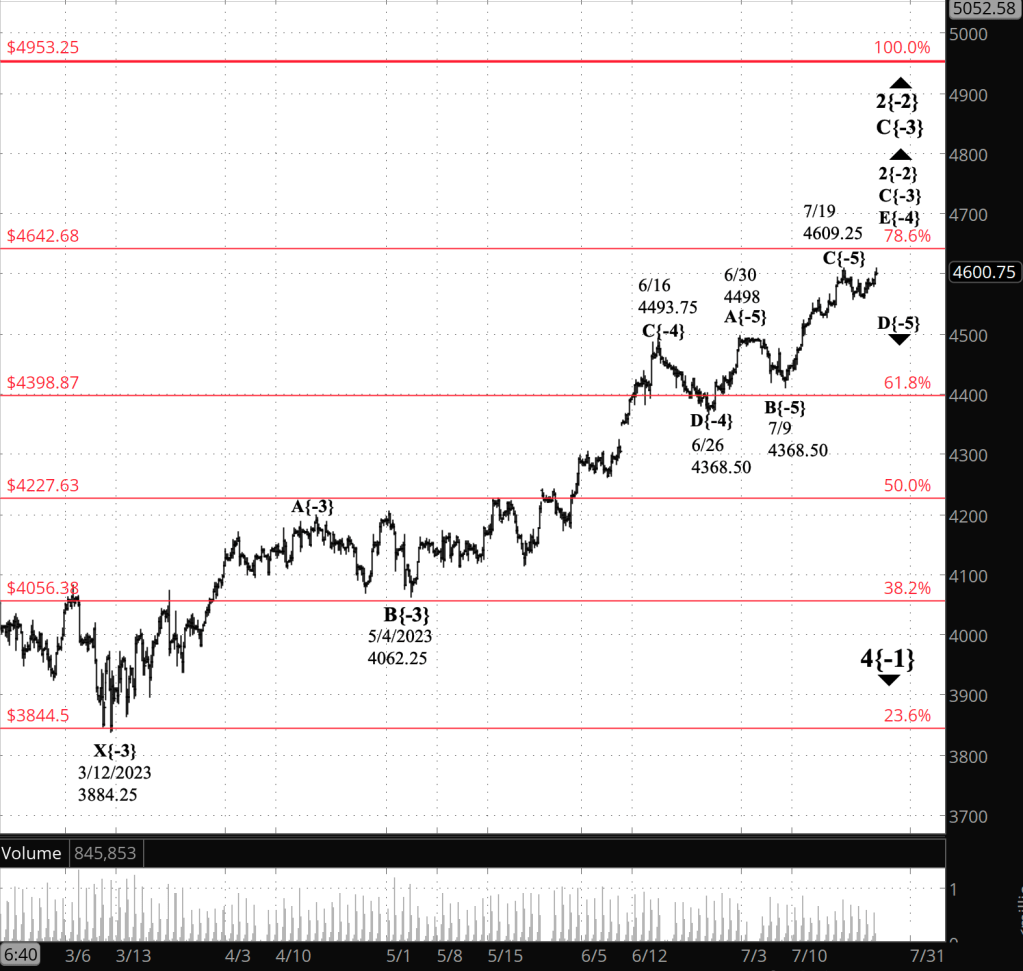
Reading the chart. Price movements — waves – – in Elliott wave analysis are labeled with numbers within trending waves and letters with corrective waves. The subscripts — numbers in curly brackets — designate the wave’s degree, which, in Elliott wave analysis, means the relative position of a wave within the larger and smaller structures that make up the chart. R.N. Elliott, who in the 1930s developed the form of analysis that bears his name, viewed the chart as a complex structure of smaller waves nested within larger waves, which in turn are nested within still larger waves. In mathematics it’s called a fractal structure, where at every scale the pattern is similar to the others.
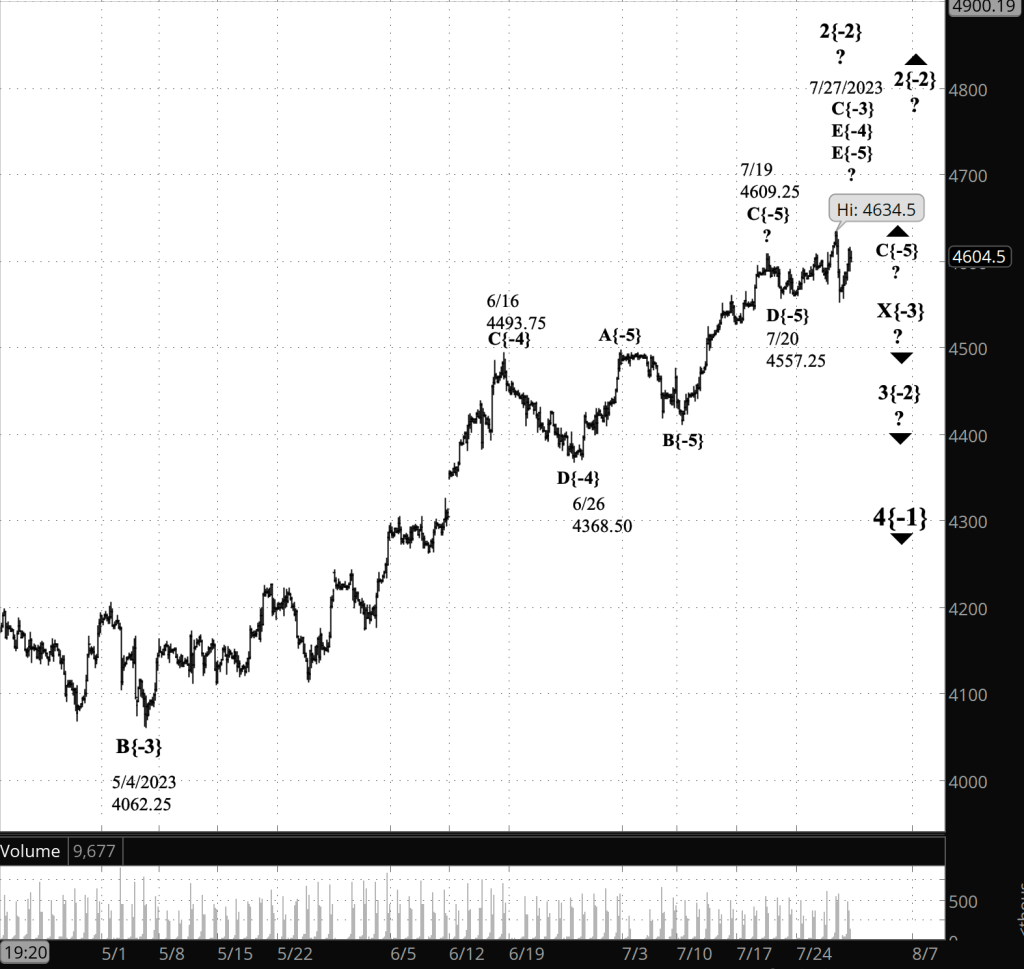
[S&P 500 E-mini futures at 3:30 p.m., 160-minute bars, with volume]
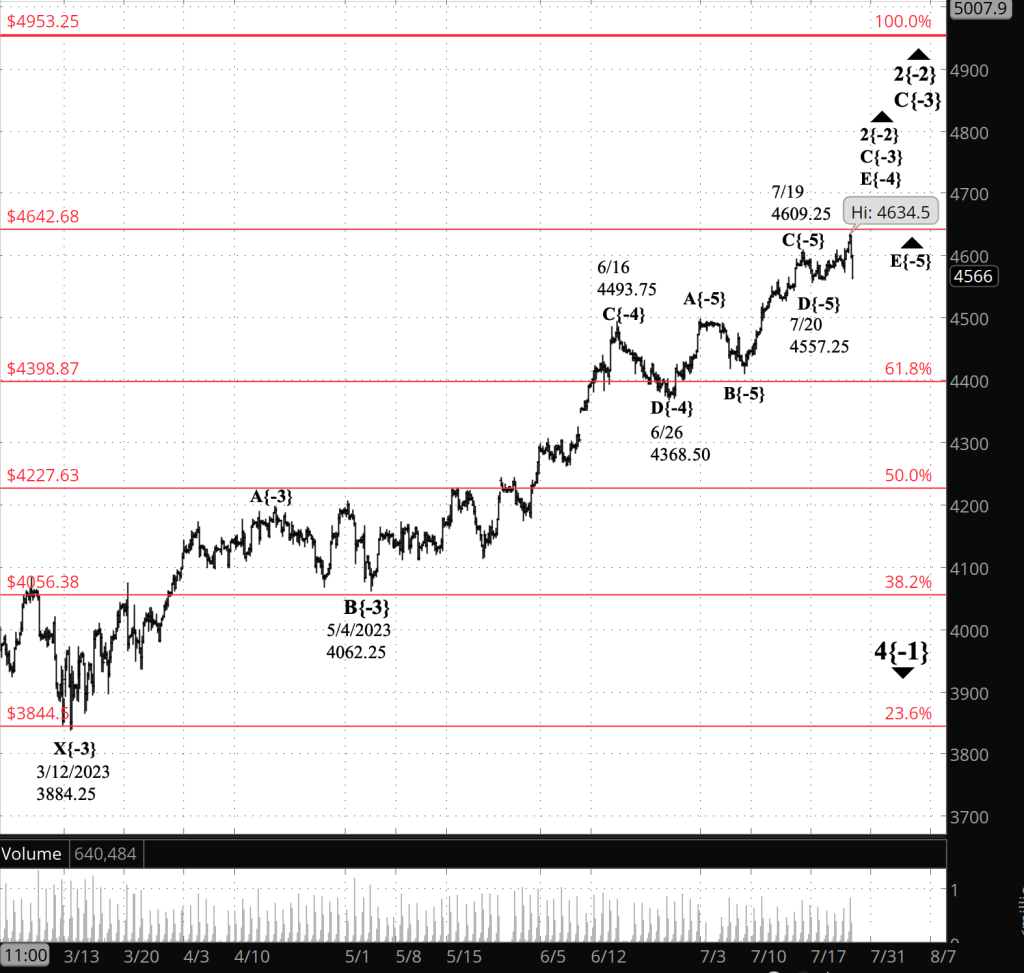
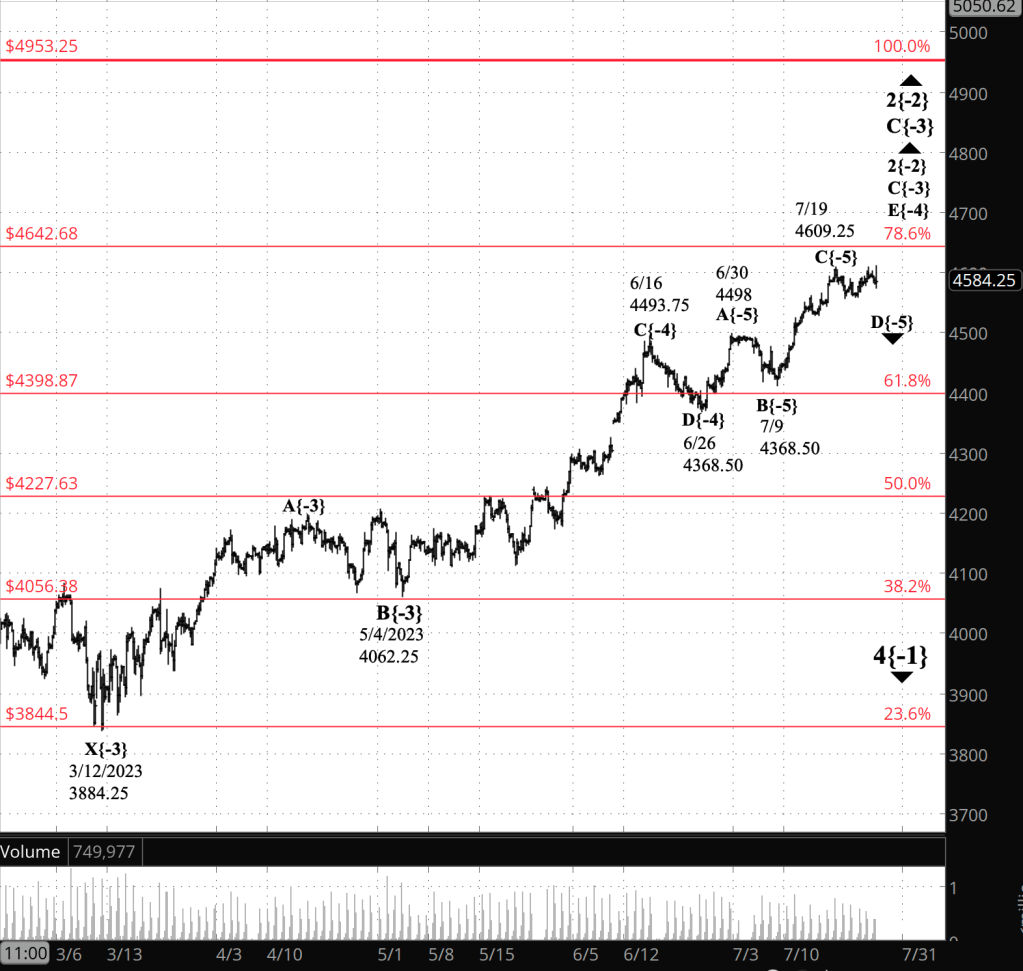
What does Elliott wave theory say? This is a repeat of yesterday’s post, for comparison with the ambiguities listed above.
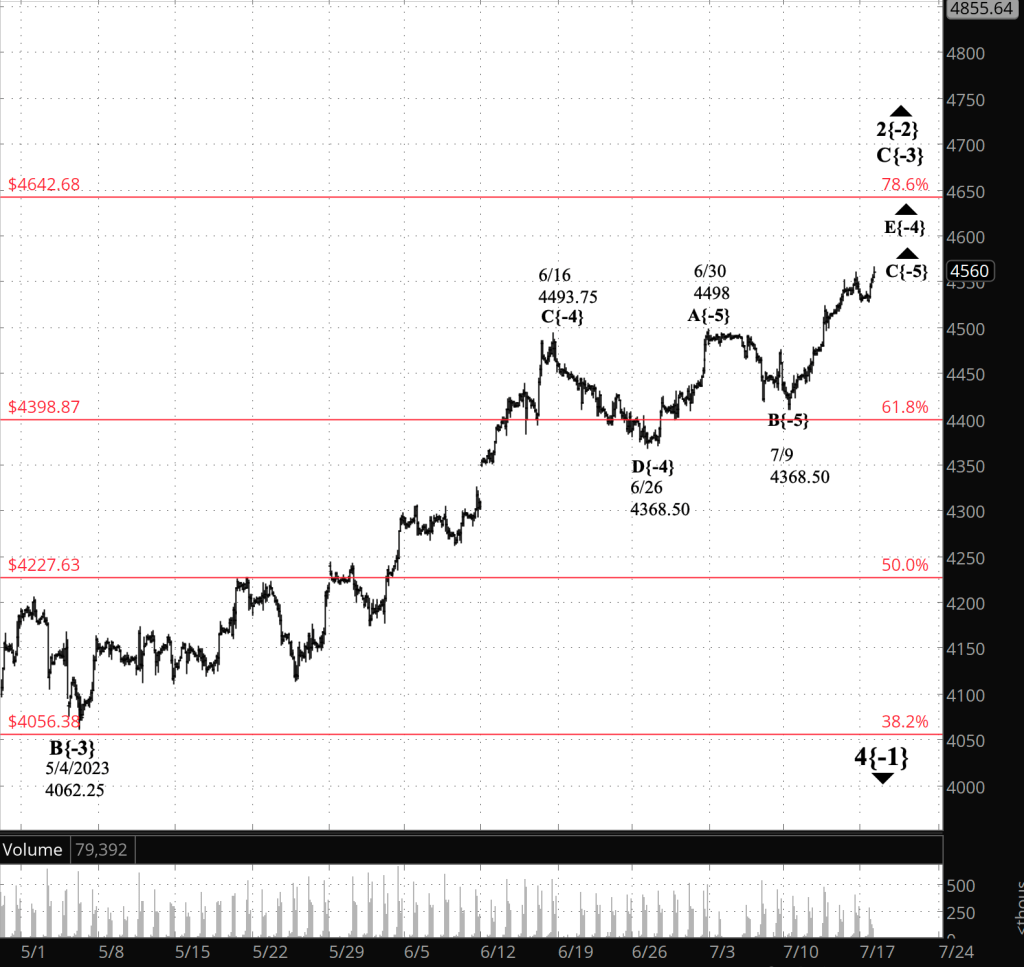
Here are the waves that underlie the analysis, as of the morning of July 27.
Principal analysis:
- An upward correction, a Zigzag, wave 2{-2}, began on October 13, 2022 and is underway.
- The upward correction, wave 2{-2}, is taking a compound form, which can contain up to three corrective patterns.
- The correction is in its second corrective pattern, which is in wave C{-3}, its final wave.
- The end of the present wave C{-3} could also be the end of the wave 2{-2} correction if the compound structure contains two subwaves.
- Or the present corrective pattern could be followed by a declining connector, wave X{-3}, and then a third corrective pattern.
- Wave C{-3} will have five subwaves and is at wave E{-4}, the final subwave.
- Wave E{-4} is in its final of five subwaves, wave E{-5}.
- Wave 2{-2}, when complete, will be followed by a powerful downtrend, wave 3{-2}.
- Under the rules of Elliott wave analysis, wave 2{-2} cannot move beyond the beginning of wave 1{-2}, which was the January 4, 2022 peak at 4953.25
Alternative analysis:
- Wave E{-4} is in its third of five subwaves, wave C{-5}, a rising wave that will be followed by an downward movement and then a final rise to completion.
We Are Here.
These are the waves currently in progress under my analysis. Each line on the list shows the wave number, with the subscript in curly brackets, the traditional degree name, the starting date, the starting price of the S&P 500 E-mini futures, and the direction of the wave.
- S&P 500 Index:
- 5{+3} Supercycle, 7/8/1932, 4.40 (up)
- 5{+2} Cycle, 12/9/1974, 60.96 (up)
- 5{+1} Primary, 3/6/2009, 666.79 (up)
- 5{0} Intermediate, 12/26/2018, 2346.58 (up)
- S&P 500 Futures and index:
- 4{-1} Minor, 1/4/2022, 4953.25 (down) (futures), 4818.62 (down) (index)
- S&P 500 Futures:
- 2{-2} Minute, 10/13/2022, 3502 (up) — Maybe.
- Or possibly, 3{-2} Minute, 7/27/2023 (down)
Learning and other resources. Elliott wave analysis provides context, not prophecy. As the 20th century semanticist Alfred Korzybski put it in his book Science and Sanity (1933), “The map is not the territory … The only usefulness of a map depends on similarity of structure between the empirical world and the map.” And I would add, in the ever-changing markets, we can judge that similarity of structure only after the fact.
See the menu page Analytical Methods for a rundown on where to go for information on Elliott wave analysis.
By Tim Bovee, Portland, Oregon, July 28, 2023
Disclaimer
Tim Bovee, Private Trader tracks the analysis and trades of a private trader for his own accounts. Nothing in this blog constitutes a recommendation to buy or sell stocks, options or any other financial instrument. The only purpose of this blog is to provide education and entertainment.
No trader is ever 100 percent successful in his or her trades. Trading in the stock and option markets is risky and uncertain. Each trader must make trading decisions for his or her own account, and take responsibility for the consequences.
License
All content on Tim Bovee, Private Trader by Timothy K. Bovee is licensed under a Creative Commons Attribution-ShareAlike 4.0 International License.
Based on a work at www.timbovee.com.


You must be logged in to post a comment.