Options Trades 12/15/2023: SPY

Symbols traded today: SPY (0DTE)

I’ve entered a short Iron Fly position on SPY. I had intended that it expire on Monday, December 18, but I erred and it turned out to be a 0DTE trade that expired after the close on the date of entry, for a loss.

SPY short Iron Fly

LOT:20ENTRY DATE:12/15/2023
EXIT DATE:12/15/2023
DAYS HELD:1

Entry and Exit

METRICCREDITDEBITCHANGECHANGE %ANNUALIZED CHANGE %
Options premium$ 1.10$ 1.20$ (0.10)-8.3%-3025%
METRICENTRYEXITCHANGECHANGE %ANNUALIZED CHANGE %
Stock price$ 468.48$ 468.89$ (0.41)0.09%32%
Impllied Volatility Rate4.05.91.9
Days to expiration00

The structure of the position

STRUCTURESTRIKEODDS EXPIRE OTMDELTA
Calls
Long471.0097.0%4
Break-even470.1075.5%25
Short469.0054.0%46
Puts
Short469.0046.0%55
Break-even468.1070.0%31
Long467.0094.0%7

Risk and Reward

Per contract:
Reward110.00
Risk90.00
R/R Ratio (n:1)0.8

By Tim Bovee, Portland, Oregon, December 15-16, 2023

Disclaimer

Tim Bovee, Private Trader tracks the analysis and trades of a private trader for his own accounts. Nothing in this blog constitutes a recommendation to buy or sell stocks, options or any other financial instrument. The only purpose of this blog is to provide education and entertainment.

No trader is ever 100 percent successful in his or her trades. Trading in the stock and option markets is risky and uncertain. Each trader must make trading decisions for his or her own account, and take responsibility for the consequences.

License
Creative Commons License

All content on Tim Bovee, Private Trader by Timothy K. Bovee is licensed under a Creative Commons Attribution-ShareAlike 4.0 International License.

Based on a work at www.timbovee.com.

Trader’s Notebook

3:30 p.m. New York time

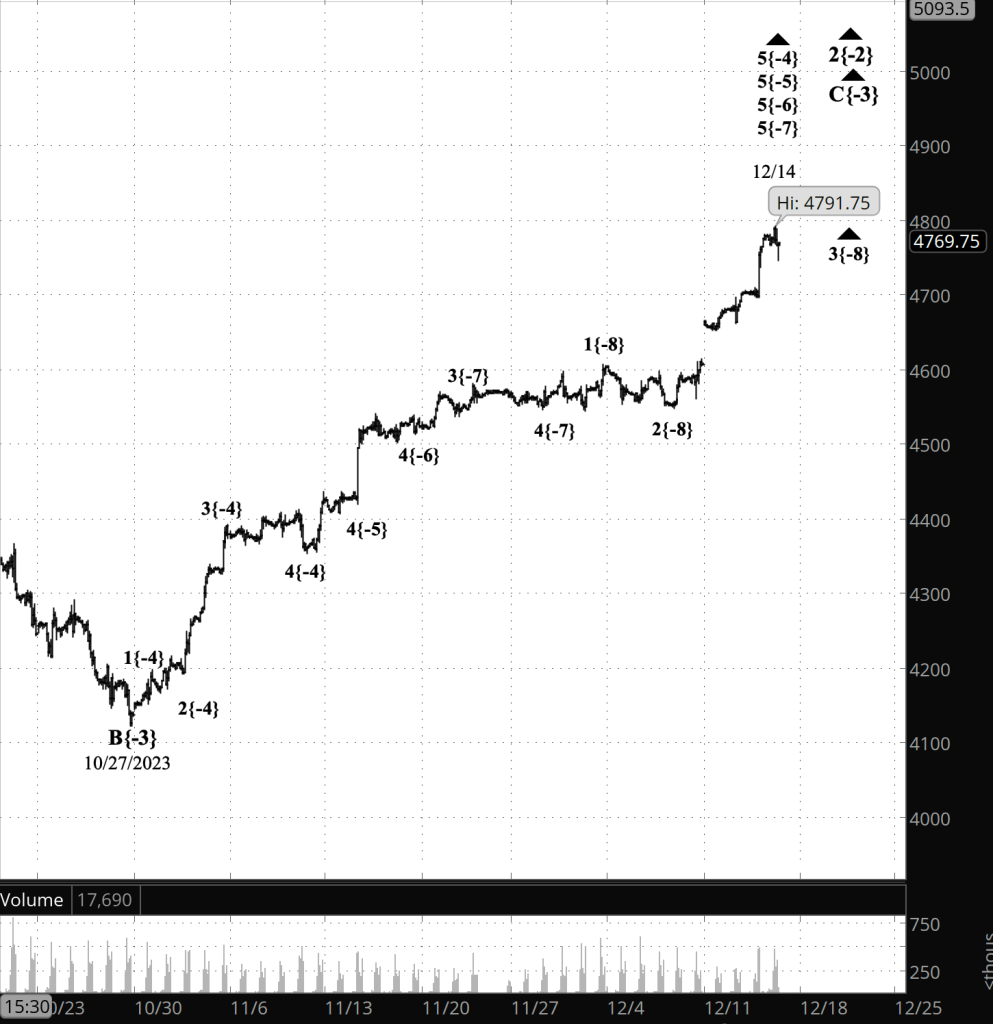
Half an hour before the closing bell. The S&P 500 futures continued their decline during the session, reaching the 4750s. The low since the December 14 peak was 4746.25, and if the price drops below that level then I’ll most likely change the chart labelling to show the low-degree 3rd wave I’ve been tracking to have ended at the peak, and to show that the 4th wave is underway. All of this happening with the final subwave, wave C, within the 2nd wave upward correction that began in October 2022.

I’ve updated the chart.

2:10 p.m. New York time

Trades. I’ve exited a 1DTE Iron Fly position on XSP for a 9.9% profit and entered a 3DTE Iron Fly position on SPY, which expires on Monday, with a 0.8:1 risk/reward ratio.

I’ve updated the XSP trade analysis with full results of the exit, and have posted a trade analysis of the SPY entry.

9:35 a.m. New York time

What’s happening now? The S&P 500 E-mini futures climbed from the 4760s to the 4780s overnight and the returned to the 4760s, falling rapidly after New York Federal Reserve Chair John Williams, in an interview with CNBC, said, “We aren’t really talking about rate cuts right now”, continuing that the focus is on the question, “have we gotten monetary policy to sufficiently restrictive stance in order to ensure the inflation comes back down to 2%?”

The comment coincided with the release of a survey showing business declining in New York state. The price remained below the December 14 peak of the upward correction, 4791.25.

What does it mean? The 2nd-wave upward correction that began in October 2022 continues and is working through its end game.

The smallest wave I’m tracking, six degrees below the wave 2 correction, is either a 3rd wave or a 4th wave. The failure of the price to break through the December 14 peak increases the likelihood that the 4th of five waves has begun. Wave 4 is a downward correction and will be followed by a 5th-wave rise that will cascade up the fractal structure and end the third subwave of the correction, wave C, and possibly the correction itself.

I say “possibly” because the correction will end with the present rise only if wave takes a simple form, containing one corrective pattern. Most wave 2s take that form, but a few will take a complex form, containing two or three corrective patterns. Which form will this correction take? We’ll have to wait and see.

Despite the uncertainty — wave 3 or wave 4? — I’ve chosen to retain the 3rd-wave labelling on the chart. The two possibilities are of nearly equal likelihood, and my habit it is keep the labeling as it is unless I have clear evidence to back up a change.

So far, the present low-degree structure lacks clarity.

What are the alternatives? t’s possible that the subwaves within wave C should be lower down in the fractal structure than I’ve labeled them. If that proves to be the case, then wave C is further from completion than the principal analysis would have it.

[S&P 500 E-mini futures at 3:30 pss.m., 105-minute bars, with volume]

What does Elliott wave theory say? Here are the waves that underly the analyses.

Principal Analysis:

  • Principal Analysis:
  • A downtrend, wave 4{-1}, began on January 4, 2022 and is underway.
  • Within wave 4{-1}, an upward correction, wave 2{-2}, began on October 13, 2022.
  • The third wave of the correction, wave C{-3}, is underway.
  • Wave C{-3} has reached its 5th and final subwave, wave 5{-4} and a series of smaller 5th waves, down to wave 5{-7}.
  • Wave 5{-7} internally contains two possiblilities of nearly equal likelihood. Either…
    • … the middle subwave, rising wave 3{-8}, is underway, or…
    • … the next-to-the-last subwave, a 4{-8}, a downward correction, began with the December 14 high.

We Are Here.

These are the waves currently in progress under my principal analysis. Each line on the list shows the wave number, with the subscript in curly brackets, the traditional degree name, the starting date, the starting price of the S&P 500 E-mini futures, and the direction of the wave.

  • S&P 500 Index:
  • 5{+3} Supercycle, 7/8/1932, 4.40 (up)
  • 5{+2} Cycle, 12/9/1974, 60.96 (up)
  • 5{+1} Primary, 3/6/2009, 666.79 (up)
  • 5{0} Intermediate, 12/26/2018, 2346.58 (up)
  • S&P 500 Futures and index:
  • 4{-1} Minor, 1/4/2022, 4953.25 (down) (futures), 4818.62 (down) (index)
  • S&P 500 Futures:
  • 2{-2} Minute, 10/13/2022, 3491.58 (up)
  • C{-3} Minuette, 10/27/2023, 4122.25 (up)

Reading the chart. Price movements — waves – – in Elliott wave analysis are labeled with numbers within trending waves and letters with corrective waves. The subscripts — numbers in curly brackets — designate the wave’s degree, which, in Elliott wave analysis, means the relative position of a wave within the larger and smaller structures that make up the chart. R.N. Elliott, who in the 1930s developed the form of analysis that bears his name, viewed the chart as a complex structure of smaller waves nested within larger waves, which in turn are nested within still larger waves. In mathematics it’s called a fractal structure, where at every scale the pattern is similar to the others.

Learning and other resources. Elliott wave analysis provides context, not prophecy. As the 20th century semanticist Alfred Korzybski put it in his book Science and Sanity (1933), “The map is not the territory … The only usefulness of a map depends on similarity of structure between the empirical world and the map.” And I would add, in the ever-changing markets, we can judge that similarity of structure only after the fact.

See the menu page Analytical Methods for a rundown on where to go for information on Elliott wave analysis.

By Tim Bovee, Portland, Oregon, December 15, 2023

Disclaimer

Tim Bovee, Private Trader tracks the analysis and trades of a private trader for his own accounts. Nothing in this blog constitutes a recommendation to buy or sell stocks, options or any other financial instrument. The only purpose of this blog is to provide education and entertainment.

No trader is ever 100 percent successful in his or her trades. Trading in the stock and option markets is risky and uncertain. Each trader must make trading decisions for his or her own account, and take responsibility for the consequences.

License
Creative Commons License

All content on Tim Bovee, Private Trader by Timothy K. Bovee is licensed under a Creative Commons Attribution-ShareAlike 4.0 International License.

Based on a work at www.timbovee.com.
Options Trades 12/14/2023: XSP

Symbols traded: XSP

I’ve entered a short Iron Fly position on XSP, one day prior to expiration (1DTE), and exitred on expiration day for a 9.9% profit.

XSP short Iron Fly

LOT:1ENTRY DATE:12/14/2023
EXIT DATE:12/15/2023
DAYS HELD:1

Entry and Exit

METRICCREDITDEBITCHANGECHANGE %ANNUALIZED CHANGE %
Options premium$ 2.00$ 1.82$ 0.189.9%3590%
METRICENTRYEXITCHANGECHANGE %ANNUALIZED CHANGE %
Stock price$ 471.30$ 470.75$ 0.55-0.12%-43%
Impllied Volatility Rate3.13.10.0
Days to expiration10

The structure of the position

STRUCTURESTRIKEODDS EXPIRE OTMDELTA
Calls
Long474.0077.0%23
Break-even473.0063.5%37
Short471.0050.0%51
Puts
Short471.0050.0%49
Break-even470.0064.5%35
Long468.0079.0%21

Risk and Reward

Per contract:
Reward200.00
Risk100.00
R/R Ratio (n:1)0.5

By Tim Bovee, Portland, Oregon, December 14, 2023

Disclaimer

Tim Bovee, Private Trader tracks the analysis and trades of a private trader for his own accounts. Nothing in this blog constitutes a recommendation to buy or sell stocks, options or any other financial instrument. The only purpose of this blog is to provide education and entertainment.

No trader is ever 100 percent successful in his or her trades. Trading in the stock and option markets is risky and uncertain. Each trader must make trading decisions for his or her own account, and take responsibility for the consequences.

License
Creative Commons License

All content on Tim Bovee, Private Trader by Timothy K. Bovee is licensed under a Creative Commons Attribution-ShareAlike 4.0 International License.

Based on a work at www.timbovee.com.

Trader’s Notebook

3:30 p.m. New York time

Half an hour before the closing bell. The S&P 500 futures reached a session peak of 4791.75 and fell to a session low of 4746.25.

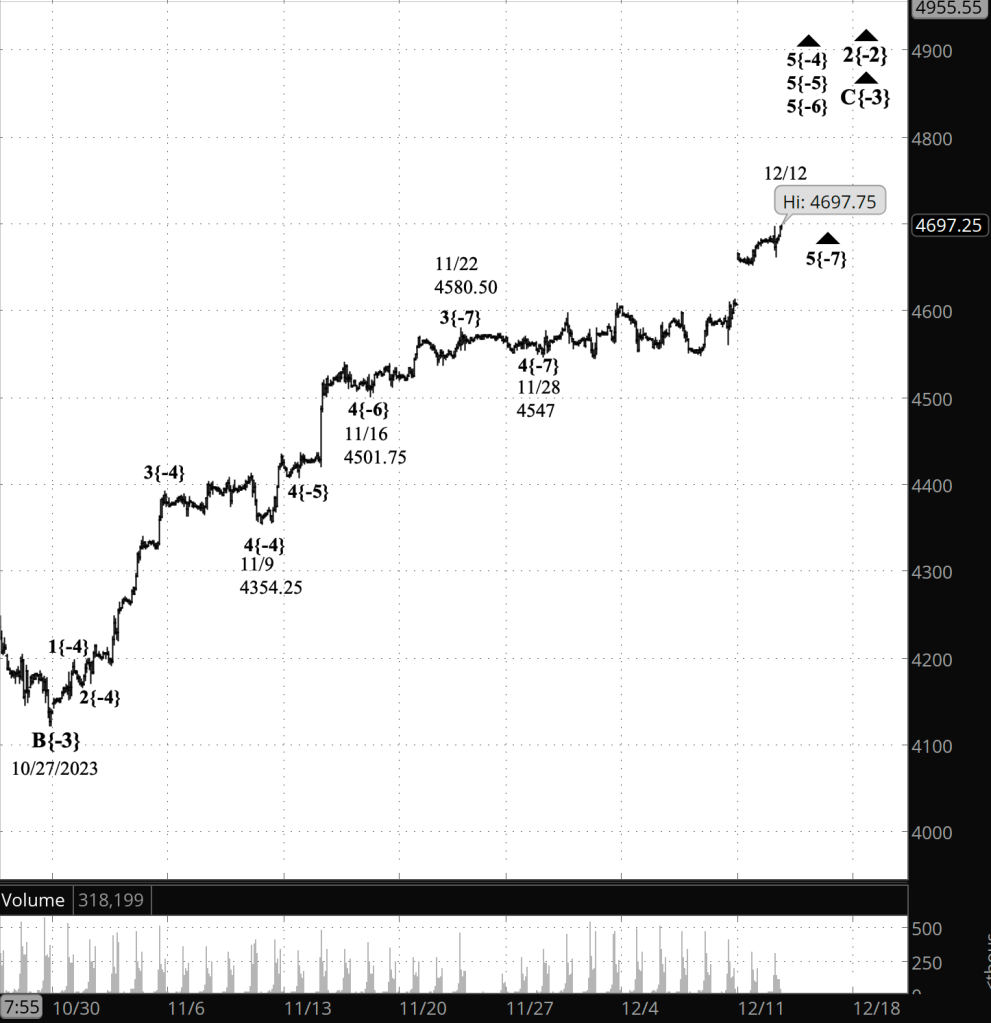
The decline so far is in its 4th wave and is a classic trend structure, with the 3rd wave being the longest wave so far. For the moment I’m staying with this morning’s announcement, that the parent of the session decline, a rising 3rd wave, is not yet complete. I’d like to see more of how that 4th wave shapes up before changing the principal analysis.

I’ve updated the chart.

1:35 p.m. New York time

Trades. I’ve exited a short Iron Fly position on SPY, on expiration day for a 24.1% loss and have updated the trade analysis with details.

I’ve entered a short Iron Fly position on XSP — a lower-priced version of SPX, the S&P 500 Index — with the intent of exiting the next day, when it expires. I’ve posted an analysis of the trade.

9:35 a.m. New York time

What’s happening now? The S&P 500 E-mini futures remained within a narrow range during much of overnight trading, pushing higher as the opening bell approached.

What does it mean? The 2nd-wave upward correction that began on October 13, 2022 continues to work through its final subwave, wave C.

At the smallest degree in the chart’s Elliott Wave structure, five levels small than the C wave, a wave 3 uptrend is in progress. It will be followed by a 4th wave downward correction and a 5th wave push to the upside that will complete the small-degree rise, the series of increasingly larger 5th waves up to the C wave, the C wave itself, and the 2nd wave upward correction, if it takes a simple form containing a single corrective pattern. If it takes a comple form, with two or three correvtive patterns, then it will be awhile longer before the correction reaches its end.

What are the alternatives? It’s possible that the subwaves within wave C should be lower down in the fractal structure than I’ve labeled them. If that proves to be the case, then wave C is further from completion than the principal analysis would have it.

[S&P 500 E-mini futures at 3:30 p.m., 105-minute bars, with volume]

What does Elliott wave theory say? Here are the waves that underly the analyses.

Principal Analysis:

  • A downtrend, wave 4{-1}, began on January 4, 2022 and is underway.
  • Within wave 4{-1}, an upward correction, wave 2{-2}, began on October 13, 2022.
  • The third wave of the correction, wave C{-3}, is underway.
  • Wave C{-3} has reached its 5th and final subwave, wave 5{-4} and a series of smaller 5th waves, down to wave 5{-7}.
  • Wave 5{-7} is in its middle subwave, rising wave 3{-8}.

We Are Here.

These are the waves currently in progress under my principal analysis. Each line on the list shows the wave number, with the subscript in curly brackets, the traditional degree name, the starting date, the starting price of the S&P 500 E-mini futures, and the direction of the wave.

  • S&P 500 Index:
  • 5{+3} Supercycle, 7/8/1932, 4.40 (up)
  • 5{+2} Cycle, 12/9/1974, 60.96 (up)
  • 5{+1} Primary, 3/6/2009, 666.79 (up)
  • 5{0} Intermediate, 12/26/2018, 2346.58 (up)
  • S&P 500 Futures and index:
  • 4{-1} Minor, 1/4/2022, 4953.25 (down) (futures), 4818.62 (down) (index)
  • S&P 500 Futures:
  • 2{-2} Minute, 10/13/2022, 3491.58 (up)
  • C{-3} Minuette, 10/27/2023, 4122.25 (up)

Reading the chart. Price movements — waves – – in Elliott wave analysis are labeled with numbers within trending waves and letters with corrective waves. The subscripts — numbers in curly brackets — designate the wave’s degree, which, in Elliott wave analysis, means the relative position of a wave within the larger and smaller structures that make up the chart. R.N. Elliott, who in the 1930s developed the form of analysis that bears his name, viewed the chart as a complex structure of smaller waves nested within larger waves, which in turn are nested within still larger waves. In mathematics it’s called a fractal structure, where at every scale the pattern is similar to the others.

Learning and other resources. Elliott wave analysis provides context, not prophecy. As the 20th century semanticist Alfred Korzybski put it in his book Science and Sanity (1933), “The map is not the territory … The only usefulness of a map depends on similarity of structure between the empirical world and the map.” And I would add, in the ever-changing markets, we can judge that similarity of structure only after the fact.

See the menu page Analytical Methods for a rundown on where to go for information on Elliott wave analysis.

By Tim Bovee, Portland, Oregon, December 14, 2023

Disclaimer

Tim Bovee, Private Trader tracks the analysis and trades of a private trader for his own accounts. Nothing in this blog constitutes a recommendation to buy or sell stocks, options or any other financial instrument. The only purpose of this blog is to provide education and entertainment.

No trader is ever 100 percent successful in his or her trades. Trading in the stock and option markets is risky and uncertain. Each trader must make trading decisions for his or her own account, and take responsibility for the consequences.

License
Creative Commons License

All content on Tim Bovee, Private Trader by Timothy K. Bovee is licensed under a Creative Commons Attribution-ShareAlike 4.0 International License.

Based on a work at www.timbovee.com.
Options Trades 12/13/2023: SPY

I entered a short Iron Condor position on SPY on December13, one day before expiration, and exited on expiration day for a 24.1% loss after the price of the underlying stock opened higher following the release, pre-opening, of several economic reports that usually don’t make a big splash.

The lesson of the loss may well be more cautious of 1DTE trades where there are pre-opening economic releases.

SPY short Iron Condor

LOT:19ENTRY DATE:12/13/2023
EXIT DATE:12/14/2023
DAYS HELD:1

Entry and Exit

METRICCREDITDEBITCHANGECHANGE %ANNUALIZED CHANGE %
Options premium$ 1.95$ 2.57$ (0.62)-24.1%-8757%
METRICENTRYEXITCHANGECHANGE %ANNUALIZED CHANGE %
Stock price$ 470.23$ 473.27$ (3.04)0.65%236%
Impllied Volatility Rate2.11.3-0.8
Days to expiration10

Position Structure

STRUCTURESTRIKEODDS EXPIRE OTMDELTA
Calls
Long472.0071.0%31
Break-even470.9557.0%45.5
Short469.0043.0%60
Puts
Short469.0039.0%69
Break-even468.9531.0%74
Long467.0023.0%79

Risk and Reward

Per contract:
Reward195.00
Risk55.00
R/R Ratio (n:1)0.3

By Tim Bovee, Portland, Oregon, December 14, 2023

Disclaimer

Tim Bovee, Private Trader tracks the analysis and trades of a private trader for his own accounts. Nothing in this blog constitutes a recommendation to buy or sell stocks, options or any other financial instrument. The only purpose of this blog is to provide education and entertainment.

No trader is ever 100 percent successful in his or her trades. Trading in the stock and option markets is risky and uncertain. Each trader must make trading decisions for his or her own account, and take responsibility for the consequences.

License
Creative Commons License

All content on Tim Bovee, Private Trader by Timothy K. Bovee is licensed under a Creative Commons Attribution-ShareAlike 4.0 International License.

Based on a work at www.timbovee.com.

Trader’s Notebook

3:30 p.m. New York time

Half an hour before the closing bell. The S&P 500 futures rose sharply after the FOMC said it would keep interest rates unchanged and rose again when Fed Chair Powell began his news conference half an hour later.

This morning’s analysis is unchanged: The first subwave, wave A, within the 2nd wave upward correction is nearing its end. Four degrees smaller than wave A is a low-degree 5th and final wave, and that small wave is in its 3rd wave.

I’ve updated the chart.

Trade. I’ve entered a short Iron Condor position on SPY, one day before expiration, and have posted an analysis of the trade.

9:35 a.m. New York time

What’s happening now? The S&P 500 E-mini futures traded sideways during most of the night, reaching above 4700 to a new high within the ongoing upward correction after the Producer Price Index report was published. The Federal Open Market Committee will also published its statement today, at 2 p.m. New York time, perhaps providing some clues regarding the FOMC’s next move in setting interest rates. The Federal Reserve chair, Jerome Powell, will hold a news conference at 2:30 p.m.

What does it mean? The correction, wave 2[-2], began on October 13, 2022 and is presently in its final subwave, wave C, which in turn is in a series of increasingly smaller subwaves, which are 5th waves stretching down four degrees in the fractal structure of the chart.

When the smallest of those 5th waves is complete, the event will cascade up the larger waves to end the C wave and, most likely, the correction. That’s if wave 2 takes a simple form, with one corrective pattern. If it takes a complex form, with two or three corrective patterns, then it will expand the correction beyond what we would normally expect.

What are the alternatives? It’s possible that the subwaves within wave C should be lower down in the fractal structure than I’ve labeled them.

[S&P 500 E-mini futures at 3:30 p.m., 85-minute bars, with volume]

What does Elliott wave theory say? Here are the waves that underly the analyses.

Principal Analysis:

  • A downtrend, wave 4{-1}, began on January 4, 2022 and is underway.
  • Within wave 4{-1}, an upward correction, wave 2{-2}, began on October 13, 2022.
  • The third wave of the correction, wave C{-3}, is underway.
  • Wave C{-3} has reached its 5th and final subwave, wave 5{-4} and a series of smaller 5th waves, down to wave 5{-7}.
  • When wave 5{-7} is complete, it will cascade up the fractal structure, also ending wave 5{-4} and its parent, wave C{-3} and possibly the upward corection, wave 2{-2}.

We Are Here.

These are the waves currently in progress under my principal analysis. Each line on the list shows the wave number, with the subscript in curly brackets, the traditional degree name, the starting date, the starting price of the S&P 500 E-mini futures, and the direction of the wave.

  • S&P 500 Index:
  • 5{+3} Supercycle, 7/8/1932, 4.40 (up)
  • 5{+2} Cycle, 12/9/1974, 60.96 (up)
  • 5{+1} Primary, 3/6/2009, 666.79 (up)
  • 5{0} Intermediate, 12/26/2018, 2346.58 (up)
  • S&P 500 Futures and index:
  • 4{-1} Minor, 1/4/2022, 4953.25 (down) (futures), 4818.62 (down) (index)
  • S&P 500 Futures:
  • 2{-2} Minute, 10/13/2022, 3491.58 (up)
  • C{-3} Minuette, 10/27/2023, 4122.25 (up)

Reading the chart. Price movements — waves – – in Elliott wave analysis are labeled with numbers within trending waves and letters with corrective waves. The subscripts — numbers in curly brackets — designate the wave’s degree, which, in Elliott wave analysis, means the relative position of a wave within the larger and smaller structures that make up the chart. R.N. Elliott, who in the 1930s developed the form of analysis that bears his name, viewed the chart as a complex structure of smaller waves nested within larger waves, which in turn are nested within still larger waves. In mathematics it’s called a fractal structure, where at every scale the pattern is similar to the others.

Learning and other resources. Elliott wave analysis provides context, not prophecy. As the 20th century semanticist Alfred Korzybski put it in his book Science and Sanity (1933), “The map is not the territory … The only usefulness of a map depends on similarity of structure between the empirical world and the map.” And I would add, in the ever-changing markets, we can judge that similarity of structure only after the fact.

See the menu page Analytical Methods for a rundown on where to go for information on Elliott wave analysis.

By Tim Bovee, Portland, Oregon, December 13, 2023

Disclaimer

Tim Bovee, Private Trader tracks the analysis and trades of a private trader for his own accounts. Nothing in this blog constitutes a recommendation to buy or sell stocks, options or any other financial instrument. The only purpose of this blog is to provide education and entertainment.

No trader is ever 100 percent successful in his or her trades. Trading in the stock and option markets is risky and uncertain. Each trader must make trading decisions for his or her own account, and take responsibility for the consequences.

License
Creative Commons License

All content on Tim Bovee, Private Trader by Timothy K. Bovee is licensed under a Creative Commons Attribution-ShareAlike 4.0 International License.

Based on a work at www.timbovee.com.
Trader’s Notebook

3:30 p.m. New York time

Half an hour before the closing bell. As the session neared its close, the S&P 500 futures rose back into the 4690s, close to the peak reached by the whipsaw after the latest inflation stats were published.

The final wave within the 2nd-wave upward correction that began on October 13, 2022 continues. This morning’s analysis is unchanged. I’ve updated the chart.

9:35 a.m. New York time

What’s happening now? The S&P 500 E-mini futures moved to a new high, 4696.25, within the present upward correction, as it whipsawed after the Consumer Price Index was published. After peaking, the price rapidly declined into the 4670s.

What does it mean? The 2nd-wave upward correction, which began on October 13, 2023, is in what will likely be its final subwave, wave C. If the correction takes a simple form, wave C will complete the correction, and a large, 3rd-wave downtrend will follow. If it takes a complex form, then the first corrective pattern within wave 2 will bd followed by one or two additional corrective patterns.

Under the rules of Elliott Wave Theory, a 2nd wave cannot move beyond the start of the preceding 1st wave, which in this case was 4953.25. So wave 2 has a lot of potential upside ahead of it. It’s present level is only slightly above the end of the correction’s initial subwave, wave C, at 4634.50.

A C wave is often about the same length as the preceding A wave. In this case, the A wave covered 1143 points. The C wave began from 4122.25. So if this tendency occurs in the present correction, wave C will come close to start of the preceding 1st wave, in the 4950s.

Also, wave A lasted for nine months. Wave C so far has been underway for two months. There will be ups and downs in its journey, but the net direction will be to the upside.

What are the alternatives? Assigning degrees to waves is often a guessing game. The subwaves within the C wave may be a several degrees lower than my labels would have it. They certainly are lower in the fractal structure if wave C lasts as long as the preceding wave A. If wave C moves more rapidly, then the present labeling is correct.

[S&P 500 E-mini futures at 3:30 p.m., 80-minute bars, with volume]

What does Elliott wave theory say? Here are the waves that underly the analyses.

Principal Analysis:

  • A downtrend, wave 4{-1}, began on January 4, 2022 and is underway.
  • Within wave 4{-1}, an upward correction, wave 2{-2}, began on October 13, 2022.
  • The third wave of the correction, wave C{-3}, is underway.
  • Wave C{-3} has reached its 5th and final subwave, wave 5{-4} and a series of smaller 5th waves, down to wave 5{-7}.
  • When wave 5{-7} is complete, it will cascade up the fractal structure, also ending wave 5{-4} and its parent, wave C{-3} and possibly the upward corection, wave 2{-2}.

We Are Here.

These are the waves currently in progress under my principal analysis. Each line on the list shows the wave number, with the subscript in curly brackets, the traditional degree name, the starting date, the starting price of the S&P 500 E-mini futures, and the direction of the wave.

  • S&P 500 Index:
  • 5{+3} Supercycle, 7/8/1932, 4.40 (up)
  • 5{+2} Cycle, 12/9/1974, 60.96 (up)
  • 5{+1} Primary, 3/6/2009, 666.79 (up)
  • 5{0} Intermediate, 12/26/2018, 2346.58 (up)
  • S&P 500 Futures and index:
  • 4{-1} Minor, 1/4/2022, 4953.25 (down) (futures), 4818.62 (down) (index)
  • S&P 500 Futures:
  • 2{-2} Minute, 10/13/2022, 3491.58 ()
  • C{-3} Minuette, 10/27/2023, 4122.25 (up)

Reading the chart. Price movements — waves – – in Elliott wave analysis are labeled with numbers within trending waves and letters with corrective waves. The subscripts — numbers in curly brackets — designate the wave’s degree, which, in Elliott wave analysis, means the relative position of a wave within the larger and smaller structures that make up the chart. R.N. Elliott, who in the 1930s developed the form of analysis that bears his name, viewed the chart as a complex structure of smaller waves nested within larger waves, which in turn are nested within still larger waves. In mathematics it’s called a fractal structure, where at every scale the pattern is similar to the others.

Learning and other resources. Elliott wave analysis provides context, not prophecy. As the 20th century semanticist Alfred Korzybski put it in his book Science and Sanity (1933), “The map is not the territory … The only usefulness of a map depends on similarity of structure between the empirical world and the map.” And I would add, in the ever-changing markets, we can judge that similarity of structure only after the fact.

See the menu page Analytical Methods for a rundown on where to go for information on Elliott wave analysis.

By Tim Bovee, Portland, Oregon, December 12, 2023

Disclaimer

Tim Bovee, Private Trader tracks the analysis and trades of a private trader for his own accounts. Nothing in this blog constitutes a recommendation to buy or sell stocks, options or any other financial instrument. The only purpose of this blog is to provide education and entertainment.

No trader is ever 100 percent successful in his or her trades. Trading in the stock and option markets is risky and uncertain. Each trader must make trading decisions for his or her own account, and take responsibility for the consequences.

License
Creative Commons License

All content on Tim Bovee, Private Trader by Timothy K. Bovee is licensed under a Creative Commons Attribution-ShareAlike 4.0 International License.

Based on a work at www.timbovee.com.
Trader’s Notebook

3:30 p.m. New York time

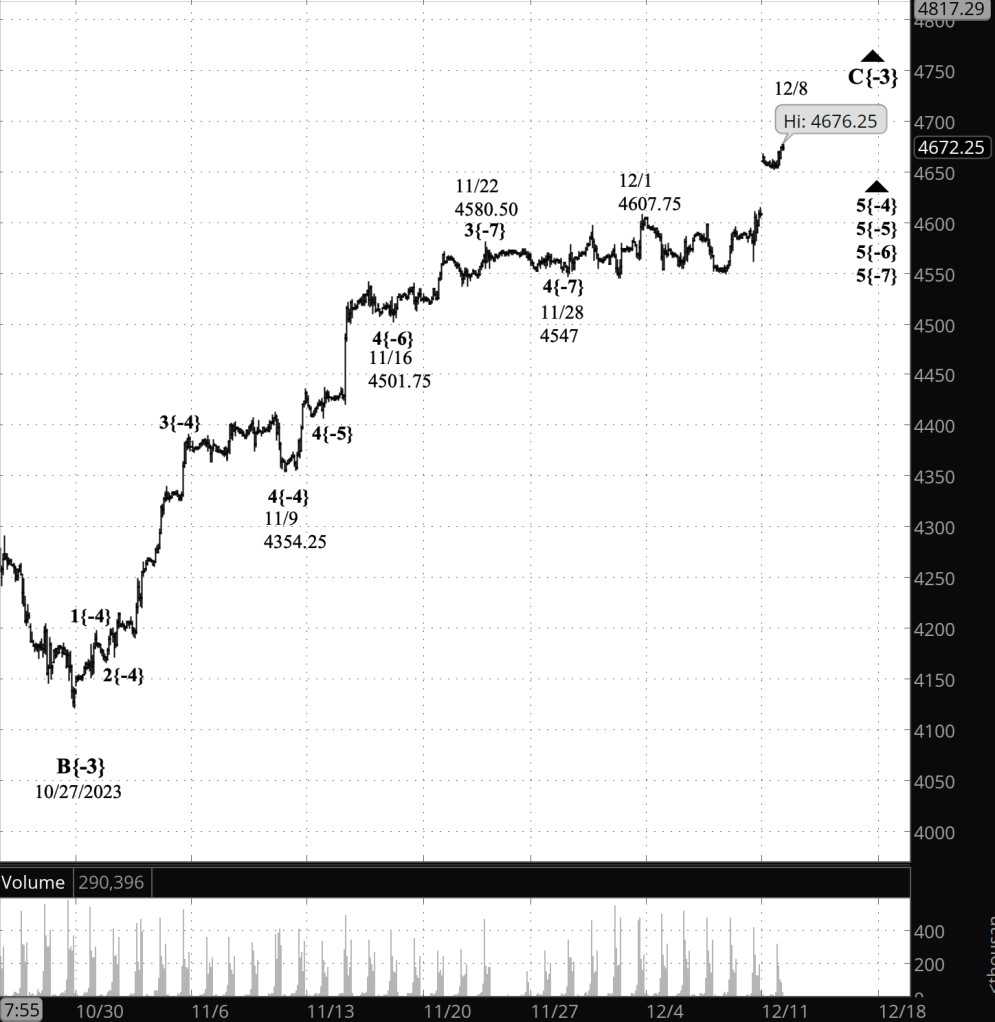
Half an hour before the closing bell. The S&P 500 futures rose from the 4650s to the 4670s during the session. No change in this morning’s analysis. Wave C within the 2nd-wave upward correction that began on October 13 continues. I’ve updated the lowest of the three charts and left others as they were during this morning’s analysis.

9:35 a.m. New York time

What’s happening now? The S&P 500 E-mini futures gapped higher when trading resumed overnight, opening at 4666.50, more than 30 points higher than a level that triggers a reanalysis of the chart.

S&P 500 E-mini futures at 8:30 a.m., 5-minute bars.

On the S&P 500 futures chart showing the gap, above, the trigger level for a reanalysis is shown as a red line.

What does it mean? The trigger point was 4634.50, the start of the 1st wave preceding what had been labeled a 4th-wave upward correction that began on October 27. A rule of Elliott Wave Theory says that a 4th wave never moves above the beginning of the preceding 1st wave. When it does happen, it’s time to reanalyze the chart so that the rule remains intact, so that the unthinkable never happened.

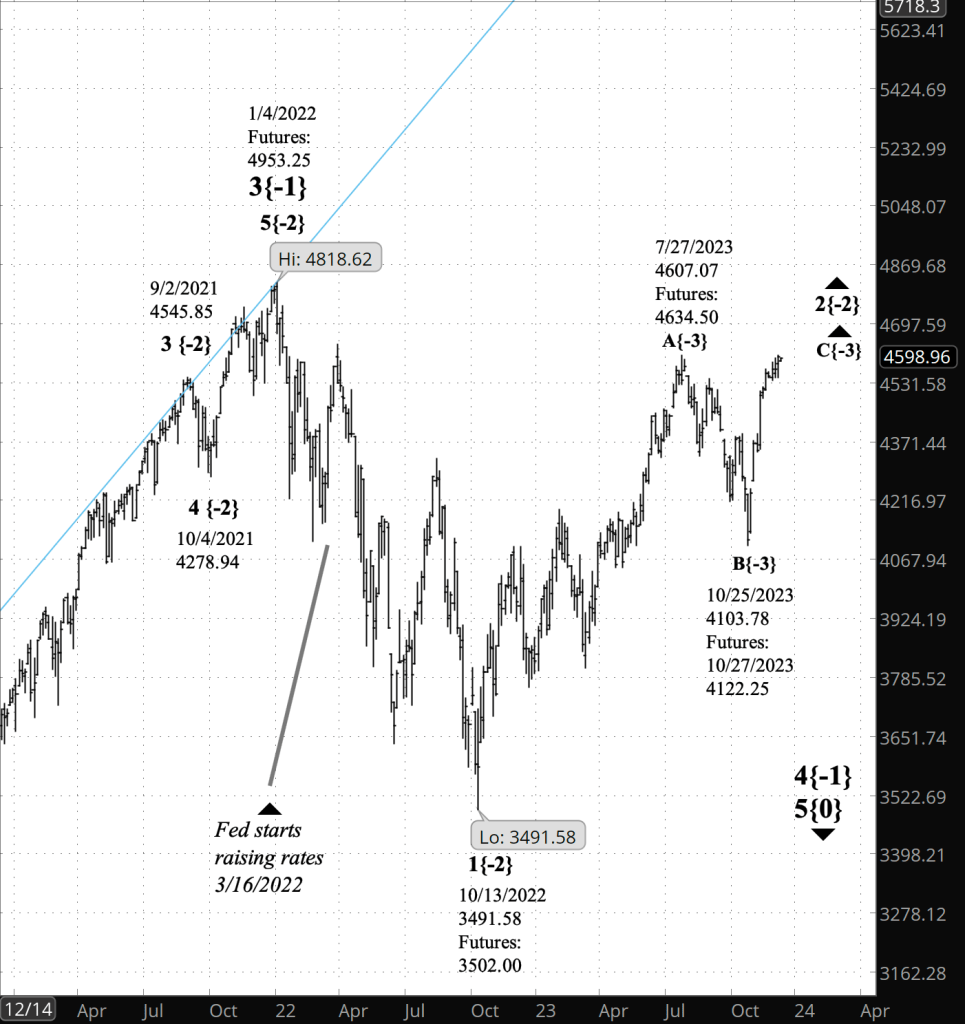
The chart below is the S&P 500 index starting with the January 4, 2022 peak. That peak marked the end of the 3rd wave within an expanding Diagonal Triangle that began in December 2018. The triangle’s 4th wave is now underway.

On the chart, the degree of each wave within the fractal structure is shown as a subscript in curly brackets and a number indicating the wave’s relationship to what Elliott called the Intermediate degree. I show that degree as {0} on the chart.

The upper boundary of the Diagonal Triangle’s price channel is shown as a blue line.

S&P 500 index at 9:30 a.m., 3-day bars.

Presently underway are wave 4{-1}, a subwave of wave 5{0}.

The chart labels show the index price and also the futures price, and date where it differs from the index.

The main change is within wave 2{-2}, a rising correction that began on October 13, 2022. The former analysis showed wave 2{-2} as having ended on July 27, 2023 and downtrending wave 3{-2} as having begun on that date.

Because of the Elliott Wave Theory rule violation, the July 27 turning point has been demoted to a subwave, wave A{-3}, of wave 2{-2}, followed by a descending wave B{-3}.

Wave C{-3}, the rising wave that began on October 25 on the index and October 27 on the futures, is now underway.

When wave C{-3} is complete, it will also be the end of the parent wave 2{-2} and the start of a powerful downtrend, wave 3{-2}, which will carry the price below 3491.58 on the index, 3502 on the futures, and almost certainly significantly below that level.

The present upward correction, wave 2{-2}, has five subwaves in its first segment, wave A{-3}, and also in its second segment, wave B{-3}. In a Zigzag or Flat corrective pattern, the B wave always has three subwaves. The present wave counts suggest that wave 2{-2} is taking the form of a triangle.

In any case, some corrections take a compound form, and if that happens, wave 2{-2} will contain two or three corrective patterns and would last longer than it will if it takes the form of a simple correction.

The next chart shows a detailed analysis of the ongoing C wave within the 2nd-wave correction.

[S&P 500 E-mini futures at 3:30 p.m., 85-minute bars, with volume]

What are the alternatives? None at present. They are certain to develop.

What does Elliott wave theory say? Here are the waves that underly the analyses.

Principal Analysis:

  • A downtrend, wave 4{-1}, began on January 4, 2022 and is underway.
  • Within wave 4{-1}, an upward correction, wave 2{-2}, began on October 13, 2022.
  • The third wave of the correction, wave C{-3}, is underway.
  • Wave C{-3} has reached its 5th and final subwave, wave 5{-4} and a series of smaller 5th waves, down to wave 5{-7}.
  • When wave 5{-7} is complete, it will cascade up the fractal structure, also ending wave 5{-4} and its parent, wave C{-3} and possibly the upward corection, wave 2{-2}.

We Are Here.

These are the waves currently in progress under my principal analysis. Each line on the list shows the wave number, with the subscript in curly brackets, the traditional degree name, the starting date, the starting price of the S&P 500 E-mini futures, and the direction of the wave.

  • S&P 500 Index:
  • 5{+3} Supercycle, 7/8/1932, 4.40 (up)
  • 5{+2} Cycle, 12/9/1974, 60.96 (up)
  • 5{+1} Primary, 3/6/2009, 666.79 (up)
  • 5{0} Intermediate, 12/26/2018, 2346.58 (up)
  • S&P 500 Futures and index:
  • 4{-1} Minor, 1/4/2022, 4953.25 (down) (futures), 4818.62 (down) (index)
  • S&P 500 Futures:
  • 2{-2} Minute, 10/13/2022, 3491.58 ()
  • C{-3} Minuette, 10/27/2023, 4122.25 (up)

Reading the chart. Price movements — waves – – in Elliott wave analysis are labeled with numbers within trending waves and letters with corrective waves. The subscripts — numbers in curly brackets — designate the wave’s degree, which, in Elliott wave analysis, means the relative position of a wave within the larger and smaller structures that make up the chart. R.N. Elliott, who in the 1930s developed the form of analysis that bears his name, viewed the chart as a complex structure of smaller waves nested within larger waves, which in turn are nested within still larger waves. In mathematics it’s called a fractal structure, where at every scale the pattern is similar to the others.

Learning and other resources. Elliott wave analysis provides context, not prophecy. As the 20th century semanticist Alfred Korzybski put it in his book Science and Sanity (1933), “The map is not the territory … The only usefulness of a map depends on similarity of structure between the empirical world and the map.” And I would add, in the ever-changing markets, we can judge that similarity of structure only after the fact.

See the menu page Analytical Methods for a rundown on where to go for information on Elliott wave analysis.

By Tim Bovee, Portland, Oregon, December 11, 2023

Disclaimer

Tim Bovee, Private Trader tracks the analysis and trades of a private trader for his own accounts. Nothing in this blog constitutes a recommendation to buy or sell stocks, options or any other financial instrument. The only purpose of this blog is to provide education and entertainment.

No trader is ever 100 percent successful in his or her trades. Trading in the stock and option markets is risky and uncertain. Each trader must make trading decisions for his or her own account, and take responsibility for the consequences.

License
Creative Commons License

All content on Tim Bovee, Private Trader by Timothy K. Bovee is licensed under a Creative Commons Attribution-ShareAlike 4.0 International License.

Based on a work at www.timbovee.com.

Trader’s Notebook

3:30 p.m. New York time

Half an hour before the closing bell. The S&P 500 futures reached a new high within the 4th-wave upward correction that began on October 27. The prior high was 4607.75, set on December 1. The new high is 4611.50 so far today.

The new high confirms that the initial subwave within the correction, wave A, is still underway, although it is nearing its end.

A reminder that under the rules of Elliott Wave Theory, a 4th wave can’t move above the starting point of the preceding 1st wave. So if the price moves above 4634.50, the analysis will be redone.

I’ve updated the chart.

9:35 a.m. New York time

What’s happening now? The S&P 500 E-mini futures whipsawed up to the 4590s and down to the 4560s after employment statistics for November were announced. The price then resumed to its sideways path near the lower end of the whipsaw, in the 4570s.

Unemployment dropped slightly to 3.7%. It as 3.9% a month earlier. The Sahm Rule, a sensitive signal of recession based on the unemployment rate, withdrew from 0.33 to 0.30. A reading of 0.50 signals that a recession is underway.

What does it mean? Economic news doesn’t drive the Elliott Waves on a price chart. It can, however, trigger the timing of transitions from one wave to another.

The overnight price fluctuations left undecided the ongoing conundrum of the chart’s Elliott Wave analysis of the 4th-wave upward correction that began on October 27: Did the correction’s initial subwave, wave A, end on December 1 at 4607.75 and the middle subwave, wave B begin, or is wave A still underway and wave B an expectation for the future?

For the moment I’m retaining the A-wave scenario on the chart — Wave A is still underway — where it has been since late November.

The low in overnight trading, slightly below the price at preceding closing bell, was 4548.75, still above the low of the small-degree rise that began on November 30 from 4544.75 I’ll consider switching to the wave B scenario.

If it rises above the December 1 high of 4607.75, then I’ll consider wave A to still be unambiguously underway.

In any case, no subwave of the wave 4 correction can move beyond the starting point of the preceding 1st wave, 4634.50. If it does move above that level, then I’ll scrap the entire analysis and analyze anew.

The smallest wave that I’m tracking on the chart is a rising low-degree 5th wave five levels below wave 4 in the fractal structure of the chart. When that low-degree wave is complete, it will also complete a series of increasingly larger 5th waves up three degrees, and the A wave a degree larger that contains them all.

See the “Reading the Chart” section below for an explanation of the fractal structure used in Elliott Wave Theory.

What are the alternatives? The two alternatives, the A-wave and B-wave scenarios, remain equally likely.

[S&P 500 E-mini futures at 3:30 p.m., 80-minute bars, with volume]

What does Elliott wave theory say? Here are the waves that underly the analyses.

Principal Analysis:

  • A downtrend, wave 3{-2}, began on July 27 and is underway.
  • Within wave 3{-2}, an upward correction, wave 4{-3}, began on October 27.
  • The initial wave of the correction, wave A{-4}, continues.
  • Wave A{-4} has reached its 5th and final subwave, wave 5{-5} and a series of smaller 5th waves, down to wave 5{-8}.
  • Within wave 5{-8}, declining wave 4{-9} is underway. It will be followed by rising wave 5{-9}.
  • When wave 5{-9} is complete, it will cascade up the fractal structure, also ending wave 5{-5} and its parent, wave A{-4}.

Alternative Analysis:

  • Wave A{-4} ended on December 1 and wave B{-4} is underway.

We Are Here.

These are the waves currently in progress under my principal analysis. Each line on the list shows the wave number, with the subscript in curly brackets, the traditional degree name, the starting date, the starting price of the S&P 500 E-mini futures, and the direction of the wave.

  • S&P 500 Index:
  • 5{+3} Supercycle, 7/8/1932, 4.40 (up)
  • 5{+2} Cycle, 12/9/1974, 60.96 (up)
  • 5{+1} Primary, 3/6/2009, 666.79 (up)
  • 5{0} Intermediate, 12/26/2018, 2346.58 (up)
  • S&P 500 Futures and index:
  • 4{-1} Minor, 1/4/2022, 4953.25 (down) (futures), 4818.62 (down) (index)
  • S&P 500 Futures:
  • 3{-2} Minute, 7/27/2023, 3502 (down)
  • 4{-3} Minuette, 10/27/2023, 4122.25 (up)
  • A{-4} Subminuette, 10/27/2023, 4122.25 (up)

Reading the chart. Price movements — waves – – in Elliott wave analysis are labeled with numbers within trending waves and letters with corrective waves. The subscripts — numbers in curly brackets — designate the wave’s degree, which, in Elliott wave analysis, means the relative position of a wave within the larger and smaller structures that make up the chart. R.N. Elliott, who in the 1930s developed the form of analysis that bears his name, viewed the chart as a complex structure of smaller waves nested within larger waves, which in turn are nested within still larger waves. In mathematics it’s called a fractal structure, where at every scale the pattern is similar to the others.

Learning and other resources. Elliott wave analysis provides context, not prophecy. As the 20th century semanticist Alfred Korzybski put it in his book Science and Sanity (1933), “The map is not the territory … The only usefulness of a map depends on similarity of structure between the empirical world and the map.” And I would add, in the ever-changing markets, we can judge that similarity of structure only after the fact.

See the menu page Analytical Methods for a rundown on where to go for information on Elliott wave analysis.

By Tim Bovee, Portland, Oregon, December 8, 2023

Disclaimer

Tim Bovee, Private Trader tracks the analysis and trades of a private trader for his own accounts. Nothing in this blog constitutes a recommendation to buy or sell stocks, options or any other financial instrument. The only purpose of this blog is to provide education and entertainment.

No trader is ever 100 percent successful in his or her trades. Trading in the stock and option markets is risky and uncertain. Each trader must make trading decisions for his or her own account, and take responsibility for the consequences.

License
Creative Commons License

All content on Tim Bovee, Private Trader by Timothy K. Bovee is licensed under a Creative Commons Attribution-ShareAlike 4.0 International License.

Based on a work at www.timbovee.com.
Trader’s Notebook

3:30 p.m. New York time

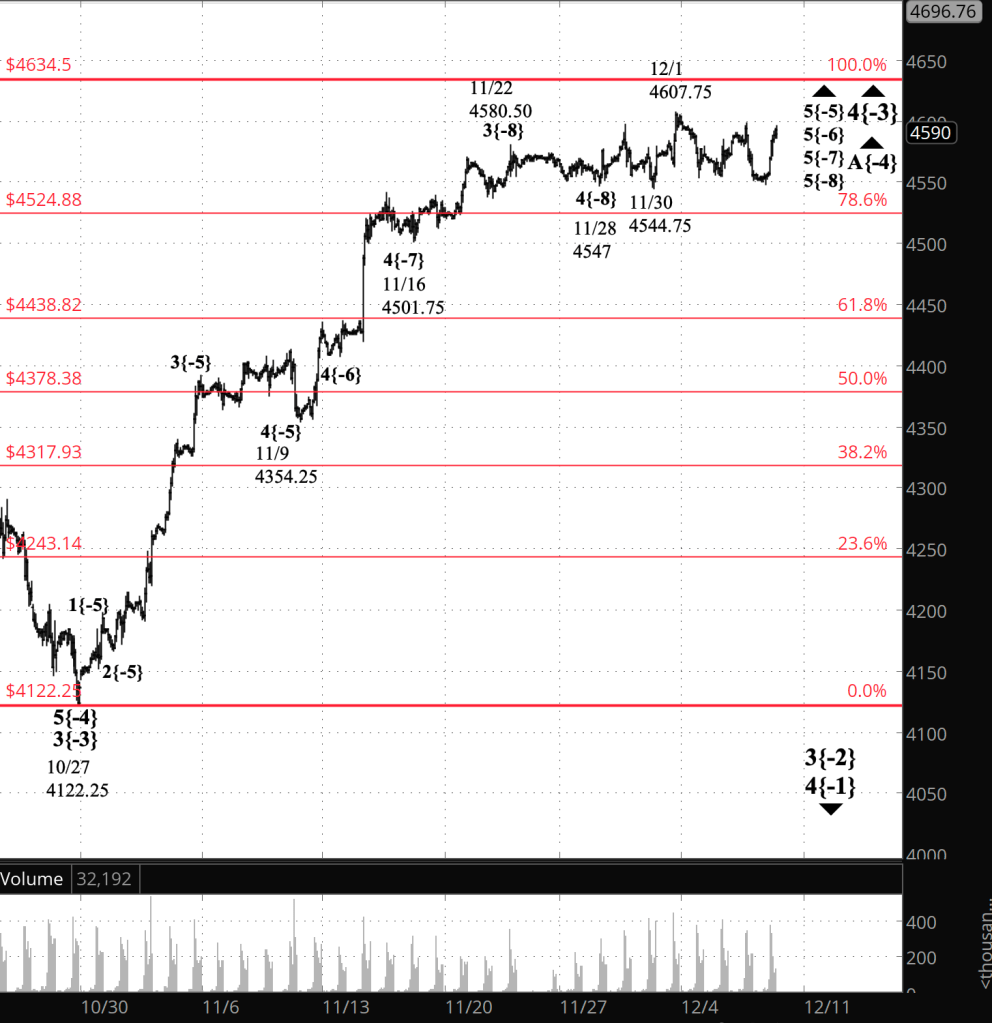
Half an hour before the closing bell. The S&P 500 futures continued to rise during the session, reaching the 4590s. Wave A continues, within the 4th wave upward correction that began on October 27. I’ve updated the chart.

1:05 p.m. New York time

Trades. I exited my two short Iron Fly options positions, one day after entry. SPY produced a 37.3% profit, and QQQ, an 18.6% profit. I’ve updated the trade analyses with results.

9:35 a.m. New York time

What’s happening now? The S&P 500 E-mini futures declined to the 4540s overnight, rising into the 4570s as the opening bell approached.

What does it mean? The overnight low, 4548.75, is the minimum price reached so far since the December 1 peak, slightly above the pre-peak low, 4544.75.

Since December 1, the price has completed two Elliott subwaves and is now on its third.

All of this is consistent with the first subwave — the A wave — of the upward correction that began on October 27 having ended on December 1, and the middle subwave — the B wave — having begun. The B wave will have three subwaves.

It’s also consistent with the A wave still being underway and nearing its end.

What are the alternatives? So, two alternatives of equal likelihood. I’m staying with the A wave scenario on the chart. A bit more of a decline and I’ll switch to the B-wave scenario.

[S&P 500 E-mini futures at 3:30 p.m., 80-minute bars, with volume]

What does Elliott wave theory say? Here are the waves that underly the analyses.

Principal Analysis:

  • A downtrend, wave 3{-2}, began on July 27 and is underway.
  • Within wave 3{-2}, an upward correction, wave 4{-3}, began on October 27.
  • The initial wave of the correction, wave A{-4}, continues.
  • Wave A{-4} has reached its 5th and final subwave, wave 5{-5} and a series of smaller 5th waves, down to wave 5{-8}.
  • Within wave 5{-8}, declining wave 4{-9} is underway. It will be followed by rising wave 5{-9}.
  • When wave 5{-9} is complete, it will cascade up the fractal structure, also ending wave 5{-5} and its parent, wave A{-4}.

Alternative Analysis:

  • Wave A{-4} ended on December 1 and wave B{-4} is underway.

We Are Here.

These are the waves currently in progress under my principal analysis. Each line on the list shows the wave number, with the subscript in curly brackets, the traditional degree name, the starting date, the starting price of the S&P 500 E-mini futures, and the direction of the wave.

  • S&P 500 Index:
  • 5{+3} Supercycle, 7/8/1932, 4.40 (up)
  • 5{+2} Cycle, 12/9/1974, 60.96 (up)
  • 5{+1} Primary, 3/6/2009, 666.79 (up)
  • 5{0} Intermediate, 12/26/2018, 2346.58 (up)
  • S&P 500 Futures and index:
  • 4{-1} Minor, 1/4/2022, 4953.25 (down) (futures), 4818.62 (down) (index)
  • S&P 500 Futures:
  • 3{-2} Minute, 7/27/2023, 3502 (down)
  • 4{-3} Minuette, 10/27/2023, 4122.25 (up)
  • A{-4} Subminuette, 10/27/2023, 4122.25 (up)

Reading the chart. Price movements — waves – – in Elliott wave analysis are labeled with numbers within trending waves and letters with corrective waves. The subscripts — numbers in curly brackets — designate the wave’s degree, which, in Elliott wave analysis, means the relative position of a wave within the larger and smaller structures that make up the chart. R.N. Elliott, who in the 1930s developed the form of analysis that bears his name, viewed the chart as a complex structure of smaller waves nested within larger waves, which in turn are nested within still larger waves. In mathematics it’s called a fractal structure, where at every scale the pattern is similar to the others.

Learning and other resources. Elliott wave analysis provides context, not prophecy. As the 20th century semanticist Alfred Korzybski put it in his book Science and Sanity (1933), “The map is not the territory … The only usefulness of a map depends on similarity of structure between the empirical world and the map.” And I would add, in the ever-changing markets, we can judge that similarity of structure only after the fact.

See the menu page Analytical Methods for a rundown on where to go for information on Elliott wave analysis.

By Tim Bovee, Portland, Oregon, December 7, 2023

Disclaimer

Tim Bovee, Private Trader tracks the analysis and trades of a private trader for his own accounts. Nothing in this blog constitutes a recommendation to buy or sell stocks, options or any other financial instrument. The only purpose of this blog is to provide education and entertainment.

No trader is ever 100 percent successful in his or her trades. Trading in the stock and option markets is risky and uncertain. Each trader must make trading decisions for his or her own account, and take responsibility for the consequences.

License
Creative Commons License

All content on Tim Bovee, Private Trader by Timothy K. Bovee is licensed under a Creative Commons Attribution-ShareAlike 4.0 International License.

Based on a work at www.timbovee.com.