9:35 a.m. New York time
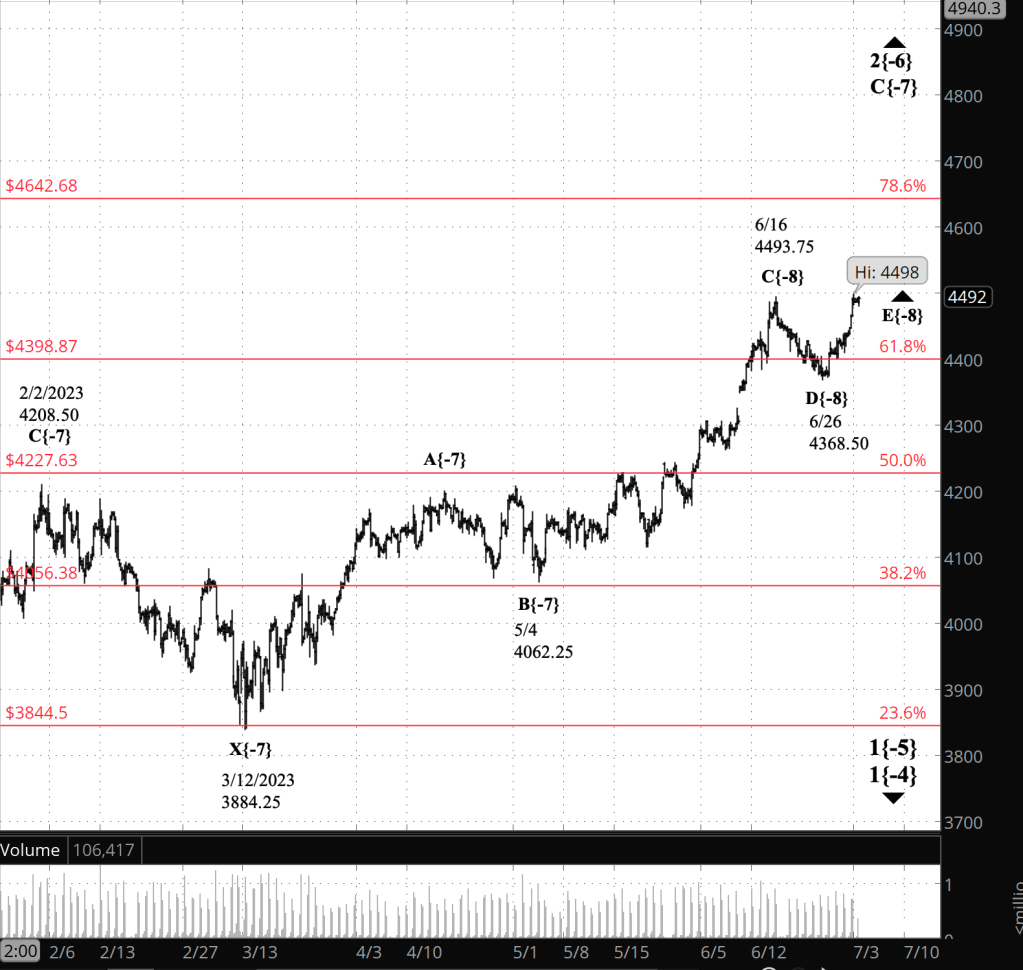
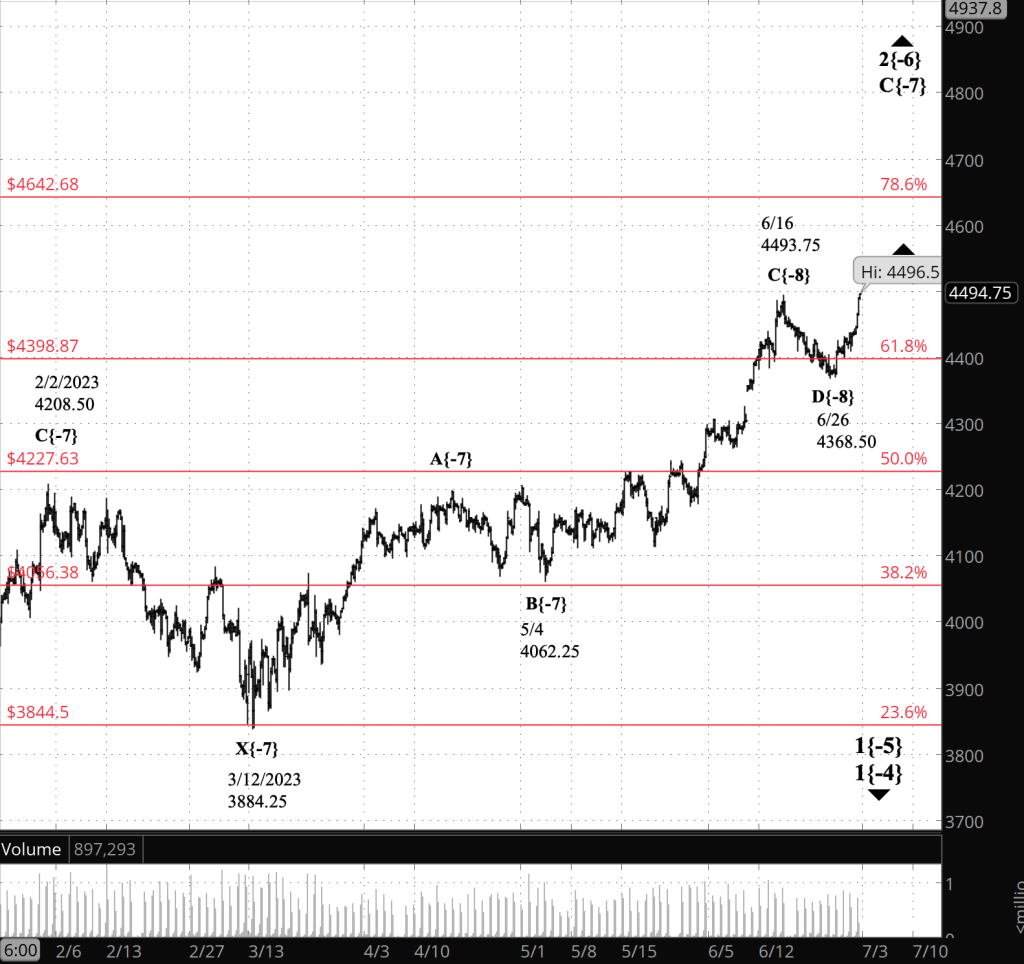
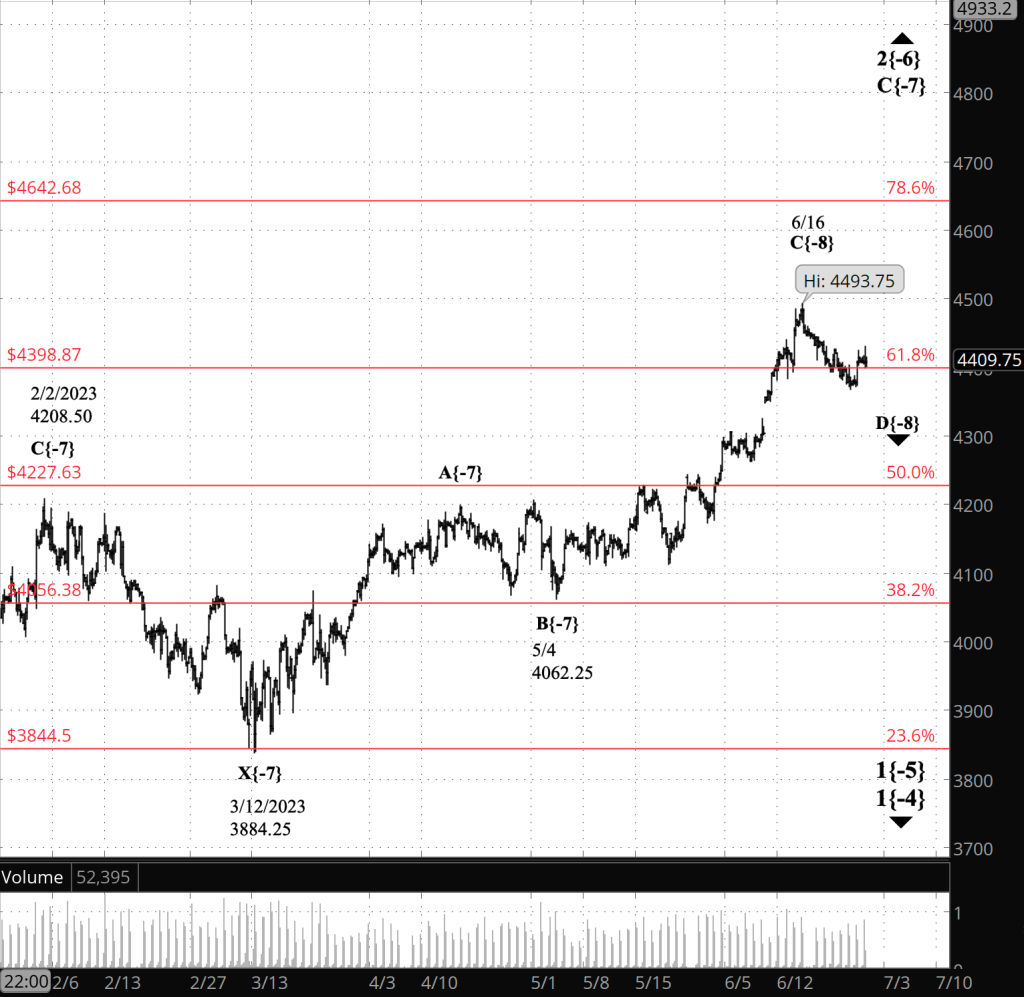
What’s happening now? The S&P 500 E-mini futures continued to trade in the 4490s and 4480s during a week that began with U.S. markets having a shortened session on Monday and staying closed today, Tuesday, for .the Independence Day holiday. Other global exchanges, such as London and Tokyo, were open for their regular sessions.
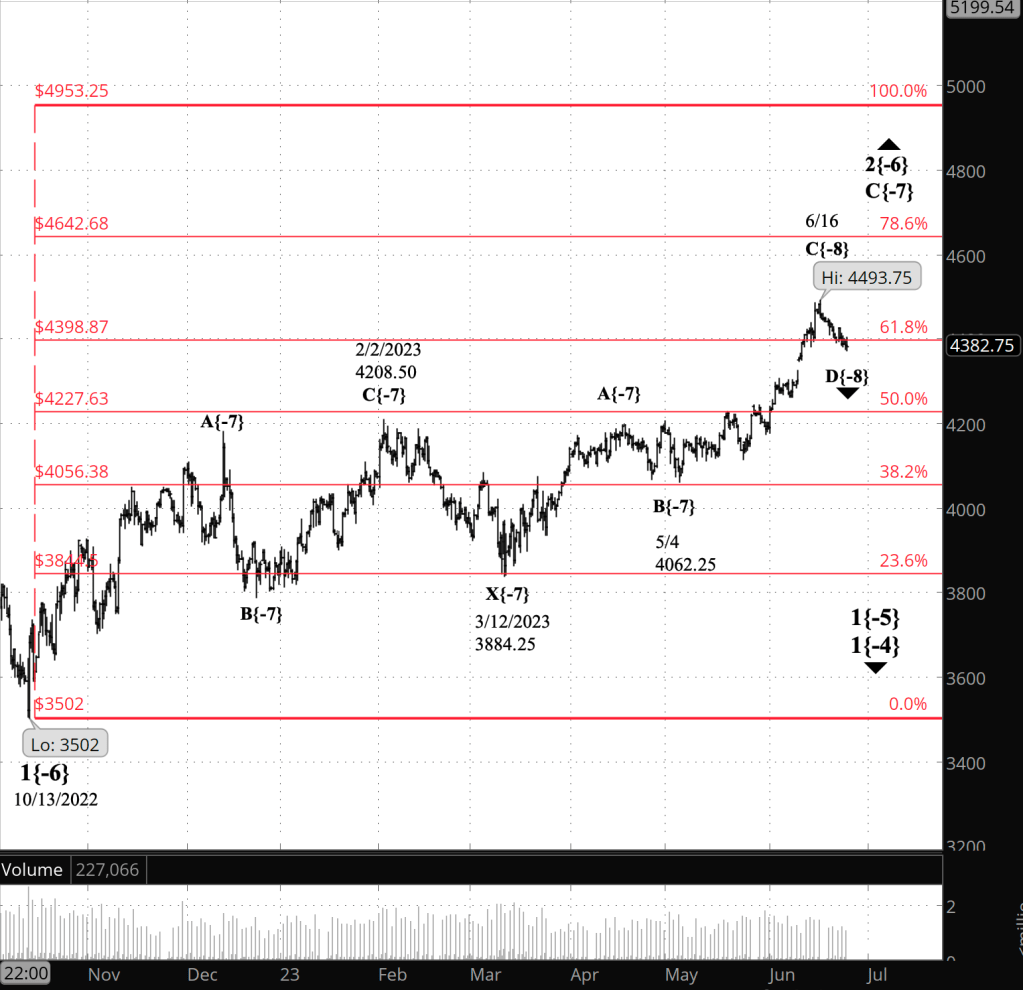
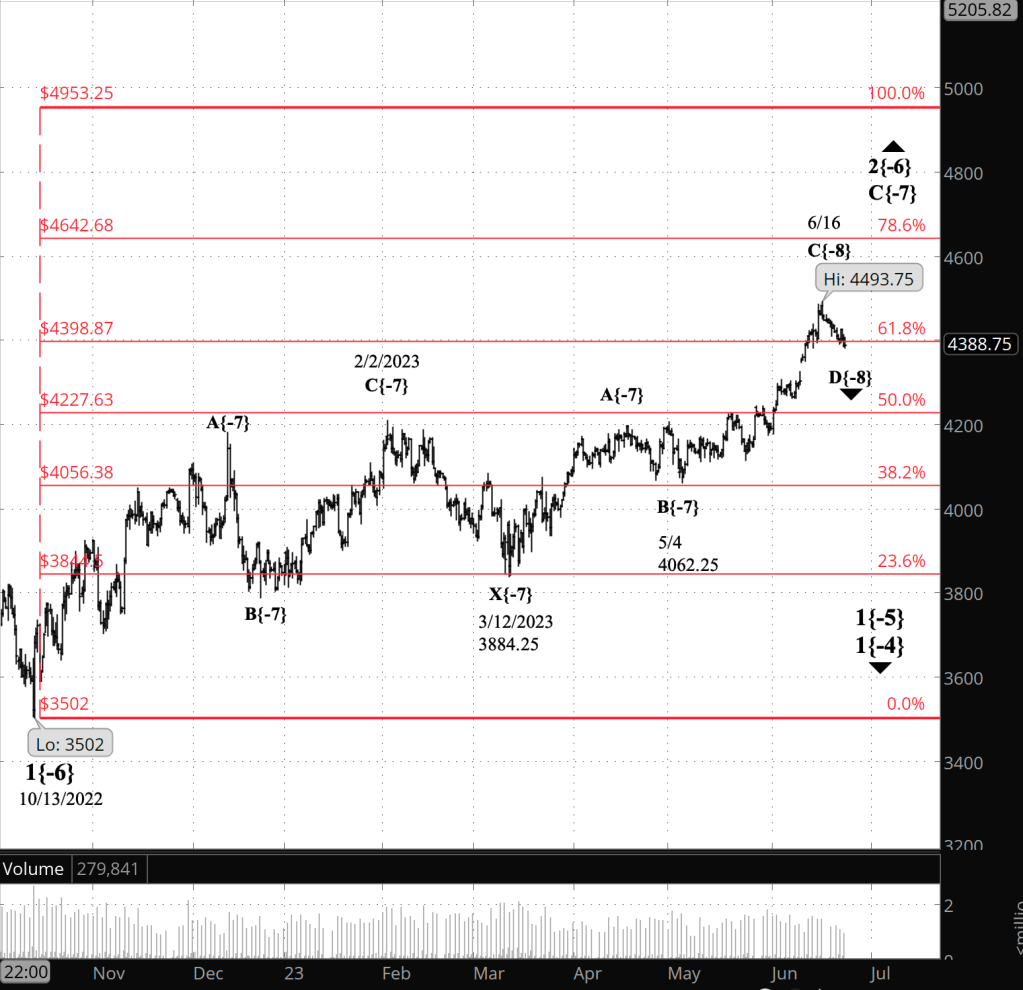
What does it mean? The only analysis possible is more of the same. An upward compounding correction, wave 2{-6} is in its second corrective pattern, and internally is in the final wave, rising wave E{-8}, within the last leg of the correction, rising wave C{-7}.
The end of wave E{-8} will also be the end of wave C{-7} and second corrective pattern.
Compound corrections can have as many as three waves, although many stop at two. There’s no way to know what this correction will do.
If the second corrective pattern marks the end of wave 2{-6}, then it will be followed by a powerful downtrending wave 3{-6}, which will carry the price below the start of the upward correction, 3502 on October 13, 2022, and, if it’s a typical 3rd wave, significantly lower.
If the correction will have a third corrective pattern, then there will be a downward separator wave, X{-7}, which will likely remain above the starting point of the correction.,
What are the alternatives? There is some ambiguity as to the relative degree of the correction — a not unusual situation. I’ve marked it as {-6} — Minuscule Degree in traditional Elliott wave terminology — but it could be larger.
Reading the chart. Price movements — waves – – in Elliott wave analysis are labeled with numbers within trending waves and letters with corrective waves. The subscripts — numbers in curly brackets — designate the wave’s degree, which, in Elliott wave analysis, means the relative position of a wave within the larger and smaller structures that make up the chart. R.N. Elliott, who in the 1930s developed the form of analysis that bears his name, viewed the chart as a complex structure of smaller waves nested within larger waves, which in turn are nested within still larger waves. In mathematics it’s called a fractal structure, where at every scale the pattern is similar to the others.
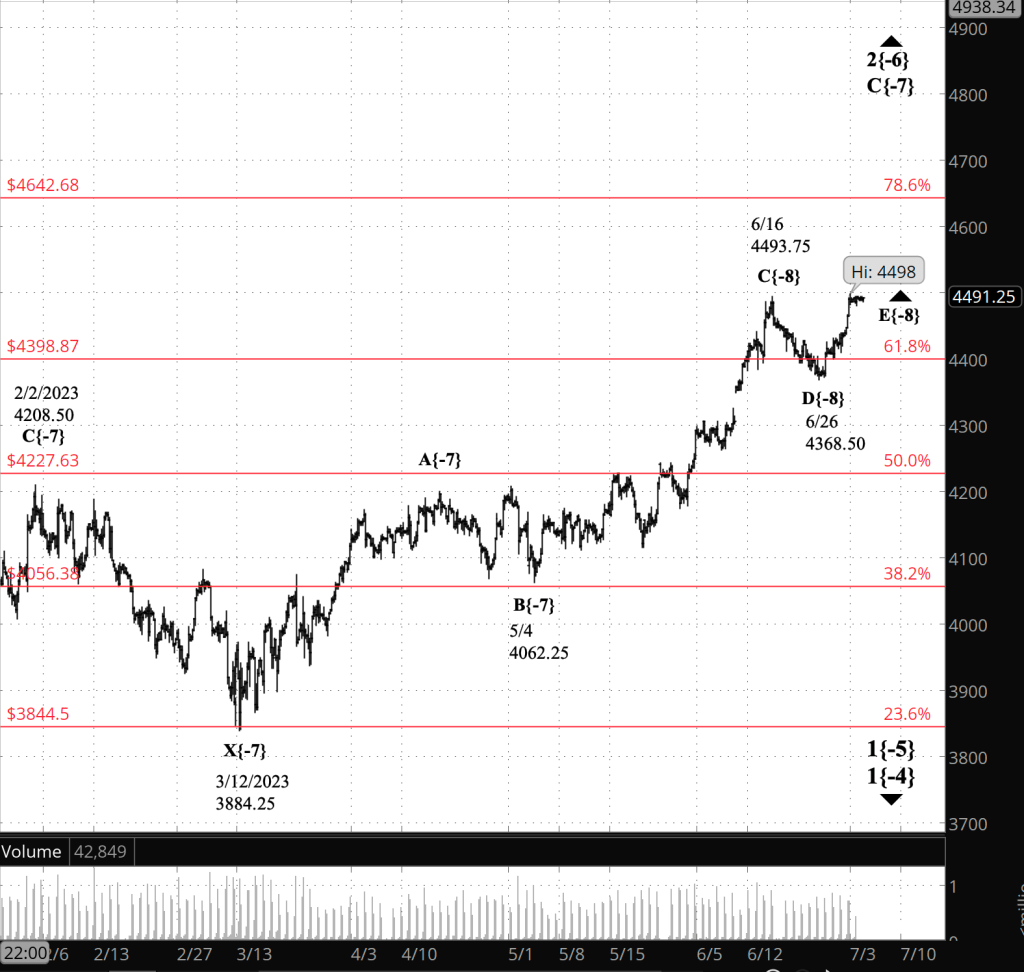
[S&P 500 E-mini futures at 9:35 a.m., 4-hour bars, with volume]
What does Elliott wave theory say? Here are the waves that underly the analysis.
- An upward correction, a Zigzag, wave 2{-6}, began on October 13, 2022 and is underway.
- The upward correction, wave 2{-6}, is taking a compound form, which can contain up to three corrective patterns.
- The correction is in its second corrective pattern, which is in wave C{-7}, its final wave.
- The end of the present wave C{-7} could also be the end of the wave 2{-6} correction if the compound structure contains two subwaves.
- Or the present corrective pattern could be followed by a declining connector, wave X{-7}, and then a third corrective pattern.
- Wave 2{-6}, when complete, will be followed by a powerful downtrend, wave 3{-6}.
- Under the rules of Elliott wave analysis, wave 2{-6} cannot move beyond the beginning of wave 1{-6}, which was the January 4, 2022 peak at 4953.25. (I’ve adjusted the January 4 peak.)
We Are Here.
These are the waves currently in progress under my principal analysis. Each line on the list shows the wave number, with the subscript in curly brackets, the traditional degree name, the starting date, the starting price of the S&P 500 E-mini futures, and the direction of the wave.
- S&P 500 Index:
- 5{+3} Supercycle, 7/8/1932, 4.40 (up)
- 5{+2} Cycle, 12/9/1974, 60.96 (up)
- 5{+1} Primary, 3/6/2009, 666.79 (up)
- 5{0} Intermediate, 12/26/2018, 2346.58 (up)
- S&P 500 Futures and index:
- 4{-1} Minor, 1/4/2022, 4953.25 (down) (futures), 4818.62 (down) (index)
- S&P 500 Futures:
- 1{-2} Minute, 1/4/2022, 4953.25 (down)
- 1{-3} Minuette, 1/4/2022, 4953.25 (down)
- 1{-4} Subminuette, 1/4/2022, 4953.25 (down)
- 1{-5} Micro, 1/4/2022, 4953.25 (down)
- 2{-6} Minuscule, 10/13/2022, 3577.75 (up)
Learning and other resources. Elliott wave analysis provides context, not prophecy. As the 20th century semanticist Alfred Korzybski put it in his book Science and Sanity (1933), “The map is not the territory … The only usefulness of a map depends on similarity of structure between the empirical world and the map.” And I would add, in the ever-changing markets, we can judge that similarity of structure only after the fact.
See the menu page Analytical Methods for a rundown on where to go for information on Elliott wave analysis.
By Tim Bovee, Portland, Oregon, July 4, 2023
Disclaimer
Tim Bovee, Private Trader tracks the analysis and trades of a private trader for his own accounts. Nothing in this blog constitutes a recommendation to buy or sell stocks, options or any other financial instrument. The only purpose of this blog is to provide education and entertainment.
No trader is ever 100 percent successful in his or her trades. Trading in the stock and option markets is risky and uncertain. Each trader must make trading decisions for his or her own account, and take responsibility for the consequences.
License
All content on Tim Bovee, Private Trader by Timothy K. Bovee is licensed under a Creative Commons Attribution-ShareAlike 4.0 International License.
Based on a work at www.timbovee.com.


You must be logged in to post a comment.