SP500 Analysis

3:30 p.m. New York time

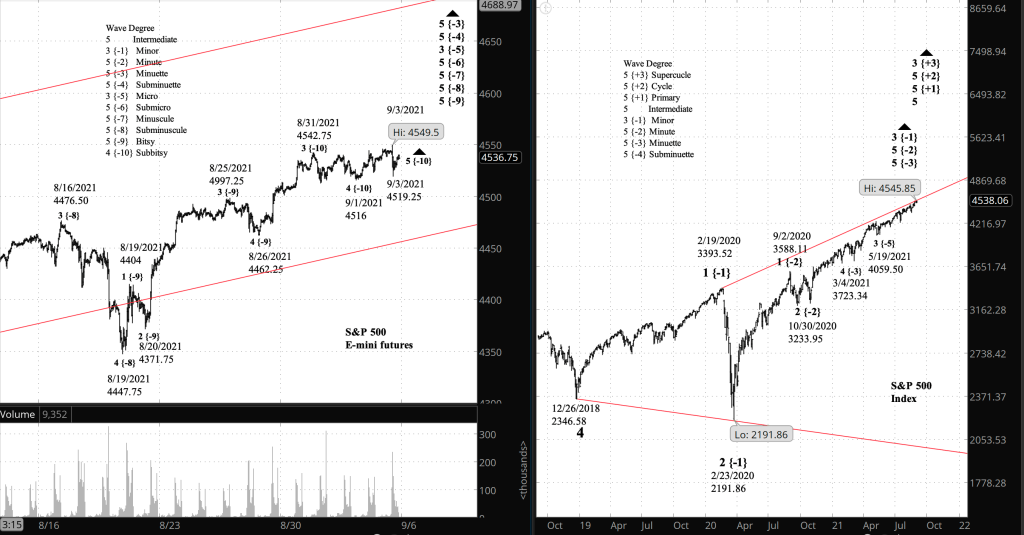
Half an hour before the closing bell. The S&P 500 rose from its low today of 4519.25, remaining below the overnight high of 4945.50. I’ve seen nothing to require a change in my analysis from this morning. I’ve updated the lower charts.

Holiday. Monday is a holiday in the United States — Labor Day — and markets will be closed. I anticipate that the S&P 500 E-mini futures will do some trading during market hours outside the U.S., and I shall post an analysis if there is any change on the chart.

10:10 a.m. New York time

My trades. I’ve entered short bear call options spreads on FXI and BABA.

9:35 a.m. New York time

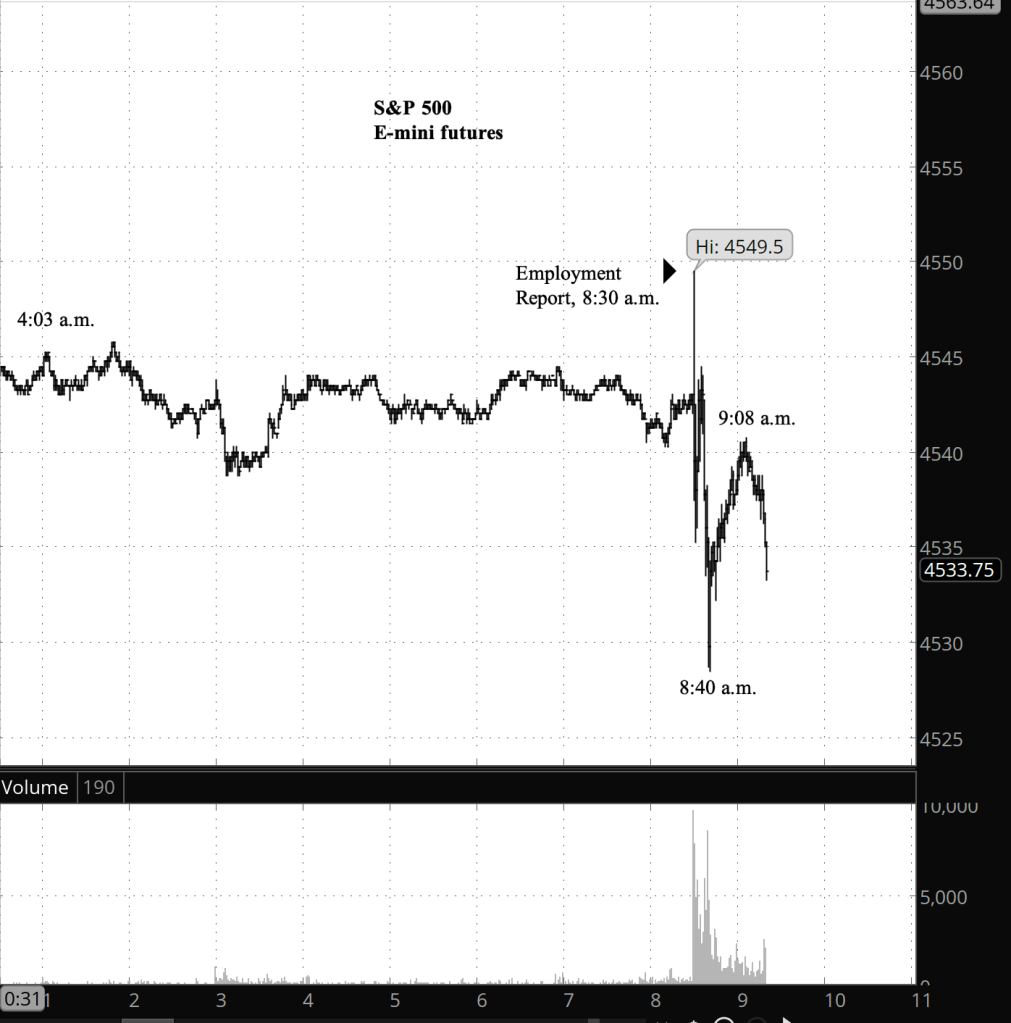
What’s happening now? The rise of the S&P 500 E-mini futures that brought the price to a new high of 4549.50 at 8:30 a.m. was immediately interrupted by a rapid drop lasting 10 minutes and a partial recovery that took 28 minutes to complete, followed by a decline that so far has remained above the morning’s low.

What does it mean? Whether the drama was an artifact of trading algorithms or something more meaningful in the analysis remains to be seen. On the chart I’ve treated the drop and recovery as very low level movements within a larger uptrend that is still underway.

What’s the alternative? The peak can be seen as the end of the uptrend and the drop and partial recovery as the first tentative steps in what will become a far larger correction to the downside.

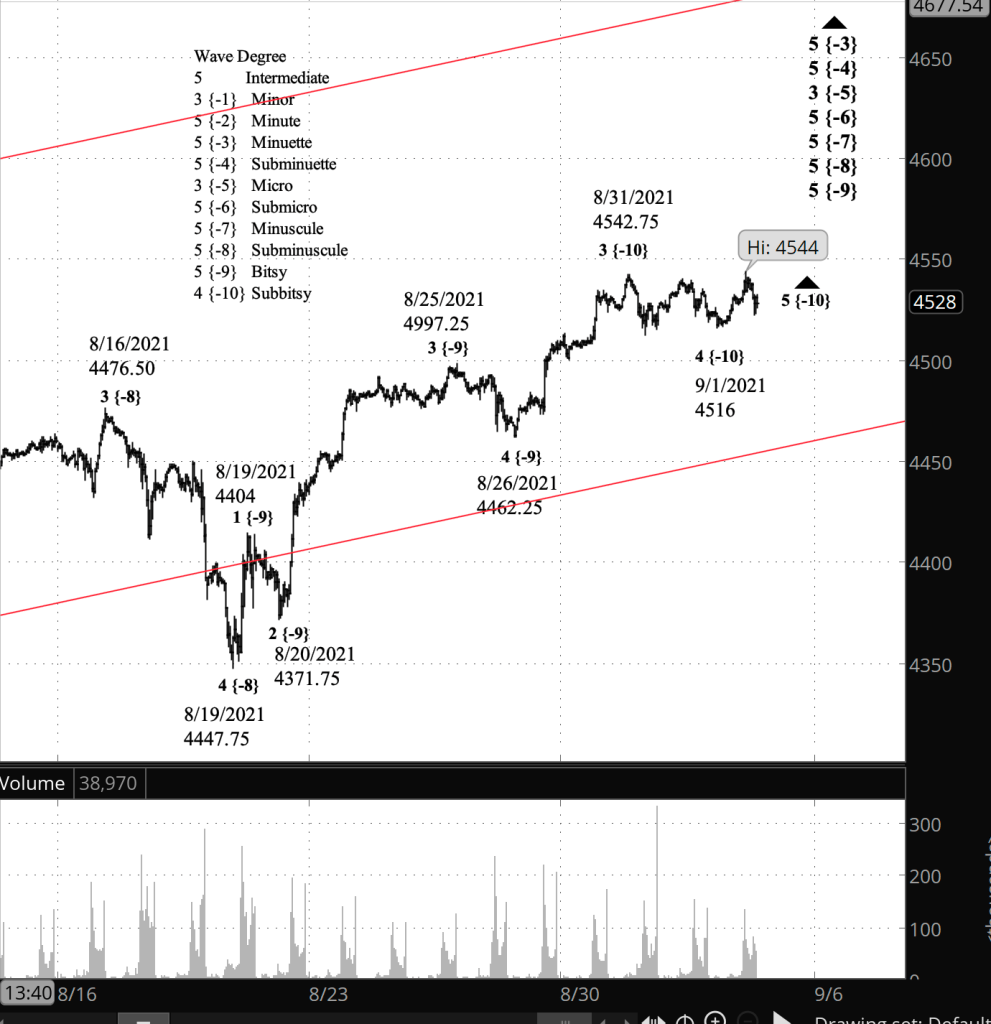
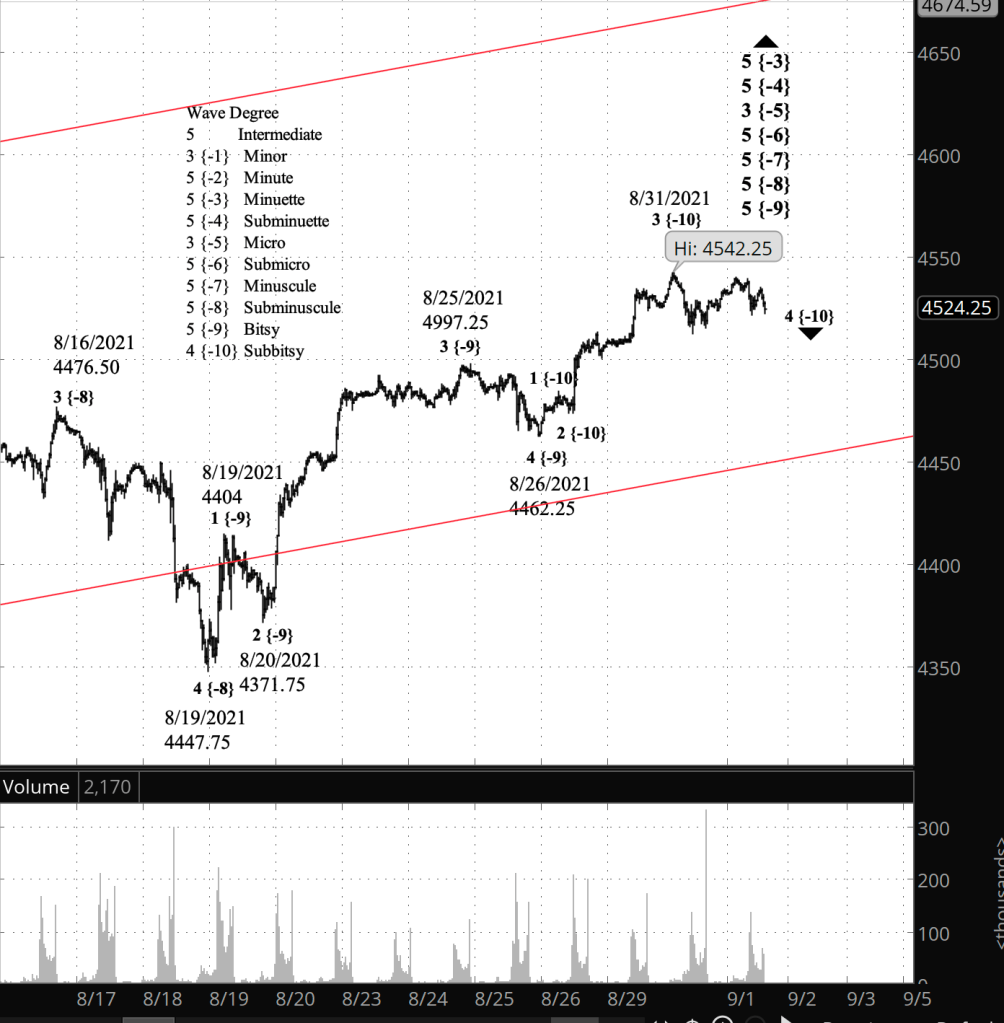
Charts. The upper chart is a close-up of the fluctuations of the E-mini futures at the time of Employment Situation Report was released. The lower chart is a combination showing a longer view of the futures, stretching back to mid-August, on the left, and a very long view stretching back to late 2019 on the right.

[S&P 500 E-mini futures at 9:20 a.m., 1-minute bars, with volume]
[Left: S&P 500 E-mini futures, 45-minute bars, with volume. Right: S&P 500 index, 2-day bars.
Both at 3:30 p.m.]

What does Elliott wave theory say? I’ve kept the principal analysis unchanged from yesterday: Wave 5 of Subbitsy degree within wave 5 of Bitsy degree, which are within a series of the 5th waves of increasing degree up to Submicro degree, whose parent, wave 3 of Micro degree, began on May 19.

Under the alternative analysis, the peak at 8:30 this morning was the end of wave 5 of Subbitsy degree, all the way up to the end of wave 3 of Micro degree. Under this scenario, wave 4 of Micro degree has begun.

Learning and other resources. Elliott wave analysis provides context, not prophecy. As the 20th century semanticist Alfred Korzybski put it in his book Science and Sanity (1933), “The map is not the territory … The only usefulness of a map depends on similarity of structure between the empirical world and the map.” And I would add, we can judge that similarity of structure only after the fact.

See the menu page Analytical Methods for a rundown on where to go for information on Elliott wave analysis.

By Tim Bovee, Portland, Oregon, September 3, 2021

Disclaimer

Tim Bovee, Private Trader tracks the analysis and trades of a private trader for his own accounts. Nothing in this blog constitutes a recommendation to buy or sell stocks, options or any other financial instrument. The only purpose of this blog is to provide education and entertainment.

No trader is ever 100 percent successful in his or her trades. Trading in the stock and option markets is risky and uncertain. Each trader must make trading decisions for his or her own account, and take responsibility for the consequences.

License
Creative Commons License

All content on Tim Bovee, Private Trader by Timothy K. Bovee is licensed under a Creative Commons Attribution-ShareAlike 4.0 International License.

Based on a work at www.timbovee.com.

SP500 Analysis

3:30 p.m. New York time

Half an hour before the closing bell. The S&P 500 fell during the day and then paused in the small-degree initial steps in a 5th wave rise to the upside. No change in the analysis beyond the 9:57 a.m. update confirming that wave 5 of Subbitsy degree is underway. I’ve updated the chart, below.

9:57 a.m. New York time

New high. And the S&P 500 futures have reached a new high, 4544, confirming my principal analysis. Chart updated.

9:35 a.m. New York time

What’s happening now? The S&P 500 E-mini futures completed the third leg of their correction from their August 31 high of 4542.25.

What does it mean? Most simple corrections have three legs — down, up, down for a downward correction. The next movement is a resumption of the trend, a rise in this case. Some corrections extend in compound patterns. In that case, the next upward movement is a separator that is followed by second corrective pattern.

My principal analysis, seen on the chart, treats the overnight rise as an early stage of the resumption of the uptrend that began on August 26. It will be confirmed by the price moving above 4542.25.

What’s the alternative? The resumed rise is a separator and will be followed by another corrective pattern, most likely with three subwaves.

[S&P 500 E-mini futures at 3:30 p.m., 40-minute bars, with volume]

What does Elliott wave theory say? Under my principal analysis, the overnight rise is the beginning of wave 5 of Subbitsy degree within a series of four 5th waves of increasingly higher degree, up to wave 5 of Submicro degree. The whole fractal series is within wave 3 of Micro degree. Wave 5 began within the completion of the wave 4 correction of Bitsy after yesterday’s closing bell.

Wave 5 of Subbitsy degree will push upward to new highs, exceeding the August 31 peak of 4542.25. The end of Subbitsy 5 will also be the end of wave 3 of Micro degree and the beginning of a 4th wave correction of the rise that began on May 19 at 4059.50.

Under the alternative analysis, the present rise is wave X of Subbitsy degree, a wave that separates two corrective patterns in a compound structure. Subbitsy wave X will end below the August 31 high of 4542.25.

Learning and other resources. Elliott wave analysis provides context, not prophecy. As the 20th century semanticist Alfred Korzybski put it in his book Science and Sanity (1933), “The map is not the territory … The only usefulness of a map depends on similarity of structure between the empirical world and the map.” And I would add, we can judge that similarity of structure only after the fact.

See the menu page Analytical Methods for a rundown on where to go for information on Elliott wave analysis.

By Tim Bovee, Portland, Oregon, September 2, 2021

Disclaimer

Tim Bovee, Private Trader tracks the analysis and trades of a private trader for his own accounts. Nothing in this blog constitutes a recommendation to buy or sell stocks, options or any other financial instrument. The only purpose of this blog is to provide education and entertainment.

No trader is ever 100 percent successful in his or her trades. Trading in the stock and option markets is risky and uncertain. Each trader must make trading decisions for his or her own account, and take responsibility for the consequences.

License
Creative Commons License

All content on Tim Bovee, Private Trader by Timothy K. Bovee is licensed under a Creative Commons Attribution-ShareAlike 4.0 International License.

Based on a work at www.timbovee.com.

SP500 Analysis

3:30 p.m. New York time

Half an hour before the closing bell. The S&P 500 continued its zigging and zagging downward course, which by my principal analysis is the C wave within a correction, wave 4 of Subbitsy degree within an uptrending wave 5 of Bitsy degree. No change in the analysis. i’ve updated the chart, below.

9:35 a.m. New York time

What’s happening now? The S&P 500 E-mini futures rose slightly in overnight trading, remaining below Tuesday’s high of 4542.25 on the futures, 4537.36 on the index, and then began a decline.

What does it mean? The decline is the final leg of a shallow, low level correction that began on August 31. When it is done, the next movement will be a rise to new highs.

What’s the alternative? A rise above 4542.25 would mean that the correction had ended and the rise to new heights was underway.

[S&P 500 E-mini futures at 3:30 p.m., 35-minute bars, with volume]

What does Elliott wave theory say? The decline from the August 31 high is wave 4 of Subbitsy degree. Within that parent wave, the A and B waves are complete, and wave C to the downside is underway.

When wave C is complete, there are two options: Either the price will reverse as wave 5 of Subbitsy degree and move above the prior peak of 4542.25, or there will be an upward separator X wave within Subbitsy wave 4 that will remain below that peak. It will be followed by a second corrective pattern in a compound structure.

The end of Subbitsy wave 5 will cascade up four levels, also ending 5th waves at Bitsy, Subminuscule, Minuscule and Submicro degrees, which in turn will mark the end of wave 3 of Micro degree, an uptrend that began last May. Micro 3 will be followed by a 4th wave correction and then a push to new heights.

Learning and other resources. Elliott wave analysis provides context, not prophecy. As the 20th century semanticist Alfred Korzybski put it in his book Science and Sanity (1933), “The map is not the territory … The only usefulness of a map depends on similarity of structure between the empirical world and the map.” And I would add, we can judge that similarity of structure only after the fact.

See the menu page Analytical Methods for a rundown on where to go for information on Elliott wave analysis.

By Tim Bovee, Portland, Oregon, September 1, 2021

Disclaimer

Tim Bovee, Private Trader tracks the analysis and trades of a private trader for his own accounts. Nothing in this blog constitutes a recommendation to buy or sell stocks, options or any other financial instrument. The only purpose of this blog is to provide education and entertainment.

No trader is ever 100 percent successful in his or her trades. Trading in the stock and option markets is risky and uncertain. Each trader must make trading decisions for his or her own account, and take responsibility for the consequences.

License
Creative Commons License

All content on Tim Bovee, Private Trader by Timothy K. Bovee is licensed under a Creative Commons Attribution-ShareAlike 4.0 International License.

Based on a work at www.timbovee.com.

SP500 Analysis

3:30 p.m. New York time

Half an hour before the closing bell. The S&P 500 continued to work through the low-level correction that began with an overnight peak, completing wave A within wave 4 of Subbitsy degree, and beginning wave B. A 4th wave correction, like its 2nd wave counterpart, has three waves internally. However, 4th waves have a stronger tendency to extend in compound pattern that result in two or three correctives waves in a row within the parent wave. No change in the analysis. I’ve updated the chart, below.

9:35 a.m. New York time

What’s happening now? The S&P 500 E-mini futures reached a new high of 4542.25 in overnight trading and then reversed to the downside. The new high on the index, at the opening bell, was 4537.36.

What does it mean? The peak marked the end of the low level rise that began on August 27 and the beginning of a correction that I expect to take a distinctly down-trending form; the preceding correction within the rise was rather shallow, and two corrections within a movement tend to alternate in form. The correction will be followed by a further push to the upside whose completion will be followed by a larger correction.

What’s the alternative? A swift reversal to the upside would mean that the rise from last Friday is still underway and the correction still lies in the future.

[S&P 500 E-mini futures at 3:30 p.m., 30-minute bars, with volume]

What does Elliott wave theory say? The rise from August 27 is wave 3 of Subitsy degree and the subsequent decline is Subitsy wave 4, all within wave 5 of Bitsy degree. Wave 2 of Subbitsy degree, which ended on August 27, was quite shallow: A Flat formation. Under the rule of alternation within Elliott wave analysis, wave 4 correction is expected to be steeper: A Zigzag formation.

The end of Subbitsy 4 will also be the end of Bitsy 5 and will cascade up three levels of 5th waves to mark the end of wave 5 of Submicro degree. That end point will also mark the end of wave 3 of MIcro degree, which began May 19 at 4059.50, settting off a 4th wave correction.

The same rule of alternation suggests that wave 4 of Micro degree will be a shallow Flat correction, since the preceding wave 2 was a steep Zigzag.

Learning and other resources. Elliott wave analysis provides context, not prophecy. As the 20th century semanticist Alfred Korzybski put it in his book Science and Sanity (1933), “The map is not the territory … The only usefulness of a map depends on similarity of structure between the empirical world and the map.” And I would add, we can judge that similarity of structure only after the fact.

See the menu page Analytical Methods for a rundown on where to go for information on Elliott wave analysis.

By Tim Bovee, Portland, Oregon, August 31, 2021

Disclaimer

Tim Bovee, Private Trader tracks the analysis and trades of a private trader for his own accounts. Nothing in this blog constitutes a recommendation to buy or sell stocks, options or any other financial instrument. The only purpose of this blog is to provide education and entertainment.

No trader is ever 100 percent successful in his or her trades. Trading in the stock and option markets is risky and uncertain. Each trader must make trading decisions for his or her own account, and take responsibility for the consequences.

License
Creative Commons License

All content on Tim Bovee, Private Trader by Timothy K. Bovee is licensed under a Creative Commons Attribution-ShareAlike 4.0 International License.

Based on a work at www.timbovee.com.

SP500 Analysis

3:30 p.m. New York time

Half an hour before the closing bell. The S&P 500 continued to rise until the midpoint of the trading session and then began a low-scale sideways movement. The pattern lends credence to my principal analysis of this morning: The present wave is the 3rd of Subbitsy degree, and I would consider the new sideways pattern as a 4th wave internal to Subbitsy 3. No change in the analysis. I’ve updated the chart.

9:50 a.m. New York time

What’s happening now? The S&P 500 E-mini futures rose to a new high in the minutes before the opening bell.

What does it mean? The low-level uptrend that began August 26 is still underway and is now in the middle portion of its rise. Its completion will be followed by a shallow correction and then a further rise to new heights.

What’s the alternative? It’s possible that the overnight sideways movement was the correction, and the further rise is the final portion of the uptrend from last week. It’s a question of what level we’re counting, and I discuss it further in the Elliott wave theory section, below.

[S&P 500 E-mini futures at 3:30 p.m., 20-minute bars, with volume]

What does Elliott wave theory say? The rise from August 26 is wave 5 of Bitsy degree. It’s completion will signal the end of a series of 5th waves of higher degree, up three levels to Submicro degree. The parent, wave 3 of Micro degree, began May 19 at 4059.50.

How far along is Bitsy wave 5? By my principal count, internally it is in wave 3 of Subbitsy degree, which will be followed by a 4th wave correction and then a 5th wave push to new highs.

But what to make of the sideways movement overnight? I’m treating it as a 4th wave within Subitsy wave 3, a level so low I don’t even have a name for it. Using the subscripts method, Subitsy on the chart is {-10} and the unnamed lower wave is {-11}.

It’s possible, however, that what I’m calling the Subitsy, {-10}, degree is really the nameless {-11}, and the sideways stretch overnight was a degree lower, at {-12}. And that is my alternative analysis. Time will unravel the mystery of which analysis is correct.

Learning and other resources. Elliott wave analysis provides context, not prophecy. As the 20th century semanticist Alfred Korzybski put it in his book Science and Sanity (1933), “The map is not the territory … The only usefulness of a map depends on similarity of structure between the empirical world and the map.” And I would add, we can judge that similarity of structure only after the fact.

See the menu page Analytical Methods for a rundown on where to go for information on Elliott wave analysis.

By Tim Bovee, Portland, Oregon, August 30, 2021

Disclaimer

Tim Bovee, Private Trader tracks the analysis and trades of a private trader for his own accounts. Nothing in this blog constitutes a recommendation to buy or sell stocks, options or any other financial instrument. The only purpose of this blog is to provide education and entertainment.

No trader is ever 100 percent successful in his or her trades. Trading in the stock and option markets is risky and uncertain. Each trader must make trading decisions for his or her own account, and take responsibility for the consequences.

License
Creative Commons License

All content on Tim Bovee, Private Trader by Timothy K. Bovee is licensed under a Creative Commons Attribution-ShareAlike 4.0 International License.

Based on a work at www.timbovee.com.

SP500 Analysis

3:30 p.m. New York time

Half an hour before the closing bell. The S&P 500 has continued to rise during the trading day, reaching 4509.25 so far on the futures, 4512.45 on the index. No change in the revised analysis. I’ve updated the uppermost of the two charts.

10:45 a.m. New York time

Revised analysis. The S&P 500 rose sharply to new highs as Federal Reserve Chairman Jerome Powell spoke about the Fed’s policies at the online-this-year Jackson Hole Symposium. The rise means that the low-level correction discussed in this morning’s analysis ended at yesterday’s low and the push to higher highs, also discussed earlier, is now underway.

The alternative analysis would treat the quick rise as a wave separating two corrective patterns in a compounds correction. With the present evidence, I can’t choose between the two. If the price quickly retreats, then the separator wave scenario will become the principal analysis.

In terms of Elliott wave analysis, yesterday’s low marked the end of wave C of Subbitsy degree within wave 4 of Bitsy degree, and the subsequent rise is wave 5 of Bitsy degree, whose whose completion will also mark the end of two 5th waves of increasingly higher degree, Minuscule and Submicro, and of their parent, wave 3 of Micro degree.

Here’s the new chart. I’ve retained the former, now out-dated chart below as reference.

[S&P 500 E-mini futures at 3:30 p.m., 20-minute bars, with volume]

10 a.m. New York time

What’s happening now? The low level correction that began August 24 on the S&P 500 E-mini futures completed its first downward wave in overnight trading and is now in its upward second wave.

What does it mean? The final wave of the three-wave pattern will be a downward movement. The end of the correction will be followed by a push to new highs.

What’s the alternative? Corrections tend to come in groups of three waves internally, although often they extend in compound patterns. So whether this three wave pattern will be the end of the correction is still an open question. If it extends, then the final wave of the first pattern will be followed by a separator wave to the upside, and then a second corrective pattern, most likely also of three waves internally.

[Outdated: S&P 500 E-mini futures at 10:02 a.m., 20-minute bars, with volume]

What does Elliott wave theory say? The low overnight marked the end of wave A of Subbitsy degree within wave 4 of Bitsy degree, a correction within wave 5 of Subminuscule degree. Bitsy wave 4 will be followed by a 5th wave of the same degree, whose completion will also mark the end of two 5th waves of increasingly higher degree, Minuscule and Submicro, and of their parent, wave 3 of Micro degree. At the lowest level, Subbitsy wave B is now underway and will be followed by a downward movement, Subbitsy wave C.

The question is what will happen at the end of Subbitsy wave C. If the correction proves to be a simple three-wave pattern, then the end of C will mark the beginning of Bitsy wave 5’s journey to new highs. If the correction proves to be a compound pattern, then Subbitsy C will be followed by a separator wave, labelled X and then another corrective pattern of Subbitsy degree, most likely a Zigzag or a Flat, although a triangle of some sort is also possible

Learning and other resources. Elliott wave analysis provides context, not prophecy. As the 20th century semanticist Alfred Korzybski put it in his book Science and Sanity (1933), “The map is not the territory … The only usefulness of a map depends on similarity of structure between the empirical world and the map.” And I would add, we can judge that similarity of structure only after the fact.

See the menu page Analytical Methods for a rundown on where to go for information on Elliott wave analysis.

By Tim Bovee, Portland, Oregon, August 27, 2021

Disclaimer

Tim Bovee, Private Trader tracks the analysis and trades of a private trader for his own accounts. Nothing in this blog constitutes a recommendation to buy or sell stocks, options or any other financial instrument. The only purpose of this blog is to provide education and entertainment.

No trader is ever 100 percent successful in his or her trades. Trading in the stock and option markets is risky and uncertain. Each trader must make trading decisions for his or her own account, and take responsibility for the consequences.

License
Creative Commons License

All content on Tim Bovee, Private Trader by Timothy K. Bovee is licensed under a Creative Commons Attribution-ShareAlike 4.0 International License.

Based on a work at www.timbovee.com.

SP500 Analysis

3:30 p.m. New York time

Half an hour before the closing bell. The S&P 500 declined during the day in a pattern consistent with my alternative analysis, which has been promoted to principal analysis status. Yesterday’s high of 4498 was the peak of wave 3 of Bitsy degree, and Wave 4 of Bitsy degree is tracing a counter-trend correction. Here’s a new chart with the revised analysis.

[Revised analysis: S&P 500 E-mini futures at 3:30 p.m., 30-minute bars, with volume]

9:45 a.m. New York time

What’s happening now? The S&P 500 E-mini futures dipped slightly and then rose in overnight trading, remaining below yesterday’s high, 4498.

What does it mean? The small decline will be followed by new highs in the final leg of the rise that began on August 19.

What’s the alternative? A sideways correction that began on August 23 is still underway, pushing off the rise to new highs until later in the future.

[Outdated: S&P 500 E-mini futures at 9:46 a.m., 30-minute bars, with volume]

What does Elliott wave theory say? It’s hard to choose between the two possible scenarios. I consider them to be of equal likelihood.

Under my principal analysis, wave 5 of Bitsy degree began at yesterday’s low and is presently in a very low-level wave 2 correction internally.

Under my alternative analysis, wave 4 of Bitsy degree is still underway.

See yesterday’s S&P 500 analysis for a detailed discussion of the greater implications of both scenarios.

Learning and other resources. Elliott wave analysis provides context, not prophecy. As the 20th century semanticist Alfred Korzybski put it in his book Science and Sanity (1933), “The map is not the territory … The only usefulness of a map depends on similarity of structure between the empirical world and the map.” And I would add, we can judge that similarity of structure only after the fact.

See the menu page Analytical Methods for a rundown on where to go for information on Elliott wave analysis.

By Tim Bovee, Portland, Oregon, August 26, 2021

Disclaimer

Tim Bovee, Private Trader tracks the analysis and trades of a private trader for his own accounts. Nothing in this blog constitutes a recommendation to buy or sell stocks, options or any other financial instrument. The only purpose of this blog is to provide education and entertainment.

No trader is ever 100 percent successful in his or her trades. Trading in the stock and option markets is risky and uncertain. Each trader must make trading decisions for his or her own account, and take responsibility for the consequences.

License
Creative Commons License

All content on Tim Bovee, Private Trader by Timothy K. Bovee is licensed under a Creative Commons Attribution-ShareAlike 4.0 International License.

Based on a work at www.timbovee.com.

BABA Analysis

Alibaba Group Holding Ltd. (BABA)

1:40 p.m. New York time

What’s happening now? BABA dropped off from its Tuesday high, 174.15, with an opening gap this morning.

What does it mean? The price has completed a 1st wave up within an upward correction a long downtrend and is now falling in a downward correction within the upward correction.

What’s the alternative? The low of 152.80 on August 23 marked the end of a major decline, and the present upward movement is the beginning of a major uptrend that will eventually move above the October 2020 high of 319.32.

Chart note. The subscripts in the wave labels are relative to one another and are unrelated to the Elliott wave theory nomenclature of wave degrees.

[BABA at 1:40 p.m., 30-minute bars]

What does Elliott wave theory say? By my principal count, the present decline is wave 2 {-4} within uptrending wave A {-3}, the first wave of the wave 4 {-2} upward correction that began on August 23. Fourth waves tend to be shallow, so I don’t expect a great deal of upside from this one. Wave 4 {-2} will be followed by a 5th wave of the same degree that will push the price to below 152.80, the August 23 low.

By my alternative count, the August 23 low marked the end of the correction, and the rise from August 23 is the beginning of a new wave to the upside that will eventually break above 319.32, the all-time high for BABA set on October 27, 2020

Learning and other resources. Elliott wave analysis provides context, not prophecy. As the 20th century semanticist Alfred Korzybski put it in his book Science and Sanity (1933), “The map is not the territory … The only usefulness of a map depends on similarity of structure between the empirical world and the map.” And I would add, we can judge that similarity of structure only after the fact.

See the menu page Analytical Methods for a rundown on where to go for information on Elliott wave analysis.

By Tim Bovee, Portland, Oregon, August 25, 2021

Disclaimer

Tim Bovee, Private Trader tracks the analysis and trades of a private trader for his own accounts. Nothing in this blog constitutes a recommendation to buy or sell stocks, options or any other financial instrument. The only purpose of this blog is to provide education and entertainment.

No trader is ever 100 percent successful in his or her trades. Trading in the stock and option markets is risky and uncertain. Each trader must make trading decisions for his or her own account, and take responsibility for the consequences.

License
Creative Commons License

All content on Tim Bovee, Private Trader by Timothy K. Bovee is licensed under a Creative Commons Attribution-ShareAlike 4.0 International License.

Based on a work at www.timbovee.com.

SP500 Analysis

3:30 p.m. New York time

Half an hour before the closing bell. The S&P 500 rose to a new high in trading today, 4497.25 so far on the futures, and 4501.08 on the index. The wave 4 correction of Bitsy degree has ended, and wave 5 of Bitsy degree is underway. I’ve updated the chart.

1:45 p.m. New York time

Other analysis. BABA dropped off from its Tuesday high, 174.15, with an opening gap this morning. The price has completed a 1st wave up within an upward correction a long downtrend and is now falling in a downward correction within the upward correction. I’ve posted an analysis.

9:50 a.m. New York time

What’s happening now? The S&P 500 E-mini futures continued their sideways course overnight, remaining below yesterdays high of 4492 on the futures, 4492.81 on the index.

What does it mean? The movement is a low-level correction that will be followed by a rise to new heights.

What’s the alternative? Yesterday’s high marked the end of the rise of August 19, triggering a series of completions up to the rise that began on May 19.

[S&P 500 E-mini futures at 3:30 p.m., hourly bars, with volume]

What does Elliott wave theory say? The sideways movement from yesterday is wave 4 of Bitsy degree, following the peak at 4492 that marked the end of Bitsy wave 3. Fourth wave corrections tend to be shallow, and this 4th wave so far is adhering to that tendency. It will be followed by wave 5 of Bitsy degree, which will break above the previous peak of 4492, with no formal limits on how high it can go. Ideally, it would hit the upper boundary of the price channel, but that’s a bit of a stretch for a wave of such a small degree.

The end of Bitsy wave 5 triggers completion of a series of 5th waves of greater degree, up three levels to Submicro degree, which in turn completes wave 3 of Micro degree, which began on May 19 at 4055.50 on the index. The ensuing wave 4 of Micro degree will be shallow correction, albeit of far more impactful size than the Bitsy-degree correction we’ve seen since yesterday.

The less likely alternative: Yesterday’s peak at 4492 was the end of wave 5 of Bitsy degree and of the parent waves discussed above, and the sideways movement is a very muddy, tentative step in what will prove to be a significant decline correcting the Minor-degree wave 3 rise that began on February 23, 2020 from 2191.86 on the index.

Learning and other resources. Elliott wave analysis provides context, not prophecy. As the 20th century semanticist Alfred Korzybski put it in his book Science and Sanity (1933), “The map is not the territory … The only usefulness of a map depends on similarity of structure between the empirical world and the map.” And I would add, we can judge that similarity of structure only after the fact.

See the menu page Analytical Methods for a rundown on where to go for information on Elliott wave analysis.

By Tim Bovee, Portland, Oregon, August 25, 2021

Disclaimer

Tim Bovee, Private Trader tracks the analysis and trades of a private trader for his own accounts. Nothing in this blog constitutes a recommendation to buy or sell stocks, options or any other financial instrument. The only purpose of this blog is to provide education and entertainment.

No trader is ever 100 percent successful in his or her trades. Trading in the stock and option markets is risky and uncertain. Each trader must make trading decisions for his or her own account, and take responsibility for the consequences.

License
Creative Commons License

All content on Tim Bovee, Private Trader by Timothy K. Bovee is licensed under a Creative Commons Attribution-ShareAlike 4.0 International License.

Based on a work at www.timbovee.com.

BABA Analysis

Alibaba Group Holding Ltd. (BABA)

11 a.m. New York time

Elliott wave analysis updated. I’ve updated the Elliott wave analysis with a paragraph on the internals of wave 5 {-2}. Also, I’ve updated the chart.

10:40 a.m. New York time

What’s happening now? BABA rose sharply, with an opening gap, in this morning’s trading.

What does it mean? Big picture, BABA has been in decline since October of last year and has fallen to a bit more than 20 points above the December 2018 low. On the chart, I’ve treated the subsequent decline as a correction within a long-term rise, for reasons discussed in the Elliott wave analysis section.

What’s the alternative? The decline could be understood as the beginning of a long-term downtrend. I’ve rejected that for reasons discussed in the Elliott wave analysis section.

The chart In the chart below I’ve added in a 6-day moving average, in red, to clarify the subwaves. The wave labels on the chart are relative to each other and don’t correlate with the Elliott wave-naming system.

[BABA at 11 a.m., daily bars]

What does Elliott wave theory say? The nature of the decline is revealed by the internal count within the three waves. If the count is 3-3-5, then it’s a correction. I read the chart as 3-3-5 and have labeled the subwaves. The count within wave B {-1} is a bit ambiguous, but under the Elliott wave rules, B waves tend to have three waves internally. So from that structure, I conclude that the decline that began October 27, 2020 is a correction within an uptrend and will be followed, eventually, with many ups and downs, by a rise to new heights.

Under my principal analysis, the rise from 2018 is still underway. The alternative would be to consider the October 2020 peak to be the end of the rise that began in 2018. For this to work, I would have to break the first wave of the decline into five subwaves. It’s possible most of the time, if I squint real hard, to make that work. In this chart, I think it’s an unlikely conclusion to draw from the evidence.

The question comes down to whether wave 5 {-2} is complete. Fifth waves tend to extend, and that might well be the case here. So there may be more downside ahead before the rise begins. The shortness of the 3rd wave within 5 {-2} is troubling, since under the rules of Elliott wave analysis, a 3rd wave cannot be the shortest wave within a trend. And indeed, wave 1 {-3} is 32.63 points long, and wave 3 {0-3} is 36.93 points long. So it’s a legitimate count within an extension, but just barely. I consider that to be a caution flag.

Learning and other resources. Elliott wave analysis provides context, not prophecy. As the 20th century semanticist Alfred Korzybski put it in his book Science and Sanity (1933), “The map is not the territory … The only usefulness of a map depends on similarity of structure between the empirical world and the map.” And I would add, we can judge that similarity of structure only after the fact.

See the menu page Analytical Methods for a rundown on where to go for information on Elliott wave analysis.

By Tim Bovee, Portland, Oregon, August 24, 2021

Disclaimer

Tim Bovee, Private Trader tracks the analysis and trades of a private trader for his own accounts. Nothing in this blog constitutes a recommendation to buy or sell stocks, options or any other financial instrument. The only purpose of this blog is to provide education and entertainment.

No trader is ever 100 percent successful in his or her trades. Trading in the stock and option markets is risky and uncertain. Each trader must make trading decisions for his or her own account, and take responsibility for the consequences.

License
Creative Commons License

All content on Tim Bovee, Private Trader by Timothy K. Bovee is licensed under a Creative Commons Attribution-ShareAlike 4.0 International License.

Based on a work at www.timbovee.com.