Live: Friday, July 17, 2020

10:10 a.m. New York time

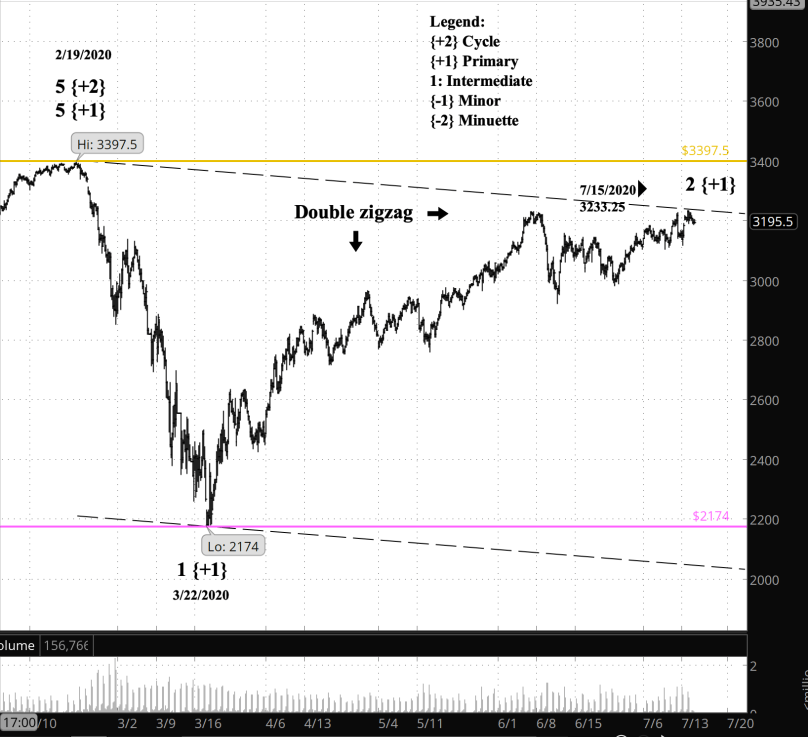
What’s happening now? The S&P 500 E-mini futures are midway through an uptrending part of an upward correction.

What does it mean? There is a still  more upside left to the correction, although not a lot. The present near-term upward movement will be followed by a small decline and then a final push to the upside. Afterward, either the correction will be complete and the price will begin a major decline, or the correction will extend, perhaps for another month.

Screen Shot 2020-07-17 at 7.00.05 AM
S&P 500 E-mini futures, 2-hour bars

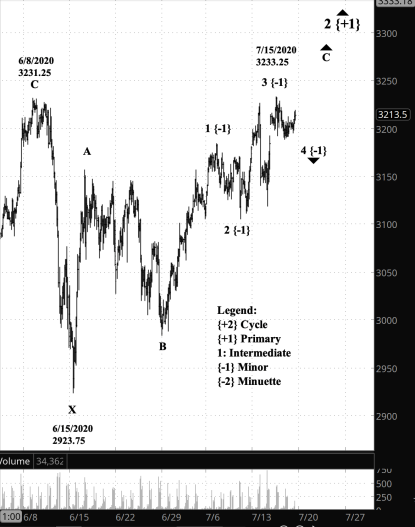
What does Elliott wave theory say? The peak of July 15 marks the end of Minor wave 3 within Intermediate wave C, all with the Primary wave 2 upward correction. Intermediate C requires two more waves for completion: Minor 4 down and Minor 5 up.

Primary 2 is in the second section of a complex correction, composed so far of two zigzags. It could go for a third section — a zigzag or a flat, perhaps — separated from the prior section by an X wave. In that case there will be more upside, although under the present count covering the entire decline since February 19, it cannot exceed 3397.50, the start of Primary wave 1 on that date.

What is the alternative? The end of Minor wave C could mark the end of the Primary wave 2 correction. It would be followed by Primary 3, a downward move of great energy down to the 2000s.

What about my trades? I’m holding back from entering new positions, shares or options, at this point.

Read More »

Live: Thursday, July 16, 2020

9:35 New York time

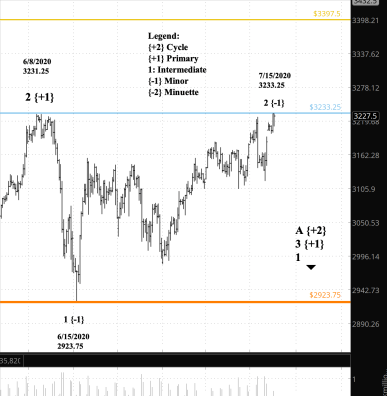
What’s happening now? There was a divergence among the three major S&P 500 products, with two crossing above what I had labelled the peak of Primary wave 2 on June 8. Here are the numbers:

  • S&P 500 index: June 8 high, 3233.13; July 15 high, 3238.28; broke above by 5.16 points
  • S&P 500 E-mini futures: June 8 high, 3231.25; July 15 high, 3233.25; broke above by 2.00 points
  • SPY exchange-traded fund: June high, 323.41; July 15 high, 323.04; fell short by 0.37.

All three are now below their July 15 highs, although by only a little.

What does it mean? The upward correction that began March 22 from 2174 is still underway. It did not end on June 8.

What does Elliott wave theory say? The two breakouts, if we’re willing to accept two out of three as action-worthy, mean that the July 8 peak of the end of an Intermediate wave within the end of Primary wave 2, whose high so far on the S&P 500 E-mini futures chart is 2233.25.

Screen Shot 2020-07-16 at 6.36.36 AM

However, does two out of three really dictate the status of the full range of products? I don’t think so; I want unanimity before I sign up on the idea that Primary wave 2 continued past June 8. At this point, in my opinion, the best we can say is that the chart is ambiguous. However, I’ve marked the chart to conform with the breakout as a working hypothesis, even though it’s not yet confirmed.

If the price continues with another three-wave pattern inclining up or sideways, with the SPY exchange-traded fund moving with the other two products rather than remaining a lone wolf, then the analysis placing the S&P 500 still in Primary wave 2 will be confirmed.

What is the alternative? If the price falls below 2174 (the red line) in a five-wave pattern, then Primary wave 2 is over and Primary wave 3 is confirmed.

And if the line rises above 3397.50, the tan line, the crash of February 19 was nothing more than a correction within the rise that began in December 1974 and is still continuing.

Read More »

Live: Wednesday, July 15, 2020

10:55 a.m. New York time

What’s happening now? The S&P 500 E-mini futures this morning did a repeat of Monday, moving back above the previous high. The new high is 3233.25, seven points higher.

What does it mean? The correction that began July 15 is still underway. It will be followed by a sharp decline.

Screen Shot 2020-07-15 at 7.51.34 AM

What does Elliott wave theory say? The fresh breakout means that Minor wave 2, an upward correction, is still in force. It has completed two Zigzags of the Minuette degree, one level down from Minor. The continuation of the correction means that there will be at a minimum three more Minuette waves. Their duration varies, but so far that lower degree’s waves have taken anywhere from one to 10 days to run their course.

However, the futures also moved above the peak of June 8, the June 8 peak of Primary wave 2, which is two degrees above the Minor level. That point is also the start of Minor wave 1, and wave 2 under Elliott’s rules cannot move beyond the start of wave 1. It would require a significant reworking of my analysis. But is it a true signal?

As I noted in last Saturday’s post, “A Funny Thing Happened“, the S&P 500 is a family of products, and sometimes they diverge. They major three are the index itself, the exchange-traded fund SPY and the E-mini futures. I track the futures in my daily analysis because they provide a lot of after-hours trading and so my chart avoids the annoying gaps that we see, especially, in the index itself, which trades only during market hours.

The S&P 500 index and SPY didn’t  break above the Primary wave 2 level. So I consider that aspect of the breakout to be too close to call. Ultimately I need agreement among all three of the major products before accepting a breakout to be a true signal. The vote now is one in favor a breakout, two against.

What is the alternative?  Any analysis of alternatives relies on whether the breakout above the start of Minor wave 1 was a true signal.

Read More »

Live: Tuesday, July 14, 2020

10:15 a.m. New York time

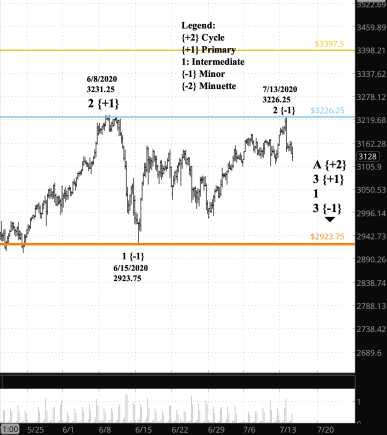
What’s happening now? The S&P 500 E-mini futures reached a peak of 3226.25 at 1:37 p.m. New York time on Monday, then began a rapid decline a low of 3140.50 two hours later, a decline of 2.7%. It has continued to decline this morning.

What does it mean? It appears that the upward drive from Sunday afternoon was a last effort in the upward correction that began on June 15. I’ve marked the peak with a blue line, since any resumption of the rise to beyond that level would change my interpretation of the chart. It will take a drop below the beginning of the rise, from 2923.75, to confirm that the correction has ended.

Screen Shot 2020-07-14 at 7.11.32 AM
S&P 500 E-mini futures, 4-hour bars

What does Elliott wave theory say? The present decline appears to be the early stages of Minor wave 3 to the downside. Each time I’ve thought that, the price has reversed and move to a higher high, showing Minor wave 2 was still underway. Minor wave 3 will be confirmed when the price drops below the end of Minor wave 1, which is 2923.75 (the red line). That’s about 200 points away. Nonetheless, I have changed the labeling to reflect the Minor wave 3 hypothesis.

What is the alternative? A move above 3226.25, the Minor wave 2 high, would mean the Minor 2 is still underway. However, there is only 5 points of upside remaining to the Minor wave 2 correction. If it were to cross 3231.25, then under the rules of Elliott wave analysis it would mean that Primary wave 2, which began March 23, is still underway. I don’t consider it to be likely, but unlikely isn’t the same as impossible.

What about my trades? Still holding off on options until Intermediate wave 3 to the downside.

Read More »

Live: Monday, July 13, 2020

10:05 a.m. New York time

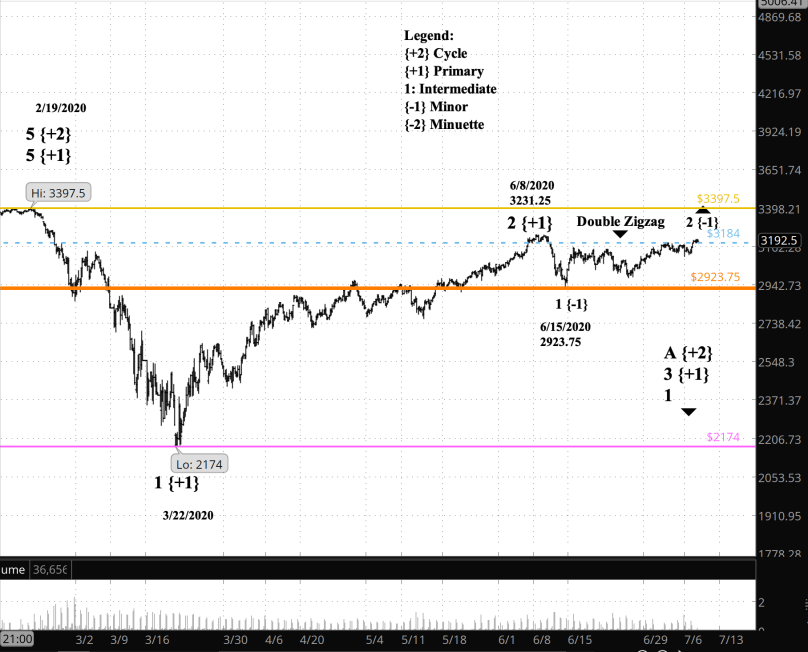
What’s happening now? The S&P 500 E-mini futures on Sunday joined the index and the exchange-traded fund SPY in breaking above the peak of July 6 (The dotted blue line on the chart; see “A Funny Thing Happened“, posted Saturday).

What does it mean? The break above that shows that the correction that began June 15 is continuing, although its upside potential is severely limited. A push above the start of  the major decline that began February 19, at 3397.50 (tan line), would mean that the major decline was over, having proven less major than my analysis at its outset had shown. Should that occur, then I would expect to see a continuation, in a very late stage, of the market rise that began in December 1974.

What does Elliott wave theory say? The breakout past the peak of what I had labeled as the Minor wave of 2nd degree means that Minor 2 is tracing a double zigzag pattern, a common sight in 2nd waves. By my count, internally the price is tracing the Minuette C wave — the final wave — of the second zigzag. From there, the next step is either a continuation of the correction as a triple zigzag, or the end of the correction and the beginning of Minor wave 3 to the downside.

Screen Shot 2020-07-13 at 7.02.39 AM
S&P 500 E-mini futures, 4-hour bars.

The end of Minor 3 will be followed by a Minor 4 upward correction and then a Minor wave 5 to the downside, which at its terminus will signal the end of Intermediate wave 1, a degree higher.

What is the alternative? The break-out above the June 15 peak has resolved the ambiguities for now. I see no alternatives.

What about my trades? Patiently awaiting Intermediate wave 3, or possibly Minor wave 3, depending upon the timing of things at it relates to the options calendar.

Read More »

A Funny Thing Happened

4:30 p.m. New York time

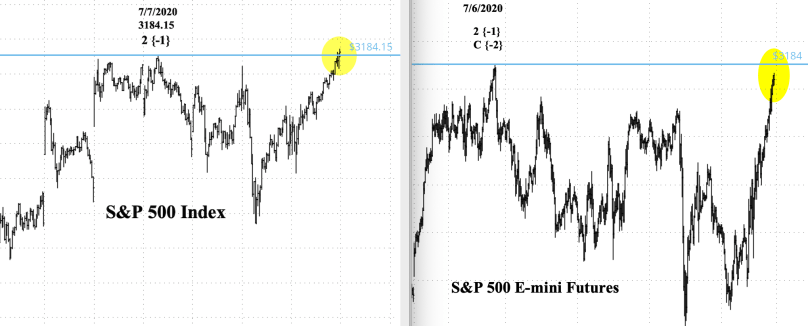
A funny thing happened on the way to the weekend. The reversal point of July 6, the point at which an upward correction ended and the main trend downward reserved, was pierced on Friday, at the end of trading, by the S&P 500 index.

That in itself isn’t strange, except that the S&P 500 E-mini futures, the main object of my daily analysis, fell short of the turning point. Here’s a chart comparison:
Screen Shot 2020-07-11 at 11.04.33 AM

The difference is important in Elliott wave analysis, the method I use to place “You Are Here” sign that brings some order out of the chaos of market price movements. If a 3rd wave in the direction of the main trend breaks beyond its own starting point, then that suggests that the preceding wave 2nd wave is still in progress.

The index broke past its starting point. The futures did not. Both are part of the large ecosystem that relies on the prices 505 stocks issued by 500 companies. It is those stock prices, weighted by capitalization, that make up the index and all products derived from it.

When Elliott developed his analysis, between 1938 and 1946, the blue chips index was the Dow Jones Industrial Average. When people spoke of what the “market” was doing, they meant the Dow. There were no related products to confuse the issue.

Today, it’s different. The S&P 500 index is the primary means of assessing the blue chip stocks, and if the index is the sun, then it is surrounded by a generous solar system of orbiting derivatives: At least 14 exchange-traded funds, some which move inversely to the index, some of which are weighted, and some of which are both, and the the E-mini futures, the most recent contract expiring September 18. And there are of course options on the index and on the exchange-traded fund SPY, the most important of the ETFs.

The problem isn’t that there are differences among the charts for each derivative — it would be shocking if they didn’t diverge a little, given the complex differences in price setting among so many products.

Instead, the question is how, under Elliott’s rules, should the divergence be treated? It’s more than a little nonsensical to think of the S&P 500 index as being in an upward correction wave while its futures are in a downward motive wave. It’s like a an Orwellian 1984 world where Winston Smith says he sees four fingers, not five. “And if the Party says that it is not four but five -— then how many?, asks the high rank party member O’Brien. “Sometimes they are all of them at once.”

Not living in Oceania, happily, we don’t have to endure such a paradox. As traders we get to decide how to interpret the evidence within the bounds of rationality.

I compared three major S&P 500 products. The July 10 low was the peak reached at the end of trading, shortly before all three products shut down trading for the weekend. The July 6 signal line is the peak on that date that I counted as the end of Minor wave 2 within a larger upward correction.

SYM
7/10 HIGH
7/6 SIGNAL LINE
THROW-OVER?
7/10 HIGH FROM  SIGNAL (absolute)
DISTANCE, MEAN %
E-mini futures 3181.25 3184.00 no 0.086% 0.00149
index 3186.87 3184.15 yes 0.085% 0.00022
SPY x 10 3178.80 3176.80 yes 0.063% 0.00000

Of the three products, two had a throw-over past the July 6 signal line: The index itself and the exchange-traded fund SPY (I’ve multiplied the SPY prices by 10 to give them the same magnitude as the other two products. The “7/10 High from Signal” column shows the distance from the signal line as a percentage, and the “Distance Mean %” column shows the divergence from the percentage mean of the three products (the index at -0.085%).

An inverse S&P 500 exchange-traded fund, SDS, also moved beyond the signal line, as did the NASDAQ index. the Down Jones Industrial average, however, did not break through the signal point.

The breakthrough is really not very deep. the distance is so small that a random sample poll would be hard to keep it beyond the margin of error. To put it in perspective: A national opinion poll of voters, to obtain a 3% margin of error (6% confidence interval), would need to interview 0.4% of the nation’s 255.2 million voters, or 1.0 million people.  To obtain the 0.172% confidence interval (0.086%) of the three products I analyzed, would need to interview 93% of the nation’s 255.2 million voters, or 236.6 million people. In both cases I used a 95% confidence level.

So, when futures trading resumes Sunday evening, I’m going to consider the count too close to call. Brand new rule: No signal is actionable unless all three of my major S&P 500 charts agree; the futures, the index, and SPY. Also, I shall leave my futures chart analysis as it is until I see what happens next.

The value of Elliott wave theory doesn’t lie in its ability to forecast the future, which is entirely unknowable. Rather, it is valuable because provides a key to what happens next for each of a several possible interpretations. Elliott at its core teases out the significance of interpretations. It allows us to go beyond the “bull!”, “bear!”, “stocks rose today”, “stocks fell today” cheerleader mentality to a space where the no future is knowable, but the meaning of each possible future is clearly assayable. I find that to be incredibly valuable.

Read More »
Live: Friday, July 10, 2020

10:25 a.m. New York time

What’s happening now? The S&P 500 E-mini futures continues to work its way down in the early stage of a decline that began July 6.

What does it mean? The decline again aligns the index with the major downtrend that began February 19. The price will rise some days and fall in others, but the net direction will be down.

Screen Shot 2020-07-10 at 7.12.46 AM
S&P 500 E-mini futures, 4-hour bars

What does Elliott wave theory say? The Minor wave 3 downward movement since July 6 has taken the form of three complete waves down and is now in wave 4 of a small degree, perhaps Sub-minuette. Minor 3 will push below the starting point of the Minor 1 wave, 2923.75 (the red line). All of this Sturm und Drang has taken place within a declining Intermediate wave 1 that is in turn encompassed by Primary wave 3 to the downside.

What is the alternative? If the present wave, Minor 3, that began July 6 were to reverse and move above the level from which it started (3184 — the blue line), then under the rules of Elliott wave analysis, Minor wave 2 would not yet have reached its conclusion, and what which has happened since July 6 would be a downward correction within the uptrending Minor 2, itself a correction.

What about my trades? My major focus at that time is to decide what Elliott degree should govern my shares of SDS. If I’m correct in thinking that the downtrend will continue for several years at the higher degrees, the the best tax break is to hold the positions,  knowing that my Elliott wave analysis will tell me when that major downtrend has reached its end. Under U.S. law, shares held for more than a year incur a lower tax bill.

Primary wave 1 in this downtrend from February lasted nine days. Primary wave 1 in the Cycle degree uptrend that began December 9, 1974 lasted for 11 years 4 months. That’s quite a difference.

It may mean that the degree labeling is off, although R.N. Elliott found no absolute rules for how long a wave of a certain degree might last. Or it may mean that the time spans show the difference between traders climbing the wall of worry vs. those tumbling down the waterfall of fear. Worry is a chronic condition and can last for a long time. Fear is a rapid response to events.

So, tentatively, I shall use the Primary wave as my major guidance for entering and exiting my share holdings, and adjust it when possible in order to have a holding period of at least a year.

Learning and other resources. Elliott Wave International has long been the leading analytical house based on Elliott wave theory. They make available a number of free educational materials and other resources, in addition to their for-pay subscriptions.

I recommend two books, both by people associated with EWI.

First, Elliott Wave Principle by Robert Prechter and A.J. Frost is the book that, along with Prechter’s analyses, that created the revival of Elliott wave theory. I first read it in 1984, and it has had a profound influenced on my thinking about markets ever since.

Second, I’ve found Visual Guide to Elliott Wave Trading by Wayne Gorman and Jeffrey Kennedy, both of EWI, to be a useful book that relates Elliott wave theory to practical trading. The authors are hands-on Elliotticians, and for an active trader, that’s exactly what’s needed — less theory and more how-to. The first chapter of the book gives a very nice thumbnail run down of what Elliott wave theory is all about.

Terminology. Here are some links to information about some of the technical jargon I use.

Charts. On my charts, waves have a subscript showing the degree above or below the Intermediate degree. Here are the subscripts and the degree each represents:

  • {+3} Supercycle
  • {+2} Cycle
  • {+1} Primary
  • No subscript: Intermediate
  • {-1} Minor
  • {-2} Minute
  • {-3} Minuette

By Tim Bovee, Portland, Oregon, July 10, 2020

Disclaimer

Tim Bovee, Private Trader tracks the analysis and trades of a private trader for his own accounts. Nothing in this blog constitutes a recommendation to buy or sell stocks, options or any other financial instrument. The only purpose of this blog is to provide education and entertainment.

No trader is ever 100 percent successful in his or her trades. Trading in the stock and option markets is risky and uncertain. Each trader must make trading decisions for his or her own account, and take responsibility for the consequences.

License
Creative Commons License

All content on Tim Bovee, Private Trader by Timothy K. Bovee is licensed under a Creative Commons Attribution-ShareAlike 4.0 International License.

Based on a work at www.timbovee.com.

Live: Thursday, July 9, 2020

10:20 a.m. New York time

What’s happening now? The S&P 500 E-mini futures continued its sideways movement.

What does it mean? The chart’s “You Are Here” marker is ambiguous at this point.

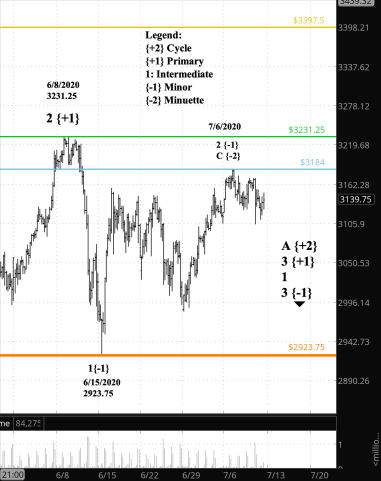
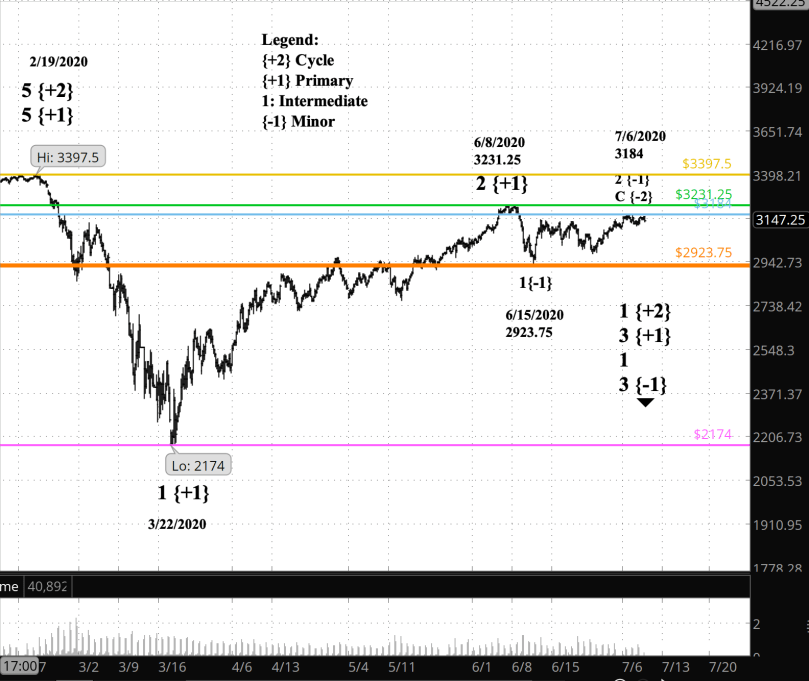
What does Elliott wave theory say? Let’s try to reduce the ambiguity by reducing the problem to a series of alternatives, expressed as If…then statements.

Screen Shot 2020-07-09 at 7.17.49 AM
S&P 500 E-mini futures, 4-hour bars
  • If the price moves above 3397.50 (tan line), the beginning of Primary wave 1, then the decline from February 19 is complete and the upward trend that began in December 1974 is continuing: Cycle wave 5 within Supercycle wave 5 within Supercycle wave 3. I consider this to be a very low probability outcome, but the odds of it happening are greater zero.
  • If the price moves above 3231.25 (green line), the end of Primary wave 2, then Primary 2 is still underway.
  • If the price moves above 3184 (blue line), the end of Minor wave 2, then Minor wave 2 is still underway.
  • If the price moves below 2923.75 (red line), the beginning of Minor wave 2, then Minor wave 3 within Intermediate wave 1 within Primary wave 3 is underway and the drop below that price confirms it.
  • If the price moves below 2174 (purple line), the beginning of Primary wave 2, then Primary wave 3 is definitely underway and drop below that price confirms it. I consider this to be, eventually, a very high probability.

What about my trades? My shares in SDS gain as the S&P 500 drops. I’m waiting on options trades until Intermediate

Read More »

Live: Wednesday, July 8, 2020

10:10 a.m. New York time

What’s happening now? The S&P 500 E-mini futures continue to dither 20 points or so below the channel that began on February 19.

What does it mean? I’ll keep it brief, since it is well covered ground: Topping behavior, a smaller scale decline ahead,  followed by a smaller scale upward correction and then a significant decline.

Screen Shot 2020-07-08 at 6.55.03 AM
S&P 500 E-mini futures, 1-hour bars

What does Elliott wave theory say? Minor wave 3 to the downside began July 6. It is a subwave within Intermediate wave 1, which in turn is a subwave of Primary wave 3. It is Primary 3 that will provide the bulk of the coming decline, carrying prices down to the low 2000s or lower.

What is the alternative?  The price pushes above the July 6 high 3184, extending Minor wave 2 still higher. The wave under the rules of Elliott wav analysis cannot exceed 3231.25, the peak of Primary wave 2.

Learning and other resources. The market’s pause before making a decisive move frees up time to review my favorite subject. Here’s a selection from my book shelf.

Elliott Wave International has long been the leading analytical house based on Elliott wave theory. They make available a number of free educational materials and other resources, in addition to their for-pay subscriptions.

I recommend two books, both by people associated with EWI.

First, Elliott Wave Principle by Robert Prechter and A.J. Frost is the book that, along with Prechter’s analyses, that created the revival of Elliott wave theory. I first read it in 1984, and it has had a profound influenced on my thinking about markets ever since.

Second, I’ve found Visual Guide to Elliott Wave Trading by Wayne Gorman and Jeffrey Kennedy, both of EWI, to be a useful book that relates Elliott wave theory to practical trading. The authors are hands-on Elliotticians, and for an active trader, that’s exactly what’s needed — less theory and more how-to. The first chapter of the book gives a very nice thumbnail run down of what Elliott wave theory is all about.

Terminology. Here are some links to information about some of the technical jargon I use.

Charts. On my charts, waves have a subscript showing the degree above or below the Intermediate degree. Here are the subscripts and the degree each represents:

  • {+3} Supercycle
  • {+2} Cycle
  • {+1} Primary
  • No subscript: Intermediate
  • {-1} Minor
  • {-2} Minute
  • {-3} Minuette

By Tim Bovee, Portland, Oregon, July 7, 2020

Read More »

Live: Tuesday, July 7, 2020

10:20 a.m. New York time

What’s happening now? The S&P 500 E-mini futures bounced back slightly after setting another post-June 8 high.

What does it mean? The pattern looks like topping behavior, in the language of traditional chart analysis. A mentor told me decades ago that such hesitancy on the chart meant there was a balance between bulls and bear.

Screen Shot 2020-07-07 at 7.16.02 AM
S&P 500 E-mini futures, 4-hour bars

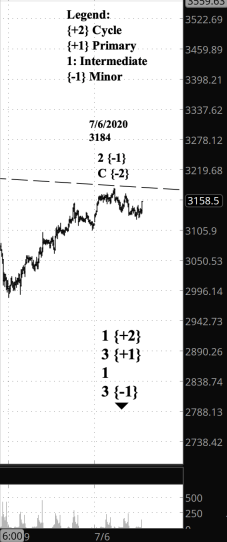
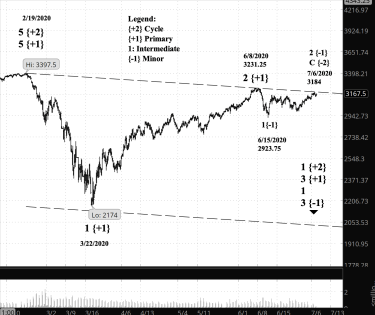
What does Elliott wave theory say? What the traditionalists call “topping” is the end of a rising wave in Elliott wave theory. In this case the wave is Minor wave 2 within Intermediate wave 1 within Primary wave 3, which on June 8 began its mighty descent to come. Minor wave 2 has come within six points of the upper boundary of the Primary degree channel, linking the start of Primary wave 1 on February 19 and Primary wave 3 on June 8.

What is the alternative? Under the rules of Elliott wave analysis, the price of Minor 2 can pierce that upper boundary of the channel — a throw-over — but it cannot pierce the beginning of Minor wave 1 down, which is 3231.25.

What about my trades? I’m waiting until the start of Intermediate wave 3 before entering bear call options spreads on SPY.

Read More »