Two real-estate reports will be published during the week: Housing starts, a forward looking study, on Tuesday at 8:30 a.m. New York time, and existing home sales, on Wednesday at 10 a.m.
Also out during the week, the Purchasing Managers index composite flash report, on Friday at 9:45 a.m.
In Fedworld, Chairman Jerome Powell will take part in a panel discussion at the European Central Bank Forum on Central Banking in Linhó Sintra, Portugal, on Wednesday at 9:30 a.m. New York time (2:30 p.m. local). The event will be streamed live here.
Update 7/10/2018: I have exited ARKG for a small profit. My fundamental reason for buying ARKG — growth of the genetics sector — remains valid. However, we have been in a bear market since Jan. 26, and ARKG has moved into a down wave. I took my chips off the table — temporarily — in order to let that wave do its work without impacting me, and I shall jump back in once that wave is complete.
Shares produced a net rise of 3.1% over my 25-day holding period, for a +46% annual rate.
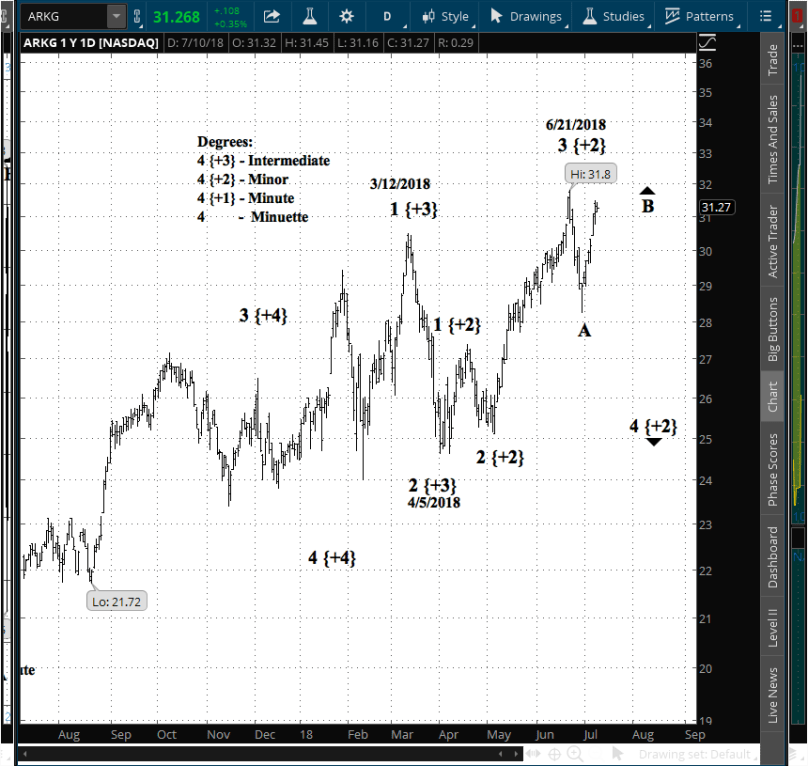
The ARKG chart below, covering one year with daily bars, shows that at the Minor degree the stock is in an uptrend and has begun a counter-trend correction at the Minute and Minuette degrees.
The 4th wave is generally a sideways movement, and often a complex one. That means a shallow correction but one that will take some time to complete. It will be followed by a 5th wave rise to new highs.
My plan is follow the Minute wave and trade the reversal to the upside of the Minor wave.
Update 6/17/2018: After buying into ARKG I have spent the weekend learning more about the fund’s creator and manager, ARK Investment Management LLC. Among my finds was this half-hour interview with ARK’s CEO, Catherine D. Woods, in which she discusses the company’s disruptive technologies themes. Interesting ideas.
I have entered a long shares position on ARKG, one of the few exchange-traded funds with an uptrending Fisher Transform and a visual trend on the annual chart to match.
I have structured it as a longer-term trade, a traditional buy-and-hold. The chart doesn’t follow the normal movements of the broad market, and in this bear market, I judge that outliers give the best prospects.
I screened for it in the simplest possible way: Listing all of the available exchange-traded funds, the huge majority of which are downtrending, and looking at those few with an uptrending Fisher. After that, it was just a matter of skimming through the charts.
The fund has no Zacks rank but is considered to be high risk. It pays no dividend and has no options. Morningstar gives it a 3-star rating.
The entry price was $30.22.
Atypically for me, ARKG is a story trade. I’m fascinated by genomics and all the useful information that can be harvested from a genetic test. Like millions of others, I’ve been tested by 23andMe (Wikipedia article), and have learned more about myself, my limits and gifts, my likely health challenges and I age, than my parents could have ever hoped to know.
Running my testing results through Promethease, I linked my results to the broad scientific literature tracked by SNPedia (Wikipedia article) for an even deeper knowledge of myself.
After much reading, I’m convinced that this tech is the Next Big Thing, and I want to go along for the ride. Plus, ARKG is classified as a Health Care ETF. I judge that we are in the last stage of the expansion that began in October 2009, a stage in which Health is a sector that does well.
ARKG is newly uptrending on the monthly Fisher Transform, and I shall use a switch to downtrending on that indicator as a signal to pull out temporarily.
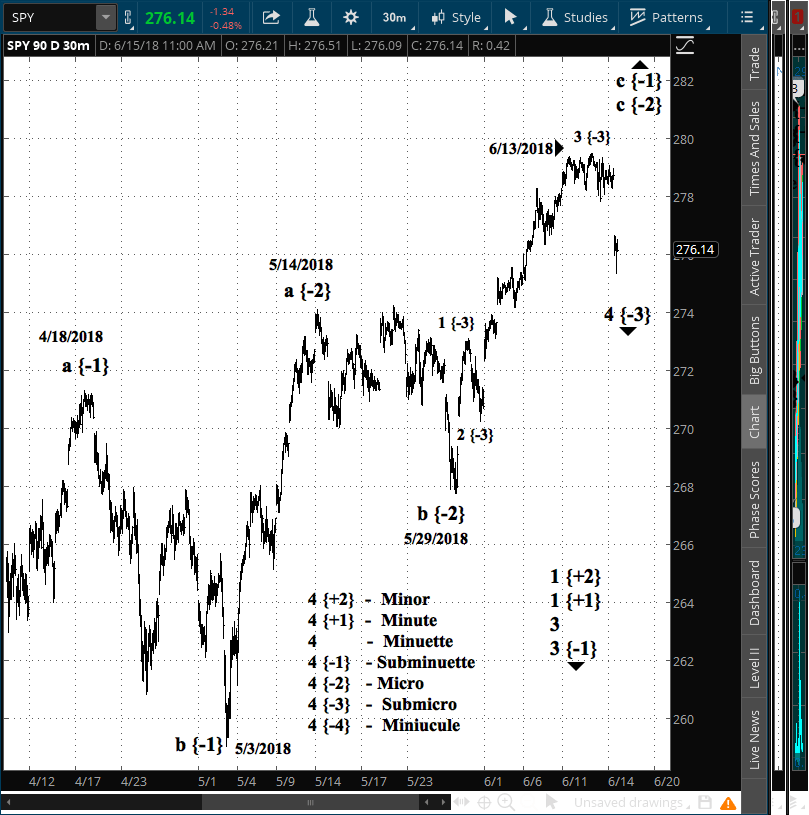
The rising 3rd wave of the Submicro degree (3 {-3}) on the SPY chart has ended, peaking on June 13 at $279.48. The reversal happened with an opening gap, and such gaps generally are a shout-out that a significant reversal has begun.
Further underlining the significance of the reversal, the Fisher Transform
The Elliotchart covers 90 days with 30-minute bars.
Elliott wave analysis shows that the next step will be a 4th wave to the downside, and then a final push upward that will complete the C wave of the 4th wave upward correction up to the Subminuette degree (4 {-1+}), and indeed will mark the end of the 4th wave correction at the Minuette degree (4) that began on April 2.
Once that Subminuette 5th wave (5 {-3}) is complete, then I shall re-establish my bear options positions on SPY.
I exited my options positions on SPY yesterday, and today I’m looking at strategies for re-entering. First and foremost, Elliott wave analysis of the chart, which covers 30 days with 30-minute bars.
As the look-ahead in the upper right shows, SPY is in a 3rd wave at the Submicro {-3} degree within a series of C waves at high degrees. That means thee is some work to be done, and re-entry won’t happen quickly.
The next move at the Submicro is a 4th wave correction to the downside, followed by a 5th wave up to the peak, completing the C waves up to the Subminuette{-1} degree, and possibly completing the 4th wave rising correction in the Minuette degree, although as 4th waves have a tendency to do, it could well extend into a more complex pattern.
I’m not interesting in re-entering with a bear play until I see what happens after the completion of the higher degree C waves. If it extends I shall try to play the Subminuette. If the correction is over, then I shall hop aboard the Minuette degree 5th wave to the downside.
As always, the signals to sit up and take notice will come from the Fisher Transform. The daily chart is presently uptrending, as it has been since June 1, and the monthly chart is downtrending, as it has been since January. My practice is to trade in the direction of the monthly chart, while the daily chart, when it aligns with the monthly, tells me to reassess the Elliott wave analysis to determine if it is a favorable place to re-enter.
Having exited my options positions on SPY, my task tomorrow will be to set criteria for re-entry.
12:40 p.m. New York time
I have updated my analyses of SPY positions, which I exited, with results. Look for them here and here.
10:05 a.m. New York time
I have exited my options positions on SPY (here and here) with the intention of rolling back in when the downtrend resumes. I shall update their analyses with results shortly.
I am retaining my shares position in the S&P 500 inverse fund SPXU.
The Federal Open Market Committee begins a two-day meeting on Tuesday, which culminates on Wednesday at 2 p.m. New York time with the announcement on interest-rate targets and the release of in-house economic forecasts, and then with a news conference with Fed Chairman Jerome Powell at 2:30 p.m.
The FOMC in March raised its target Fed Funds Rate by 25 basis points to a 1.5%-1.75% range, having raised rates by the same increment three times in 2017, once in 2016 and one in 2015. Before that was the six-year Great Recession hiatus on target changes. The market yield on 10-year Treasury notes compared with 10-year inflated-protected Treasuries implies inflation of 2.13%.
Major economic reports out during the week:,The consumer prices on Tuesday and producer prices (final demand) on Wednesday and retail sales on Thursday, each at 8:30 a.m., and industrial production on Friday at 9:15 a.m.
Given the fact that SPY remains below the peak of the rise from May 29, I’ve decided to wait until Monday to roll out of my options positions on SPY in hopes of a further decline. As long as SPY remains below $278.28 — the Aug. 7 high — that level can be interpreted, using Elliott wave analysis, as the peak of wave 3 to the upside at the Submicro level {-3}.
10:10 a.m. New York time
SPY has opened the morning lower while remaining within yesterday’s range. I anticipate no trades today.
I have an error on the chart below. The listings in the box of wave labels in the upper right-hand corner were incorrect.
In looking at the chart, if the start of wave 1 in the Minor degree is exceeded, then the next count will be to consider wave 2 {+3} to still be underway, with the 1 {+3} labeled replaced by an A {+2} and the subsequent move forming a zig-zag to the upside. Maybe. We shall see, and maybe a recount won’t be needed.
10:55 a.m. New York time
This morning’s lede is identical to yesterday’s: “SPY opened a bit higher this morning compared to the prior day’s range, and then began declining. At this point there has been no change in the Elliott wave analysis or the Fisher Transform signals.”
My two options positions (here and here) expire in eight days. Typically in such cases I will roll out, taking the loss if needed, on Friday or Monday. I shall decide which on Friday.
This morning I stepped back to look at the big picture. Normally I’m more short-term oriented in my trading, but the longer term has become relevant, as the chart below shows.
The reason is wave 2 {+3} that has been underway since April 2. The textbook of the discipline, The Elliott Wave Principle by Robert Prechter and A.J. Frost, contains this rule: “Wave 2 never moves beyond the start of wave 1”. If a chart shows that happening, then the wave count on the chart has been shown, by the unfolding of events, to be incorrect.
That’s a long away of saying that Elliott wave analysis has a lot of ambiguity. I find it to be useful, and also very, very frustrating.
The chart shows wave 1 of the Minor degree ({+3}) beginning at $280.41 on March 13. The price presently stands at $277.32 , a retracement exceeding the 78.6% Fibonacci level. That means that the present count can allow only an additional rise of $3.09 before the price must reverse into a B wave to the downside in the Minor degree ({+2}). If that fails to occur, then it’s time for a recount.


You must be logged in to post a comment.