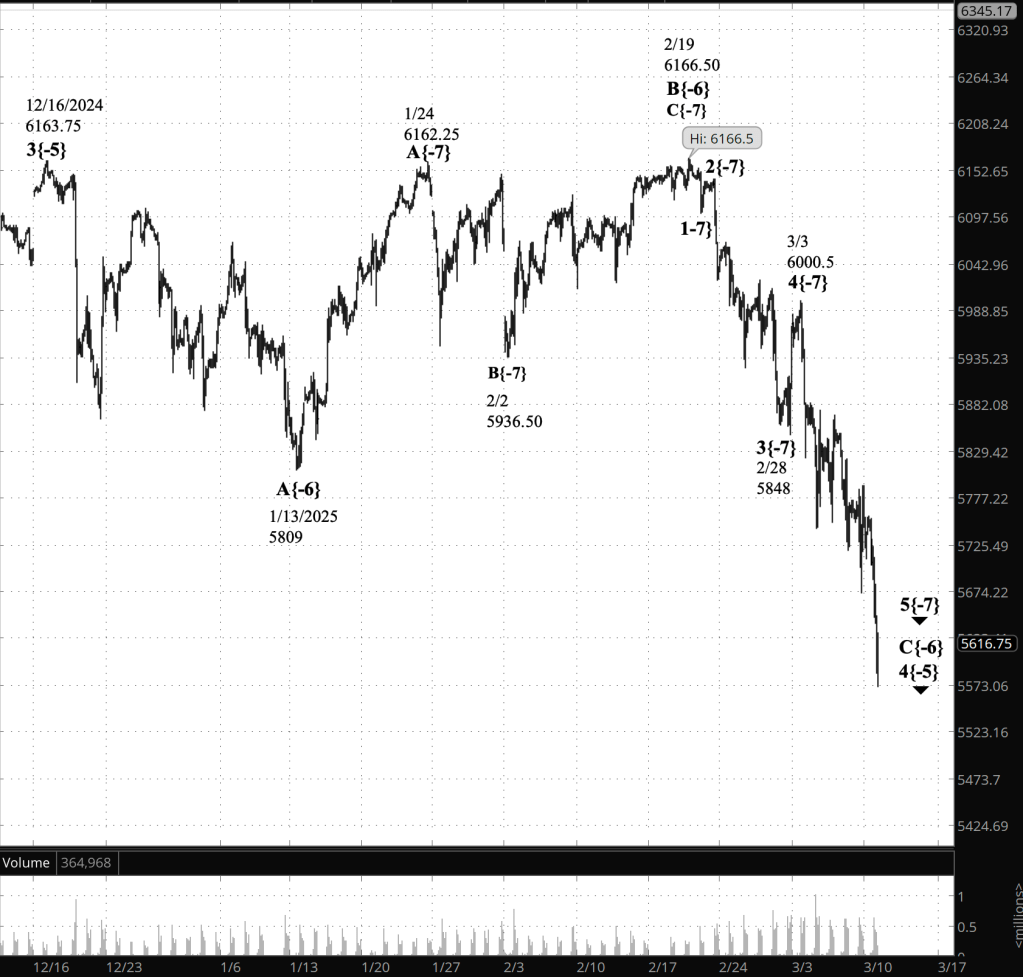
Half an hour before the closing bell. The S&P 500 futures fell during the session, reaching into the 5570s. Applying Elliott Wave Theory, the present decline is a C wave that began on February 19 from 6166.50. Altogether, the decline has cut 9.6% from the price.
Internally, wave C is in its final subwave, wave 5. When wave 5 is complete, wave C and the parent wave, a much larger declining 4th wave that began on December 16, 2024 will also be complete.
9:35 a.m. New York time
What’s happening now? The S&P 500 E-mini futures reached a high of 5757.75 after trading resumed overnight, and then fell, reaching the 5680s.
What does it mean? I adjusted the end of wave 3{-7} from March 4 to February 28, providing a more proportional wave 4{-7}, which ended on March 3 at 6000.50. Proportionality is an important tool in Elliott Wave Theory.
[S&P 500 E-mini futures at 3:30 p.m., 2-hour bars, with volume]
What is the alternative? I’ve found the decline that began on February 19 form 6166.50 to be particularly difficult to puzzle out. In place of the wave 3 and 4 changes I made today, I can also imagine wave 3 still being underway, with wave 4 not yet begun. There are some ambiguities still.
What does Elliott Wave Theory say? Here are the waves that underlie the morning’s analyses as they appeared on the chart.
Principal Analysis
Falling wave C{-6} within falling wave 4{-5} continues.
Falling wave 5{-7} is underway.
When wave 5{-7} ends, it will also be the end of waves C{-6} and 4{-5}.
Rising wave 5{-5} will begin, likely carrying the price to new heights.
Long-term Waves.
These are the waves currently in progress under my principal analysis. Each line on the list shows the wave number, with the subscript in curly brackets, the traditional degree name, the starting date, the starting price of the S&P 500 E-mini futures, and the direction of the wave.
S&P 500 Index:
5{+3} Supercycle, 7/8/1932, 4.40 (up)
5{+2} Cycle, 12/9/1974, 60.96 (up)
5{+1} Primary, 3/6/2009, 666.79 (up)
5{0} Intermediate, 2/11/2016, 1810.10 (up)
3{-1} Minor, 3/23/2020, 2191.36 (up)
3{-2} Minute, 10/13/2022, 3491.58 (up)
S&P 500 Futures
5{-3} Minuette, 4/18/2024, 4963.50 (up)
3{-4} Subminuette, 8/7/2024, 5182 (up)
4{-5} Micro, 12/16/2025, 6163.75 (down)
C{-6} Submicro, 2/19/2025, 6166.50 (down)
5{-7} (no name), 3/3/2025, 6000.50 (down)
Reading the chart. Price movements — waves – – in Elliott Wave Theory analysis are labeled with numbers within trending waves and letters with corrective waves. The subscripts — numbers in curly brackets — designate the wave’s degree, which, in Elliott Wave analysis, means the relative position of a wave within the larger and smaller structures that make up the chart. R.N. Elliott, who in the 1930s developed the form of analysis that bears his name, viewed the chart as a complex structure of smaller waves nested within larger waves, which in turn are nested within still larger waves. In mathematics it’s called a fractal structure, where at every scale the pattern is similar to the others.
Learning and other resources. Elliott Wave analysis provides context, not prophecy. As the 20th century semanticist Alfred Korzybski put it in his book Science and Sanity (1933), “The map is not the territory … The only usefulness of a map depends on similarity of structure between the empirical world and the map.” And I would add, in the ever-changing markets, we can judge that similarity of structure only after the fact.
See the menu page Analytical Methods for a rundown on where to go for information on Elliott Wave analysis.
By Tim Bovee, Portland, Oregon, March 10, 2025
Disclaimer
Tim Bovee, Private Trader tracks the analysis and trades of a private trader for his own accounts. Nothing in this blog constitutes a recommendation to buy or sell stocks, options or any other financial instrument. The only purpose of this blog is to provide education and entertainment.
No trader is ever 100 percent successful in his or her trades. Trading in the stock and option markets is risky and uncertain. Each trader must make trading decisions for his or her own account, and take responsibility for the consequences.
45-minutes before the closing bell. Closing of early today.
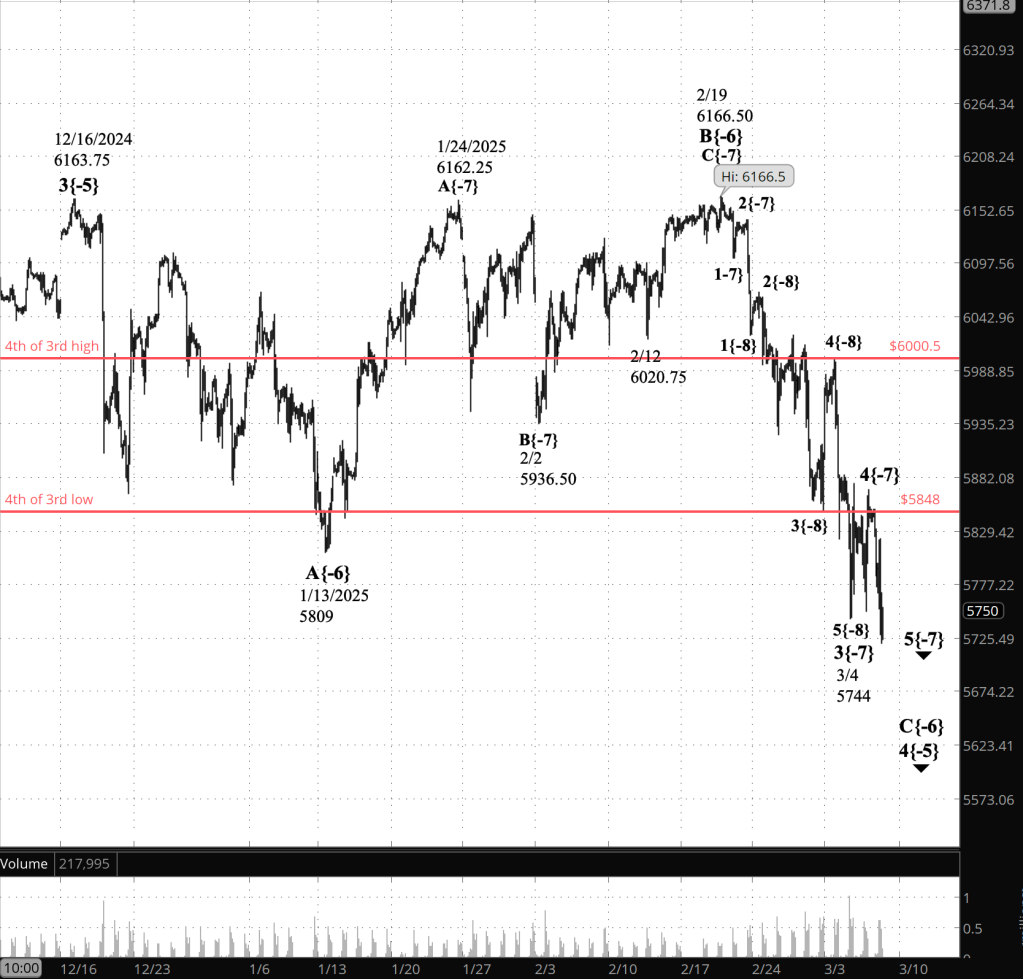
The S&P 500 futures rose during the session, reaching into the 5790s. Elliott Wave Theory: The rise is a subwave within the falling 5th wave that began on March 5.
9:35 a.m. New York time
What’s happening now? The S&P 500 E-mini futures fluctuated narrowly from the 5750s to the 5770s in overnight trading, dropping a bit further as the time for a major economic announcement approached. When the employment situation report was released an hour before the opening bell, the futures whipsawed down to the 5730s and up to the 5780s before retreating to the narrow range where it had spent most of the night.
What does it mean? Elliott Wave Theory sees the whipsaw as a subwave one or two degrees down from its parent wave, the downtrending 5th wave that began on March 5 from 5869.50. That 5th wave, in turn, is the final subwave of a falling C wave that began on February 19, from 6166.50.
The parent wave of both is a 4th-wave downward correction that began on December 16, 2024, from 6163.75
That’s a long, detailed way of saying that the futures have had a net downward tilt since mid-December, and that will be with us until the present falling 5th wave comes to an end.
At that point, the end of wave 5 is also the end of wave C and, most likely, the end of wave 4, which encompasses the entire downward tilt that began on December 16, 2024.
I hedged when I said it would “likely” be the end of the 4th wave. Most corrective waves are built from a single corrective pattern, a simple form. But some take a compound form, containing two or three corrective patterns. There’s no way to predict a compound correction. We know it after it is underway.
Simple or compound, the end of wave 4 will be followed by an uptrending 5th wave that will likely return the price to the 6160s and perhaps once higher.
Note the hedge on how high wave 5 might reach. Most 5th waves will move beyond the starting point of the previous 4th wave. But not all. Some 5th waves are truncated, falling short of the 4th-wave’s endpoint. And some will move further, beyond a level that seems reasonable — an extended 5th wave.
[S&P 500 E-mini futures at 3:15 p.m., 2-hour bars, with volume]
What is the alternative? The hedges in the previous section layout the alternatives to come. At present, I see no ambiguities.
What does Elliott Wave Theory say? Here are the waves that underlie the morning’s analyses as they appeared on the chart.
Principal Analysis
Falling wave C{-6} within falling wave 4{-5} continues.
Falling wave 5{-7} is underway.
When wave 5{-7} ends, it will also be the end of waves C{-6} and 4{-5}.
Rising wave 5{-5} will begin, likely carrying the price to new heights.
Long-term Waves.
These are the waves currently in progress under my principal analysis. Each line on the list shows the wave number, with the subscript in curly brackets, the traditional degree name, the starting date, the starting price of the S&P 500 E-mini futures, and the direction of the wave.
S&P 500 Index:
5{+3} Supercycle, 7/8/1932, 4.40 (up)
5{+2} Cycle, 12/9/1974, 60.96 (up)
5{+1} Primary, 3/6/2009, 666.79 (up)
5{0} Intermediate, 2/11/2016, 1810.10 (up)
3{-1} Minor, 3/23/2020, 2191.36 (up)
3{-2} Minute, 10/13/2022, 3491.58 (up)
S&P 500 Futures
5{-3} Minuette, 4/18/2024, 4963.50 (up)
3{-4} Subminuette, 8/7/2024, 5182 (up)
4{-5} Micro, 12/16/2025, 6163.75 (down)
C{-6} Submicro, 2/19/2025, 6166.50 (down)
5{-7} (no name), 3/5/2025, 5869.50 (down)
Reading the chart. Price movements — waves – – in Elliott Wave Theory analysis are labeled with numbers within trending waves and letters with corrective waves. The subscripts — numbers in curly brackets — designate the wave’s degree, which, in Elliott Wave analysis, means the relative position of a wave within the larger and smaller structures that make up the chart. R.N. Elliott, who in the 1930s developed the form of analysis that bears his name, viewed the chart as a complex structure of smaller waves nested within larger waves, which in turn are nested within still larger waves. In mathematics it’s called a fractal structure, where at every scale the pattern is similar to the others.
Learning and other resources. Elliott Wave analysis provides context, not prophecy. As the 20th century semanticist Alfred Korzybski put it in his book Science and Sanity (1933), “The map is not the territory … The only usefulness of a map depends on similarity of structure between the empirical world and the map.” And I would add, in the ever-changing markets, we can judge that similarity of structure only after the fact.
See the menu page Analytical Methods for a rundown on where to go for information on Elliott Wave analysis.
By Tim Bovee, Portland, Oregon, March 7, 2025
Disclaimer
Tim Bovee, Private Trader tracks the analysis and trades of a private trader for his own accounts. Nothing in this blog constitutes a recommendation to buy or sell stocks, options or any other financial instrument. The only purpose of this blog is to provide education and entertainment.
No trader is ever 100 percent successful in his or her trades. Trading in the stock and option markets is risky and uncertain. Each trader must make trading decisions for his or her own account, and take responsibility for the consequences.
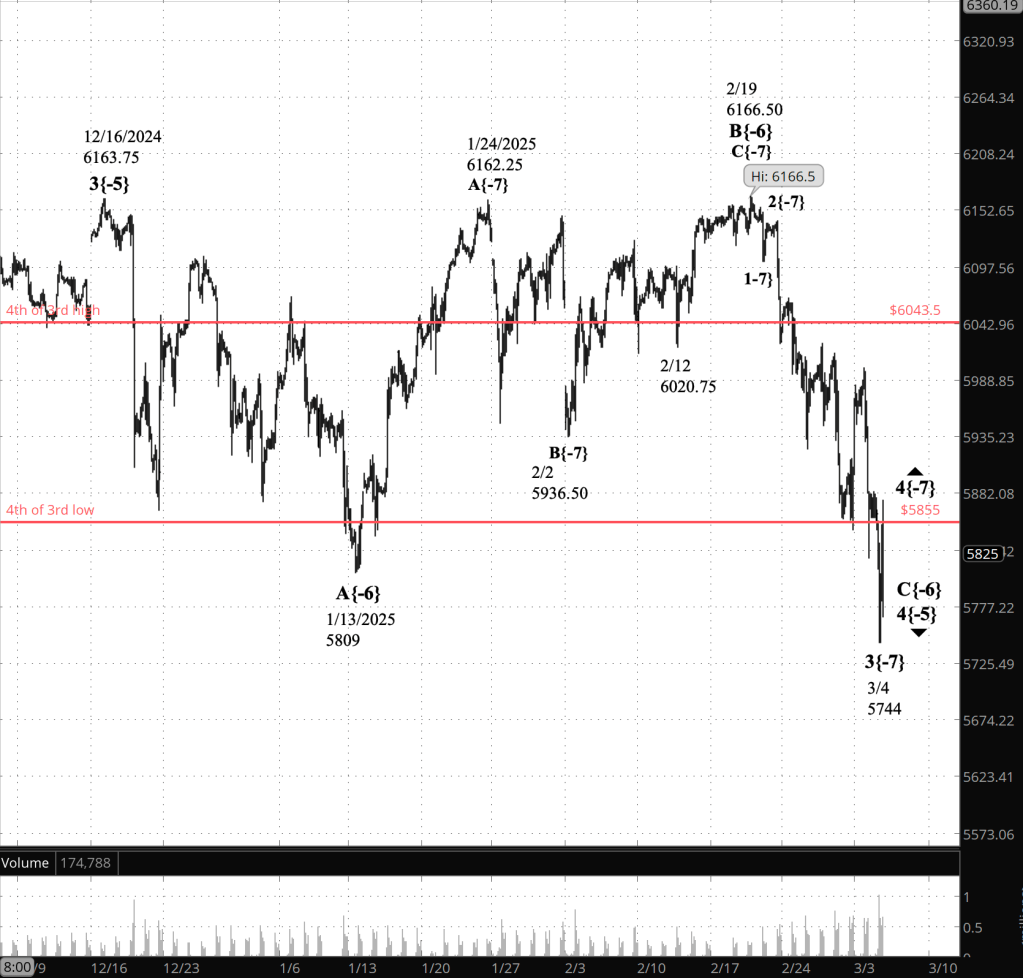
Half an hour before the closing bell. The S&P 500 futures, after rising early in the session, began to fall, reaching into the 5720s.
That lower level is below the start of the 4th wave (wave 4{-7} on the chart), signalling that the 5th and final wave of the C wave within a larger downward correction, wave 4{-5), has begun.
9:35 a.m. New York time
What’s happening now? The S&P 500 E-mini futures fell overnight, from the 5850s to the 5760s.
What does it mean? The early subwaves of the 4th-wave upward correction that began on March 4 continues.
In Elliott Wave Theory, a 4th wave often reach completion within the 4th subwave of preceding 3rd wave. The 3rd wave in question is labeled wave 3{-7} on the chart, and I’ve indicated the upper and lower boundaries of wave 4{-8} — the 4th of 3rd — in red.
So the present 4th-wave upward correction is likely to end somewhere in the neighborhood of 5848 and 6000.50, with allowance made for the occasional breakout.
The upward correction is a subwave of the final subwave of of the larger downward correction, wave 4{-5} on the chart, which began on December 16, 2024, from 6163.75.
That larger 4th wave, when complete, will be followed by a rising 5th wave that will most likely move above the starting point of the 5th wave, perhaps significantly so.
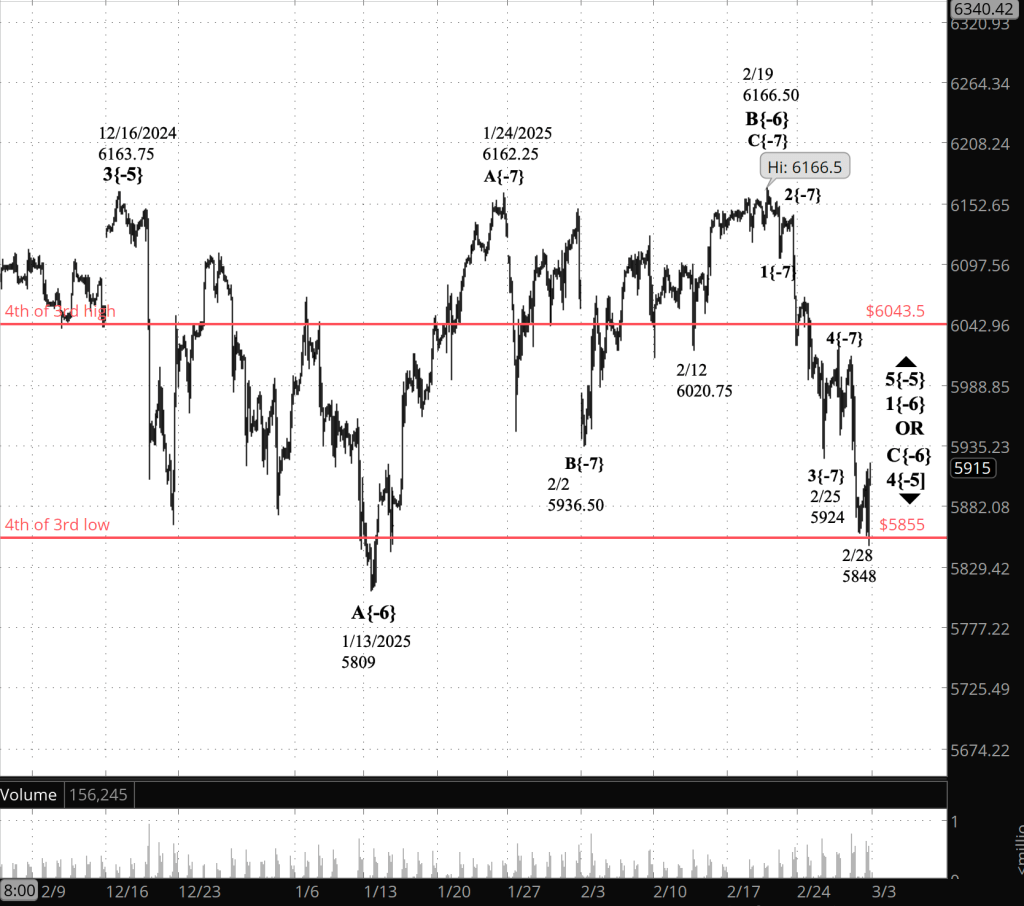
[S&P 500 E-mini futures at 3:30 p.m., 2-hour bars, with volume]
What is the alternative? If the present smaller 4th wave, wave 4{-7}, declines past 5744, then the numbering doesn’t match the chart. The wave would be a subwave of wave of declining wave 3{-7}, which would still be underway.
What does Elliott Wave Theory say? Here are the waves that underlie the morning’s analyses as they appeared on the chart.
Principal Analysis
Falling wave C{-6} within falling wave 4{-5} continues.
Rising wave 4{-7} is underway.
Alternative Analysis
Falling wave 3{-7} is underway.
Long-term Waves.
These are the waves currently in progress under my principal analysis. Each line on the list shows the wave number, with the subscript in curly brackets, the traditional degree name, the starting date, the starting price of the S&P 500 E-mini futures, and the direction of the wave.
S&P 500 Index:
5{+3} Supercycle, 7/8/1932, 4.40 (up)
5{+2} Cycle, 12/9/1974, 60.96 (up)
5{+1} Primary, 3/6/2009, 666.79 (up)
5{0} Intermediate, 2/11/2016, 1810.10 (up)
3{-1} Minor, 3/23/2020, 2191.36 (up)
3{-2} Minute, 10/13/2022, 3491.58 (up)
S&P 500 Futures
5{-3} Minuette, 4/18/2024, 4963.50 (up)
3{-4} Subminuette, 8/7/2024, 5182 (up)
4{-5} Micro, 12/16/2025, 6163.75 (down)
C{-6} Submicro, 2/19/2025, 6166.50 (down)
4{-7} (no name), 3/4/2025, 5744 (up)
Reading the chart. Price movements — waves – – in Elliott Wave Theory analysis are labeled with numbers within trending waves and letters with corrective waves. The subscripts — numbers in curly brackets — designate the wave’s degree, which, in Elliott Wave analysis, means the relative position of a wave within the larger and smaller structures that make up the chart. R.N. Elliott, who in the 1930s developed the form of analysis that bears his name, viewed the chart as a complex structure of smaller waves nested within larger waves, which in turn are nested within still larger waves. In mathematics it’s called a fractal structure, where at every scale the pattern is similar to the others.
Learning and other resources. Elliott Wave analysis provides context, not prophecy. As the 20th century semanticist Alfred Korzybski put it in his book Science and Sanity (1933), “The map is not the territory … The only usefulness of a map depends on similarity of structure between the empirical world and the map.” And I would add, in the ever-changing markets, we can judge that similarity of structure only after the fact.
See the menu page Analytical Methods for a rundown on where to go for information on Elliott Wave analysis.
By Tim Bovee, Portland, Oregon, March 6, 2025
Disclaimer
Tim Bovee, Private Trader tracks the analysis and trades of a private trader for his own accounts. Nothing in this blog constitutes a recommendation to buy or sell stocks, options or any other financial instrument. The only purpose of this blog is to provide education and entertainment.
No trader is ever 100 percent successful in his or her trades. Trading in the stock and option markets is risky and uncertain. Each trader must make trading decisions for his or her own account, and take responsibility for the consequences.
Half an hour before the closing bell. The S&P 500 futures rose during the session, so far reaching 5869.50
Elliott Wave Theory: The rise, which is now in its 3rd subwave, lends credence to the principal analysis. Declining wave 3, which began on February 19, ended on March 4, and a 4th-wave upward correction has begun.
9:35 a.m. New York time
What’s happening now? The S&P 500 E-mini futures fell overnight, from the 5840s to the 5770s.
What does it mean? My Elliott Wave analysis yesterday evening (March 4), after my charting capabilities were restored, suggests that the decline is a subwave within the early phases of the 4th-degree upward correction, wave 4{-7} on the chart, that began on May 4 from 5744.
When the 4th-wave correction is complete, then a downtrending 5th wave will carry the price lower, most likely beyond the 5740s. When the 5th wave is complete, it will also be the end of its parent C wave and of a larger downward correction, wave 4{-5} on the chart.
My conclusion: There’s rising potential for the near term but even greater declining potential afterward.
Of course, no wave lasts for ever. Wave 4{-5} on the chart will be followed by a rising 5th wave that will carry the price higher, most likely into the 6160s and beyond.
[S&P 500 E-mini futures at 9:35 a.m., 2-hour bars, with volume]
What is the alternative? If the present smaller 4th wave, wave 4{-7}, declines past 5744, then the numbering doesn’t match the chart. The wave would be a subwave of wave of declining wave 3{-7}, which would still be underway.
What does Elliott Wave Theory say? Here are the waves that underlie the morning’s analyses as they appeared on the chart.
Principal Analysis
Falling wave C{-6} within falling wave 4{-5} continues.
Rising wave 4{-7} is underway.
Alternative Analysis
Falling wave 3{-7} is underway.
Long-term Waves.
These are the waves currently in progress under my principal analysis. Each line on the list shows the wave number, with the subscript in curly brackets, the traditional degree name, the starting date, the starting price of the S&P 500 E-mini futures, and the direction of the wave.
S&P 500 Index:
5{+3} Supercycle, 7/8/1932, 4.40 (up)
5{+2} Cycle, 12/9/1974, 60.96 (up)
5{+1} Primary, 3/6/2009, 666.79 (up)
5{0} Intermediate, 2/11/2016, 1810.10 (up)
3{-1} Minor, 3/23/2020, 2191.36 (up)
3{-2} Minute, 10/13/2022, 3491.58 (up)
S&P 500 Futures
5{-3} Minuette, 4/18/2024, 4963.50 (up)
3{-4} Subminuette, 8/7/2024, 5182 (up)
4{-5} Micro, 12/16/2025, 6163.75 (down)
C{-6} Submicro, 2/19/2025, 6166.50 (down)
4{-7} (no name), 3/4/2025, 5744 (up)
Reading the chart. Price movements — waves – – in Elliott Wave Theory analysis are labeled with numbers within trending waves and letters with corrective waves. The subscripts — numbers in curly brackets — designate the wave’s degree, which, in Elliott Wave analysis, means the relative position of a wave within the larger and smaller structures that make up the chart. R.N. Elliott, who in the 1930s developed the form of analysis that bears his name, viewed the chart as a complex structure of smaller waves nested within larger waves, which in turn are nested within still larger waves. In mathematics it’s called a fractal structure, where at every scale the pattern is similar to the others.
Learning and other resources. Elliott Wave analysis provides context, not prophecy. As the 20th century semanticist Alfred Korzybski put it in his book Science and Sanity (1933), “The map is not the territory … The only usefulness of a map depends on similarity of structure between the empirical world and the map.” And I would add, in the ever-changing markets, we can judge that similarity of structure only after the fact.
See the menu page Analytical Methods for a rundown on where to go for information on Elliott Wave analysis.
By Tim Bovee, Portland, Oregon, March 5, 2025
Disclaimer
Tim Bovee, Private Trader tracks the analysis and trades of a private trader for his own accounts. Nothing in this blog constitutes a recommendation to buy or sell stocks, options or any other financial instrument. The only purpose of this blog is to provide education and entertainment.
No trader is ever 100 percent successful in his or her trades. Trading in the stock and option markets is risky and uncertain. Each trader must make trading decisions for his or her own account, and take responsibility for the consequences.
The most capable ThinkOrSwim charting software, which I need for marking Elliott Wave Theory waves,is still down. So the chart will focus on the overnight movement, and I’ll rely on description and an older chart, before the chartng system broke, to clarify the layout.
And my software has been fixed. Here’s an update to the analyses.
5:30 p.m. New York time
[S&P 500 E-mini futures at 5:37 p.m., 2-hour bars, with volume]
The S&P 500 E-mini futures are in the 5820s an hour and a half after the closing bell. With full charting capabilities restored, my analysis leads me to conclude that the day’s low point, at 5744, is the end of the 3rd subwave within the final descending subwave C within the 4th-wave downward correction that began on December 16, 2024.
From this point I’ll refer to the waves as they appear on the chart: A wave number followed by a subscript in brackets telling the wave’s position in relation to Intermediate degree.
Using that nomenclature, the low was the end of wave 3{-7} within wave C{-6} within wave 4{-5}, the downward correction that began in December.
With the restoration of better charting, the subwaves within wave 3{-7} have attained clarity. With wave 3{-7} complete, rising wave 4{-7} is now underway, and it will be followed by downtrending wave 5{-7}, which will carry the price to the end of wave C{-6}, and possibly, of wave 4{-5}.
More tomorrow at the opening bell.
3:30 p.m. New York time
Half an hour before the closing bell. The S&P 500 futures it the low of the day, 5744, early in the session and then rose steadily into the 5680s.
Elliott Wave Theory: The price has reached the neighborhood of lower level of the 4th subwave within the prior 3rd wave. That’s significant because the 4th waves, such as the correction that has been ongoing since December, tend to reach completion within that range. This is the first return to that range since the current 4th wave overshot the lower level of expected completion in late February.
Does this entirely clear the ambiguity about how to level the waves in our chart? Not really. But it’s a bullish step.
9:35 a.m. New York time
What’s happening now? The S&P 500 E-mini futures rose overnight into the 5870s, where it stayedfor the first half of the period before declining into the 5810s.
What does it mean? Elliott Wave Theory: The chart continues bottom fishing, seeking an endpoint to the decline that began on February 19, the left-most peak on the chart..
That declining wave is C{-6}, and so far it is tracing out its final subwave, wave C{-7}, which in turn is tracing out its 5th subwave, according to one scenario. Another scenario has it that the 5th subwave has ended at whatever the latest low is.
When the two subwaves are complete, it will likely be the end of wave 4{-5}, a downward correction that began on December 16, 2024.
Today’s Chart
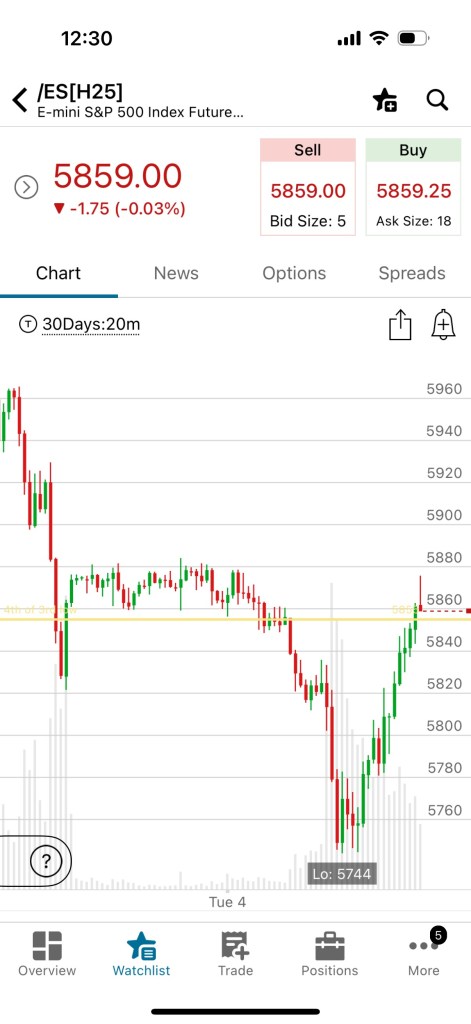
Screenshot
[S&P 500 E-mini futures at 3:30 p.m., 20-minute bars, with volume]
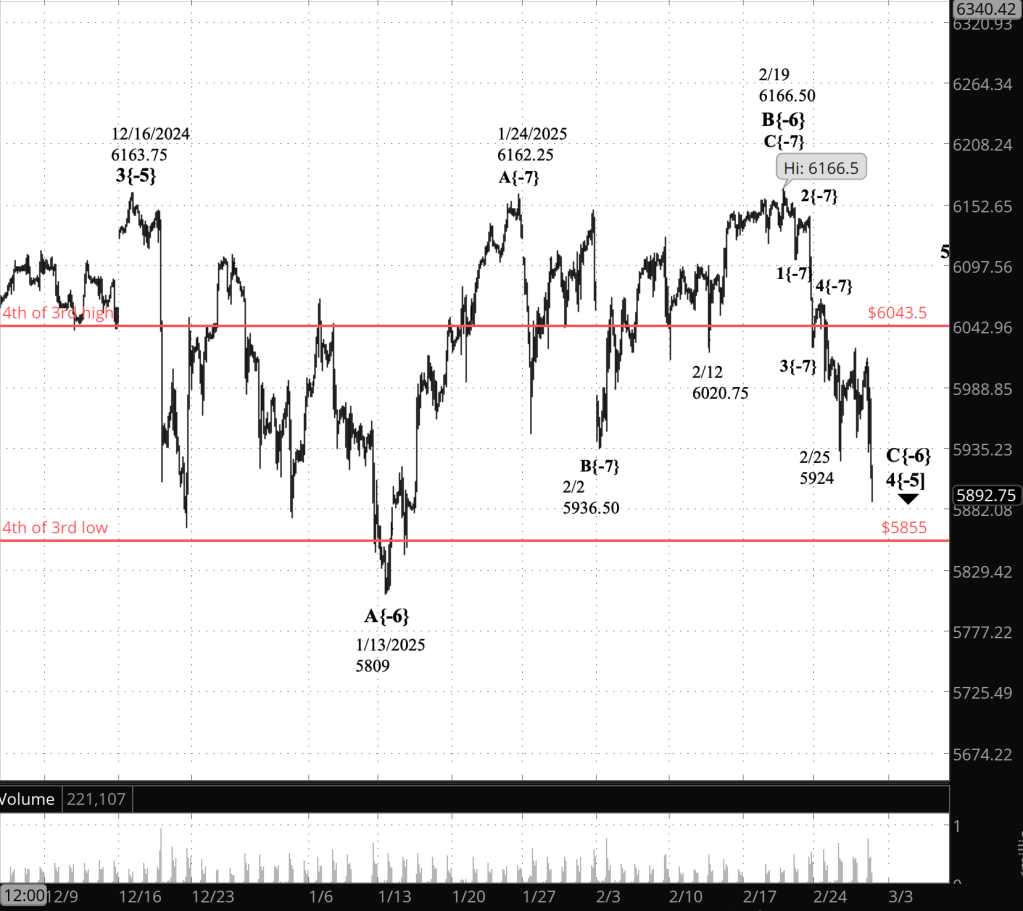
February 28 Chart
[S&P 500 E-mini futures at 3:30 p.m., 2/28/2025, 2-hour bars, with volume]
Reading the chart. Price movements — waves – – in Elliott Wave Theory analysis are labeled with numbers within trending waves and letters with corrective waves. The subscripts — numbers in curly brackets — designate the wave’s degree, which, in Elliott Wave analysis, means the relative position of a wave within the larger and smaller structures that make up the chart. R.N. Elliott, who in the 1930s developed the form of analysis that bears his name, viewed the chart as a complex structure of smaller waves nested within larger waves, which in turn are nested within still larger waves. In mathematics it’s called a fractal structure, where at every scale the pattern is similar to the others.
Learning and other resources. Elliott Wave analysis provides context, not prophecy. As the 20th century semanticist Alfred Korzybski put it in his book Science and Sanity (1933), “The map is not the territory … The only usefulness of a map depends on similarity of structure between the empirical world and the map.” And I would add, in the ever-changing markets, we can judge that similarity of structure only after the fact.
See the menu page Analytical Methods for a rundown on where to go for information on Elliott Wave analysis.
By Tim Bovee, Portland, Oregon, March 4, 2025
Disclaimer
Tim Bovee, Private Trader tracks the analysis and trades of a private trader for his own accounts. Nothing in this blog constitutes a recommendation to buy or sell stocks, options or any other financial instrument. The only purpose of this blog is to provide education and entertainment.
No trader is ever 100 percent successful in his or her trades. Trading in the stock and option markets is risky and uncertain. Each trader must make trading decisions for his or her own account, and take responsibility for the consequences.
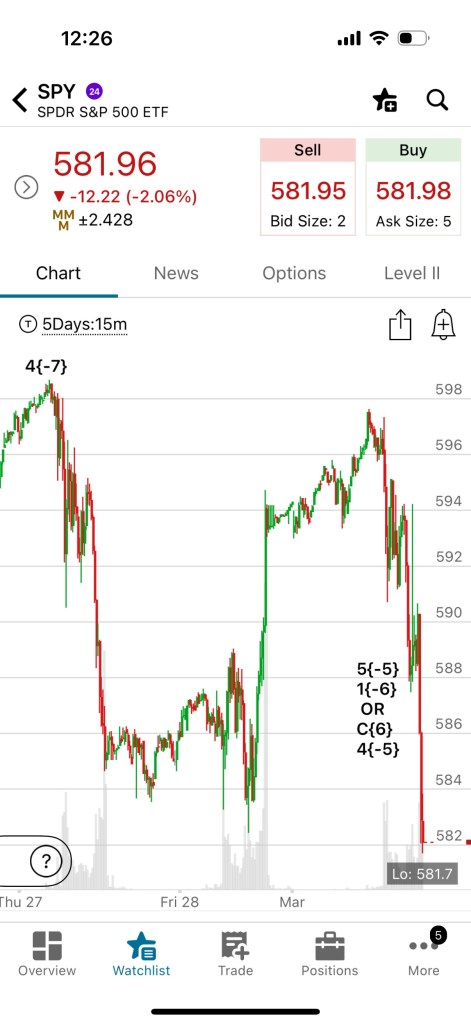
After my charting software failed this morning, forcing a quick workaround, I talked to team about the status. It’s a problem in the system, not particular to my computer, they’re working on it. It’s not fixed yet, so another workaround with a better chart have smaller bars: The iPhone app version, using SPY rather than the futures.
3:30 p.m. New York time
Half an hour before the closing bell. The S&P 500 family of spinoffs continued to fall during the session, reaching a low of 582.07 so far on the exchange-traded fund SPY and 5844.50 on the futures. Elliott Wave Theory analysis: No change to speak of from this morning. The added decline added a bit more weight to the downward scenario, but it’s all up in the air.
Here’s hoping for better charting and greater clarity tomorrow.
[S&P 500 E-mini futures at 3:26 p.m., 3/3/2025, 15-minute bars, with volume]
9:35 a.m. New York time
What’s happening now? The S&P 500 E-mini futures rose when trading resumed overnight, a continuation of a rise that began Friday, February 28, as the closing bell approached.
Friday’s bar is a green bar immediately to the left of the rightmost bar, also green, which is this morning’s opening bar.
Friday’s low was 5848, and the close was 5958. When trading resumed overnight, it opened at 5967.50 and then worked its way higher, so far having peaked at 6000.50.
What does it mean?
Elliott Wave Theory sees the chart this way: The present rise lies at the heart what we knew at Friday’s close. The price was bottom fishing, and any lower low could be the end of one wave and the start of the next.
In the discussion that follows, I’ll use the labeling that appears on yesterday’s chart, in which each wave has a wave number, followed by an indicator of its distance from Intermediate degree in the Elliott Wave system. Intermediate degree began in 2018 as wave 5{0}, and wave 4{-5}, the downtrending correction, is five degrees lower than wave 5{0}.
The decline that reached Friday’s low is labeled wave C{-6}, the final subwave within the larger wave B{-5}, the middle wave 4{-5}, a downward correction that began on February 19 from 6166.50. Wave C and its parent, wave 4 may have ended at that point, 5848, and the following wave 5{-6} may have begun.
Unless it hasn’t ended. the price hasn’t risen very far and could easily whipsaw back to a lower low, wave 6 within wave 4.
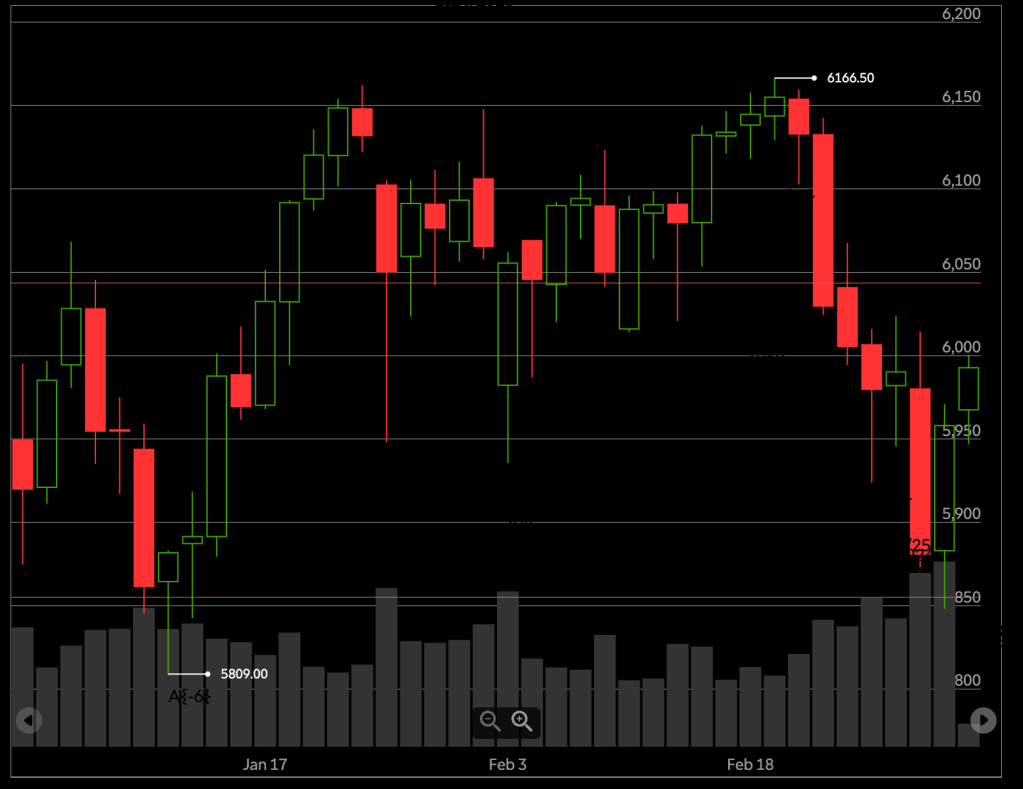
Today’s Chart
[S&P 500 E-mini futures at 9:35 a.m., dailybars, with volume]
Yesterday’s Chart
[S&P 500 E-mini futures at 3:30 p.m., 2/28/2025, 2-hour bars, with volume]
What are the alternatives? I’m staying with the wave 4 continues scenario. I want to see a further rise before I’m persuaded that wave 5 has begun
What does Elliott Wave Theory say? Here are the waves that underlie the morning’s analyses as they appeared on the chart.
Alternative Analysis #1, Wave 4 Scenario:
Wave C{-6} within wave 4{-5} continues.
Alternative Analysis #2, Wave 5 Scenario
Wave C{-6} within wave 4{-5} has ended.
Rising wave 5{-5} has begun.
And there’s another.
Alternative Analysis #3, Wave X Scenario
Wave 4{-5} is taking a comppund form and the connector subwave, wave X{-6}, has begun.
A compound form means that the correction has two or three corrective patterns, each connected with the next by an X wave
Long-term Waves.
These are the waves currently in progress under my principal analysis. Each line on the list shows the wave number, with the subscript in curly brackets, the traditional degree name, the starting date, the starting price of the S&P 500 E-mini futures, and the direction of the wave.
S&P 500 Index:
5{+3} Supercycle, 7/8/1932, 4.40 (up)
5{+2} Cycle, 12/9/1974, 60.96 (up)
5{+1} Primary, 3/6/2009, 666.79 (up)
5{0} Intermediate, 2/11/2016, 1810.10 (up)
3{-1} Minor, 3/23/2020, 2191.36 (up)
3{-2} Minute, 10/13/2022, 3491.58 (up)
S&P 500 Futures
5{-3} Minuette, 4/18/2024, 4963.50 (up)
3{-4} Subminuette, 8/7/2024, 5182 (up)
4{-5} Micro, 12/16/2025, 6163.75 (down)
C{-6} Submicro, 2/19/2025, 6166.50 (down)
Or alternatively,
5{-5} Micro, 2/27/2025, 5855.50 (up)
1{-6} Submicro, 2/27/2025, 5855.50 (up)
And yet another
Wave X{-6}, 2//27/2025, 5855.50 (up)
Reading the chart. Price movements — waves – – in Elliott Wave Theory analysis are labeled with numbers within trending waves and letters with corrective waves. The subscripts — numbers in curly brackets — designate the wave’s degree, which, in Elliott Wave analysis, means the relative position of a wave within the larger and smaller structures that make up the chart. R.N. Elliott, who in the 1930s developed the form of analysis that bears his name, viewed the chart as a complex structure of smaller waves nested within larger waves, which in turn are nested within still larger waves. In mathematics it’s called a fractal structure, where at every scale the pattern is similar to the others.
Learning and other resources. Elliott Wave analysis provides context, not prophecy. As the 20th century semanticist Alfred Korzybski put it in his book Science and Sanity (1933), “The map is not the territory … The only usefulness of a map depends on similarity of structure between the empirical world and the map.” And I would add, in the ever-changing markets, we can judge that similarity of structure only after the fact.
See the menu page Analytical Methods for a rundown on where to go for information on Elliott Wave analysis.
By Tim Bovee, Portland, Oregon, March 3, 2025
Disclaimer
Tim Bovee, Private Trader tracks the analysis and trades of a private trader for his own accounts. Nothing in this blog constitutes a recommendation to buy or sell stocks, options or any other financial instrument. The only purpose of this blog is to provide education and entertainment.
No trader is ever 100 percent successful in his or her trades. Trading in the stock and option markets is risky and uncertain. Each trader must make trading decisions for his or her own account, and take responsibility for the consequences.
The charting platform for these analyses is Charles Schwab’s ThinkOrSwim, the most extensive charting service I used. And this morning, it doesn’t work. Just an error message on the desktop.
Fortunately, there is a browser version of ThinkOrSwim. Sadly, it is extremely limited. So give a time limitations, I have jerry-rigged a solution: I’ll use the browser chart for what’s happening now and a copy of yesterday’s full-featured chart to provide context.
The chart covers th year so far, with daily bars.
A good solution? Hardly. But the clock is ticking, so, Onward!
9:35 a.m. New York time
What’s happening now? The S&P 500 E-mini futures rose when trading resumed overnight, a continuation of a rise that began Friday, February 28, as the closing bell approached.
Friday’s bar is a green bar immediately to the left of the rightmost bar, also green, which is this morning’s opening bar.
Friday’s low was 5848, and the close was 5958. When trading resumed overnight, it opened at 5967.50 and then worked its way higher, so far having peaked at 6000.50.
What does it mean?
Elliott Wave Theory sees the chart this way: The present rise lies at the heart what we knew at Friday’s close. The price was bottom fishing, and any lower low could be the end of one wave and the start of the next.
In the discussion that follows, I’ll use the labeling that appears on yesterday’s chart, in which each wave has a wave number, followed by an indicator of its distance from Intermediate degree in the Elliott Wave system. Intermediate degree began in 2018 as wave 5{0}, and wave 4{-5}, the downtrending correction, is five degrees lower than wave 5{0}.
The decline that reached Friday’s low is labeled wave C{-6}, the final subwave within the larger wave B{-5}, the middle wave 4{-5}, a downward correction that began on February 19 from 6166.50. Wave C and its parent, wave 4 may have ended at that point, 5848, and the following wave 5{-6} may have begun.
Unless it hasn’t ended. the price hasn’t risen very far and could easily whipsaw back to a lower low, wave 6 within wave 4.
Today’s Chart
[S&P 500 E-mini futures at 9:35 a.m., dailybars, with volume]
Yesterday’s Chart
[S&P 500 E-mini futures at 3:30 p.m., 2/28/2025, 2-hour bars, with volume]
What are the alternatives? I’m staying with the wave 4 continues scenario. I want to see a further rise before I’m persuaded that wave 5 has begun
What does Elliott Wave Theory say? Here are the waves that underlie the morning’s analyses as they appeared on the chart.
Alternative Analysis #1, Wave 4 Scenario:
Wave C{-6} within wave 4{-5} continues.
Alternative Analysis #2, Wave 5 Scenario
Wave C{-6} within wave 4{-5} has ended.
Rising wave 5{-5} has begun.
And there’s another.
Alternative Analysis #3, Wave X Scenario
Wave 4{-5} is taking a comppund form and the connector subwave, wave X{-6}, has begun.
A compound form means that the correction has two or three corrective patterns, each connected with the next by an X wave
Long-term Waves.
These are the waves currently in progress under my principal analysis. Each line on the list shows the wave number, with the subscript in curly brackets, the traditional degree name, the starting date, the starting price of the S&P 500 E-mini futures, and the direction of the wave.
S&P 500 Index:
5{+3} Supercycle, 7/8/1932, 4.40 (up)
5{+2} Cycle, 12/9/1974, 60.96 (up)
5{+1} Primary, 3/6/2009, 666.79 (up)
5{0} Intermediate, 2/11/2016, 1810.10 (up)
3{-1} Minor, 3/23/2020, 2191.36 (up)
3{-2} Minute, 10/13/2022, 3491.58 (up)
S&P 500 Futures
5{-3} Minuette, 4/18/2024, 4963.50 (up)
3{-4} Subminuette, 8/7/2024, 5182 (up)
4{-5} Micro, 12/16/2025, 6163.75 (down)
C{-6} Submicro, 2/19/2025, 6166.50 (down)
Or alternatively,
5{-5} Micro, 2/27/2025, 5855.50 (up)
1{-6} Submicro, 2/27/2025, 5855.50 (up)
And yet another
Wave X{-6}, 2//27/2025, 5855.50 (up)
Reading the chart. Price movements — waves – – in Elliott Wave Theory analysis are labeled with numbers within trending waves and letters with corrective waves. The subscripts — numbers in curly brackets — designate the wave’s degree, which, in Elliott Wave analysis, means the relative position of a wave within the larger and smaller structures that make up the chart. R.N. Elliott, who in the 1930s developed the form of analysis that bears his name, viewed the chart as a complex structure of smaller waves nested within larger waves, which in turn are nested within still larger waves. In mathematics it’s called a fractal structure, where at every scale the pattern is similar to the others.
Learning and other resources. Elliott Wave analysis provides context, not prophecy. As the 20th century semanticist Alfred Korzybski put it in his book Science and Sanity (1933), “The map is not the territory … The only usefulness of a map depends on similarity of structure between the empirical world and the map.” And I would add, in the ever-changing markets, we can judge that similarity of structure only after the fact.
See the menu page Analytical Methods for a rundown on where to go for information on Elliott Wave analysis.
By Tim Bovee, Portland, Oregon, March 3, 2025
Disclaimer
Tim Bovee, Private Trader tracks the analysis and trades of a private trader for his own accounts. Nothing in this blog constitutes a recommendation to buy or sell stocks, options or any other financial instrument. The only purpose of this blog is to provide education and entertainment.
No trader is ever 100 percent successful in his or her trades. Trading in the stock and option markets is risky and uncertain. Each trader must make trading decisions for his or her own account, and take responsibility for the consequences.
Half an hour before the closing bell. The S&P 500 futures continued to fall during the session.
Elliott Wave Theory: The price remains within the range of the 4th subwave within the previous rising 3rd wave. This morning’s Alternation Analysis was correct and has been promoted to the new Principal Analysis on the chart. The final subwave, wave C, of the present 4th-wave corrective pattern continues.We are at one of those bottom-fishing moments where any lower low can be the end of the present wave. Or not.
9:35 a.m. New York time
What’s happening now? The S&P 500 E-mini futures rose slightly overnight, from the 5960s to the 6010s.
What does it mean? In Elliott Wave Theory, the rise from February 25 is a small countertrend correction that began from 5924.
Beyond that, the chart lacks clarity, a not unusual occurrence in Elliott Wave Theory. Are we in wave 4 or has wave 5 begun? Let’s try to puzzle it out.
A 4th wave tends to end within the range of the 4th subwave within the preceding 3rd-wave. In this case, that 4th wave occurred from November 11 to November 19, 2024, carrying the pricer from 6043.50 to 5855, a span of 188.5. I’ve marked the price on the chart in red.
The low point of the present 4th wave has been 5924 so far, placing it within the range of the 4th subwave of prior 3rd wave. Since this 4th wave is within the 4th of 3rd, and since a straightward labeling of the subwave leading to the February 25 low at wave 5, then wave C has ended.
Going forward, two possibilities: Either the 4th wave is taking a simple corrective pattern and therefore ended on February 25, or the 4th is taking a compound pattern, with two or three corrective patterns.
If it’s simple, the rise since February 25 is an early stage of wave 5. If it’s compound, then the rise is connector wave, an X wave, separating the first corrective pattern from the future second corrective pattern.
I’m choosing the simple corrective pattern for the Principal Analysis, reserving the compound pattern for the Alternative Analysis.
[S&P 500 E-mini futures at 3:30 p.m., 110-minute bars, with volume]
What is the alternative? Potentially, a compound correction lies ahead. See Alternative Analyss #2, below.
What does Elliott Wave Theory say? Here are the waves that underlie the morning’s analyses as they appeared on the chart.
Principal Analysis:
Demoted to Alternative Analysis during the session.
Wave C{-6} within wave 4{-5} has ended.
Rising wave 5{-5} has begun.
Alternative Analysis #1
Promoted to Principal Analysis during the session
Wave C{-6} within wave 4{-5} continues
Alternative Analysis #2
Wave 4{-5} is taking a compund form and the connector subwave, wave X{-6}, has begun.
Long-term Waves.
These are the waves currently in progress under my principal analysis. Each line on the list shows the wave number, with the subscript in curly brackets, the traditional degree name, the starting date, the starting price of the S&P 500 E-mini futures, and the direction of the wave. This list has been revised to reflect the revised Principal Analysis.
S&P 500 Index:
5{+3} Supercycle, 7/8/1932, 4.40 (up)
5{+2} Cycle, 12/9/1974, 60.96 (up)
5{+1} Primary, 3/6/2009, 666.79 (up)
5{0} Intermediate, 2/11/2016, 1810.10 (up)
3{-1} Minor, 3/23/2020, 2191.36 (up)
3{-2} Minute, 10/13/2022, 3491.58 (up)
S&P 500 Futures
5{-3} Minuette, 4/18/2024, 4963.50 (up)
4{-5} Micro, 12/16/2025, 6163.75 (down)
C{-6} Submicro, 2/19/2025, 6166.50 (down)
Reading the chart. Price movements — waves – – in Elliott Wave Theory analysis are labeled with numbers within trending waves and letters with corrective waves. The subscripts — numbers in curly brackets — designate the wave’s degree, which, in Elliott Wave analysis, means the relative position of a wave within the larger and smaller structures that make up the chart. R.N. Elliott, who in the 1930s developed the form of analysis that bears his name, viewed the chart as a complex structure of smaller waves nested within larger waves, which in turn are nested within still larger waves. In mathematics it’s called a fractal structure, where at every scale the pattern is similar to the others.
Learning and other resources. Elliott Wave analysis provides context, not prophecy. As the 20th century semanticist Alfred Korzybski put it in his book Science and Sanity (1933), “The map is not the territory … The only usefulness of a map depends on similarity of structure between the empirical world and the map.” And I would add, in the ever-changing markets, we can judge that similarity of structure only after the fact.
See the menu page Analytical Methods for a rundown on where to go for information on Elliott Wave analysis.
By Tim Bovee, Portland, Oregon, February 27, 2025
Disclaimer
Tim Bovee, Private Trader tracks the analysis and trades of a private trader for his own accounts. Nothing in this blog constitutes a recommendation to buy or sell stocks, options or any other financial instrument. The only purpose of this blog is to provide education and entertainment.
No trader is ever 100 percent successful in his or her trades. Trading in the stock and option markets is risky and uncertain. Each trader must make trading decisions for his or her own account, and take responsibility for the consequences.
Half an hour before the closing bell. The S&P 500 futures reached a slightly lower low during the session, 5848, and then withdrew to above 5900.
This morning’s ambiguity continues into the afternoon. Elliott Wave Theory: It’s a 5th wave that’s underway or a 4th wave, and its not certain which view is correct.
The session low, 5848, took the price below the lower bounday that is the ending target for the 4th wave: The range of the 4th subwave within the rising 3rd wave the preceded the present 4th-wave correction.
Based on more than 90 yers of experience with Elliott Wave analysis, the expectation would be that wave 4 has ended and wave 5 has begun. But that’s based on a tendency, not a rule. So I’m applying some skepticism to the matter.
9:35 a.m. New York time
What’s happening now? The S&P 500 E-mini futures fell early in the overnight session, to 5858.50, and then rose slightly above 5900.
What does it mean? The Elliott Wave Theory analysis is precisely where it was in yesterday’s analysis: The decline appears to be the end of the final subwave, wave C, within the 4th-wave downward correction that began on December 16, 2024. That turned out to be an unfortunate conclusion, as the price flipped back into a decline, forcing a retraction of the morning analysis.
This time around, there is an even greater reason to conclude that wave C has ended.
A 4th wave correction tends to end within the 4th subwave of the preceding 3rd wave. The low point of that subwave was 5855, reached on November 19, 2024. The low point overnighj was 5858.50.
As the old acknowledgement of remorse goes, “Once burned, twice shy.” Having been burned yesterday, I’m relutant to call wave 4 complete until I’ve seen more of a rise. In the meantime, I’m sticking within an irritating pair of conclsions: Either falling wave 4 in in its last legs, or rising wave 5 has begun.
[S&P 500 E-mini futures at 3:30 p.m., 2-hour bars, with volume]
What is the alternative? So there is no Principal Analysis at this point; only two alternatives.
What does Elliott Wave Theory say? Here are the waves that underlie the morning’s analyses as they appeared on the chart.
Alternative Analysis #1, Wave 4 Scenario:
Wave C{-6} within wave 4{-5} continues.
Alternative Analysis #2, Wave 5 Scenario
Wave C{-6} within wave 4{-5} has ended.
Rising wave 5{-5} has begun.
And there’s another.
Alternative Analysis #3, Wave X Scenario
Wave 4{-5} is taking a comppund form and the connector subwave, wave X{-6}, has begun.
A compound form means that the correction has two or three corrective patterns, each connected with the next by an X wave
Long-term Waves.
These are the waves currently in progress under my principal analysis. Each line on the list shows the wave number, with the subscript in curly brackets, the traditional degree name, the starting date, the starting price of the S&P 500 E-mini futures, and the direction of the wave.
S&P 500 Index:
5{+3} Supercycle, 7/8/1932, 4.40 (up)
5{+2} Cycle, 12/9/1974, 60.96 (up)
5{+1} Primary, 3/6/2009, 666.79 (up)
5{0} Intermediate, 2/11/2016, 1810.10 (up)
3{-1} Minor, 3/23/2020, 2191.36 (up)
3{-2} Minute, 10/13/2022, 3491.58 (up)
S&P 500 Futures
5{-3} Minuette, 4/18/2024, 4963.50 (up)
3{-4} Subminuette, 8/7/2024, 5182 (up)
4{-5} Micro, 12/16/2025, 6163.75 (down)
C{-6} Submicro, 2/19/2025, 6166.50 (down)
Or alternatively,
5{-5} Micro, 2/27/2025, 5855.50 (up)
1{-6} Submicro, 2/27/2025, 5855.50 (up)
And yet another
Wave X{-6}, 2//27/2025, 5855.50 (up)
Reading the chart. Price movements — waves – – in Elliott Wave Theory analysis are labeled with numbers within trending waves and letters with corrective waves. The subscripts — numbers in curly brackets — designate the wave’s degree, which, in Elliott Wave analysis, means the relative position of a wave within the larger and smaller structures that make up the chart. R.N. Elliott, who in the 1930s developed the form of analysis that bears his name, viewed the chart as a complex structure of smaller waves nested within larger waves, which in turn are nested within still larger waves. In mathematics it’s called a fractal structure, where at every scale the pattern is similar to the others.
Learning and other resources. Elliott Wave analysis provides context, not prophecy. As the 20th century semanticist Alfred Korzybski put it in his book Science and Sanity (1933), “The map is not the territory … The only usefulness of a map depends on similarity of structure between the empirical world and the map.” And I would add, in the ever-changing markets, we can judge that similarity of structure only after the fact.
See the menu page Analytical Methods for a rundown on where to go for information on Elliott Wave analysis.
By Tim Bovee, Portland, Oregon, February 28, 2025
Disclaimer
Tim Bovee, Private Trader tracks the analysis and trades of a private trader for his own accounts. Nothing in this blog constitutes a recommendation to buy or sell stocks, options or any other financial instrument. The only purpose of this blog is to provide education and entertainment.
No trader is ever 100 percent successful in his or her trades. Trading in the stock and option markets is risky and uncertain. Each trader must make trading decisions for his or her own account, and take responsibility for the consequences.
Half an hour before the closing bell. The S&P 500 futures continued to fall during the session.
Elliott Wave Theory: The price remains within the range of the 4th subwave within the previous rising 3rd wave. This morning’s Alternation Analysis was correct and has been promoted to the new Principal Analysis on the chart. The final subwave, wave C, of the present 4th-wave corrective pattern continues.We are at one of those bottom-fishing moments where any lower low can be the end of the present wave. Or not.
9:35 a.m. New York time
What’s happening now? The S&P 500 E-mini futures rose slightly overnight, from the 5960s to the 6010s.
What does it mean? In Elliott Wave Theory, the rise from February 25 is a small countertrend correction that began from 5924.
Beyond that, the chart lacks clarity, a not unusual occurrence in Elliott Wave Theory. Are we in wave 4 or has wave 5 begun? Let’s try to puzzle it out.
A 4th wave tends to end within the range of the 4th subwave within the preceding 3rd-wave. In this case, that 4th wave occurred from November 11 to November 19, 2024, carrying the pricer from 6043.50 to 5855, a span of 188.5. I’ve marked the price on the chart in red.
The low point of the present 4th wave has been 5924 so far, placing it within the range of the 4th subwave of prior 3rd wave. Since this 4th wave is within the 4th of 3rd, and since a straightward labeling of the subwave leading to the February 25 low at wave 5, then wave C has ended.
Going forward, two possibilities: Either the 4th wave is taking a simple corrective pattern and therefore ended on February 25, or the 4th is taking a compound pattern, with two or three corrective patterns.
If it’s simple, the rise since February 25 is an early stage of wave 5. If it’s compound, then the rise is connector wave, an X wave, separating the first corrective pattern from the future second corrective pattern.
I’m choosing the simple corrective pattern for the Principal Analysis, reserving the compound pattern for the Alternative Analysis.
[S&P 500 E-mini futures at 3:30 p.m., 110-minute bars, with volume]
What is the alternative? Potentially, a compound correction lies ahead. See Alternative Analyss #2, below.
What does Elliott Wave Theory say? Here are the waves that underlie the morning’s analyses as they appeared on the chart.
Principal Analysis:
Demoted to Alternative Analysis during the session.
Wave C{-6} within wave 4{-5} has ended.
Rising wave 5{-5} has begun.
Alternative Analysis #1
Promoted to Principal Analysis during the session
Wave C{-6} within wave 4{-5} continues
Alternative Analysis #2
Wave 4{-5} is taking a compund form and the connector subwave, wave X{-6}, has begun.
Long-term Waves.
These are the waves currently in progress under my principal analysis. Each line on the list shows the wave number, with the subscript in curly brackets, the traditional degree name, the starting date, the starting price of the S&P 500 E-mini futures, and the direction of the wave. This list has been revised to reflect the revised Principal Analysis.
S&P 500 Index:
5{+3} Supercycle, 7/8/1932, 4.40 (up)
5{+2} Cycle, 12/9/1974, 60.96 (up)
5{+1} Primary, 3/6/2009, 666.79 (up)
5{0} Intermediate, 2/11/2016, 1810.10 (up)
3{-1} Minor, 3/23/2020, 2191.36 (up)
3{-2} Minute, 10/13/2022, 3491.58 (up)
S&P 500 Futures
5{-3} Minuette, 4/18/2024, 4963.50 (up)
4{-5} Micro, 12/16/2025, 6163.75 (down)
C{-6} Submicro, 2/19/2025, 6166.50 (down)
Reading the chart. Price movements — waves – – in Elliott Wave Theory analysis are labeled with numbers within trending waves and letters with corrective waves. The subscripts — numbers in curly brackets — designate the wave’s degree, which, in Elliott Wave analysis, means the relative position of a wave within the larger and smaller structures that make up the chart. R.N. Elliott, who in the 1930s developed the form of analysis that bears his name, viewed the chart as a complex structure of smaller waves nested within larger waves, which in turn are nested within still larger waves. In mathematics it’s called a fractal structure, where at every scale the pattern is similar to the others.
Learning and other resources. Elliott Wave analysis provides context, not prophecy. As the 20th century semanticist Alfred Korzybski put it in his book Science and Sanity (1933), “The map is not the territory … The only usefulness of a map depends on similarity of structure between the empirical world and the map.” And I would add, in the ever-changing markets, we can judge that similarity of structure only after the fact.
See the menu page Analytical Methods for a rundown on where to go for information on Elliott Wave analysis.
By Tim Bovee, Portland, Oregon, February 27, 2025
Disclaimer
Tim Bovee, Private Trader tracks the analysis and trades of a private trader for his own accounts. Nothing in this blog constitutes a recommendation to buy or sell stocks, options or any other financial instrument. The only purpose of this blog is to provide education and entertainment.
No trader is ever 100 percent successful in his or her trades. Trading in the stock and option markets is risky and uncertain. Each trader must make trading decisions for his or her own account, and take responsibility for the consequences.
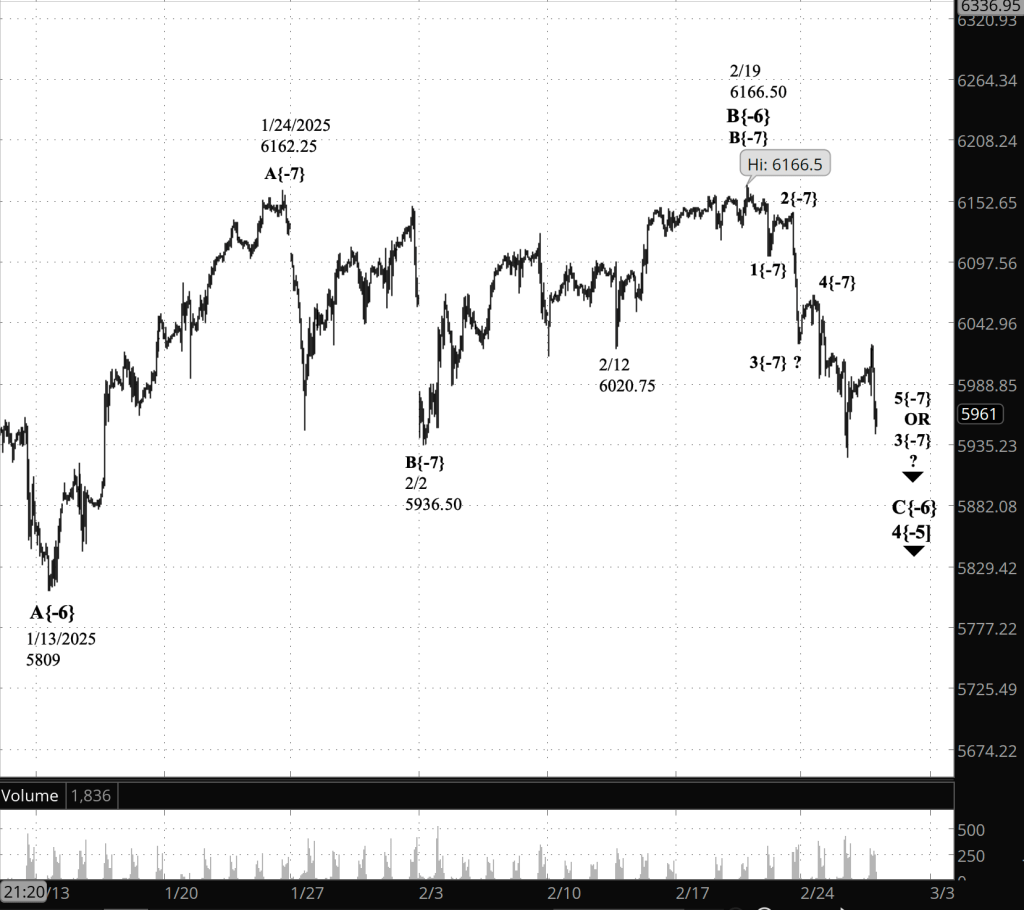
Half an hour before the closing bell. The S&P 500 futures peaked at 6023.75 early in the session and then declined into the 5940s. Elliott Wave Theory: The wave 3 vs. wave 5 ambiguity continues.
9:35 a.m. New York time
What’s happening now? The S&P 500 E-mini futures rose from the 5570s to slightly above 6000 overnight.
What does it mean? I’ve moved the chart in for a closer view of Elliott Wave Theory waves B and C within the 4th-wave downward correction that began December 16.
How far along is wave C? At first glance, it is in its final subwave, wave 5{-7} on the chart. But that seems rather shallow, and it’s possible count it as being in its middle subwave, wave 3{-7}.
It’s impossible to know for certain, and so I did a “this or that” label — wave 3 or wave 5.
[S&P 500 E-mini futures at 3:30 p.m., 110-minute bars, with volume]
What is another alternative? It’s possible that what I’ve labeled as a simple correction is in fact a compound correction. A simple correction — a Flat or a Zigzag — has a single three-wave corrective pattern within it. A compound correction has two or three corrective patterns, each separated from the next by an X-wave, a connector that sets the stage for the next corrective pattern.
What does Elliott Wave Theory say? Here are the waves that underlie the morning’s analyses as they appeared on the chart.
Principal Analysis:
Wave C{-6} within wave 4{-5} is underway.
Long-term Waves.
These are the waves currently in progress under my principal analysis. Each line on the list shows the wave number, with the subscript in curly brackets, the traditional degree name, the starting date, the starting price of the S&P 500 E-mini futures, and the direction of the wave. This list has been revised to reflect the revised Principal Analysis.
S&P 500 Index:
5{+3} Supercycle, 7/8/1932, 4.40 (up)
5{+2} Cycle, 12/9/1974, 60.96 (up)
5{+1} Primary, 3/6/2009, 666.79 (up)
5{0} Intermediate, 2/11/2016, 1810.10 (up)
3{-1} Minor, 3/23/2020, 2191.36 (up)
3{-2} Minute, 10/13/2022, 3491.58 (up)
S&P 500 Futures
5{-3} Minuette, 4/18/2024, 4963.50 (up)
3{-4} Subminuette, 8/7/2024, 5182 (up)
4{-5} Micro, 12/16/2025, 6163.75 (down)
C{-6} Submicro, 2/19/2025, 6166.50 (down)
Reading the chart. Price movements — waves – – in Elliott Wave Theory analysis are labeled with numbers within trending waves and letters with corrective waves. The subscripts — numbers in curly brackets — designate the wave’s degree, which, in Elliott Wave analysis, means the relative position of a wave within the larger and smaller structures that make up the chart. R.N. Elliott, who in the 1930s developed the form of analysis that bears his name, viewed the chart as a complex structure of smaller waves nested within larger waves, which in turn are nested within still larger waves. In mathematics it’s called a fractal structure, where at every scale the pattern is similar to the others.
Learning and other resources. Elliott Wave analysis provides context, not prophecy. As the 20th century semanticist Alfred Korzybski put it in his book Science and Sanity (1933), “The map is not the territory … The only usefulness of a map depends on similarity of structure between the empirical world and the map.” And I would add, in the ever-changing markets, we can judge that similarity of structure only after the fact.
See the menu page Analytical Methods for a rundown on where to go for information on Elliott Wave analysis.
By Tim Bovee, Portland, Oregon, February 26, 2025
Disclaimer
Tim Bovee, Private Trader tracks the analysis and trades of a private trader for his own accounts. Nothing in this blog constitutes a recommendation to buy or sell stocks, options or any other financial instrument. The only purpose of this blog is to provide education and entertainment.
No trader is ever 100 percent successful in his or her trades. Trading in the stock and option markets is risky and uncertain. Each trader must make trading decisions for his or her own account, and take responsibility for the consequences.


You must be logged in to post a comment.