Trader’s Notebook

3:30 p.m. New York time

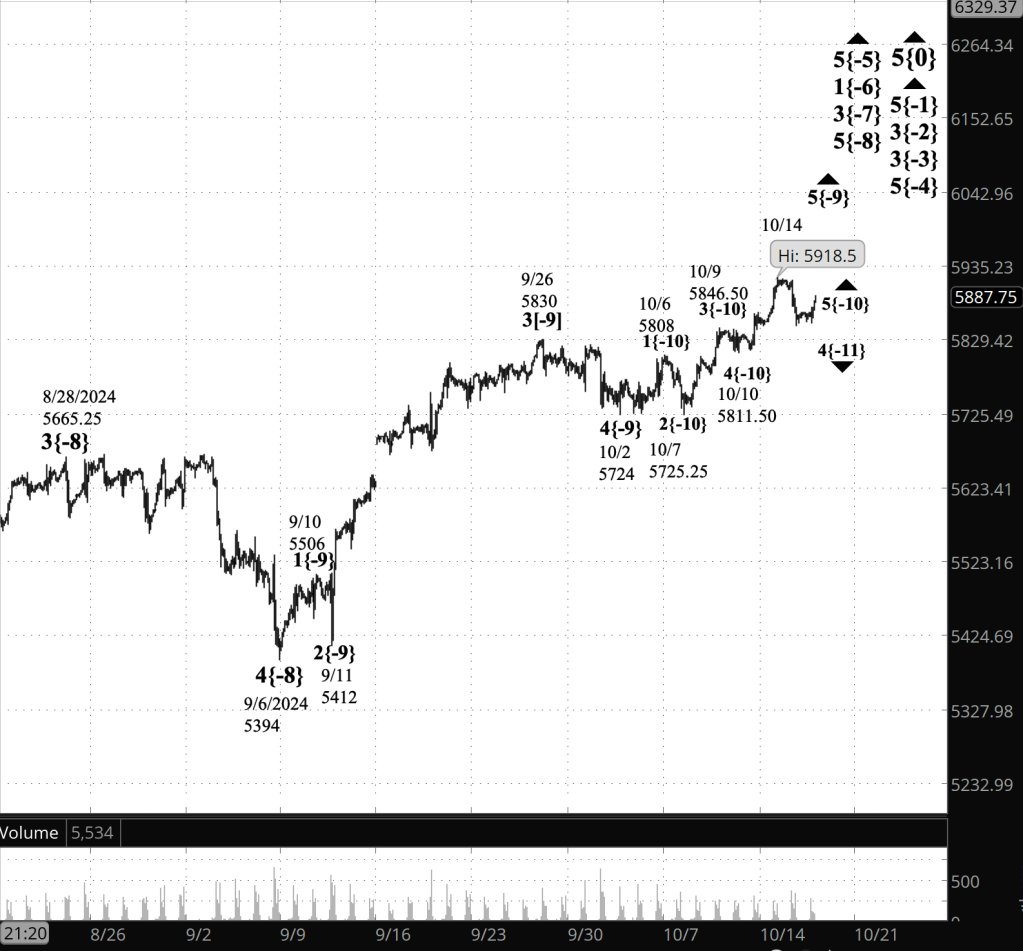
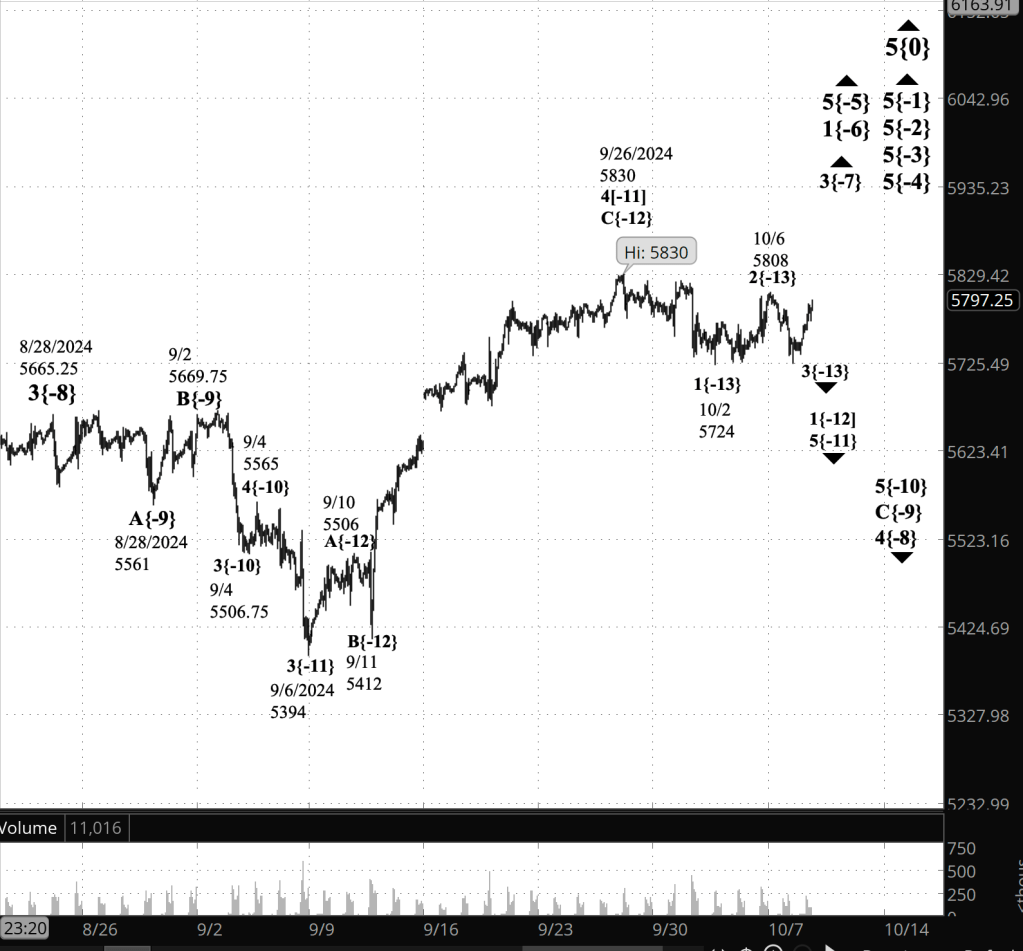
Half an hour before the closing bell. The S&P 500 futures rose into the 5920s during the session and then pulled back slightly. Elliott Wave Theory: The middle subwave with the larger middle subwave within the still larger 5th-wave uptrend that began October 2 all continue.

9:35 a.m. New York time

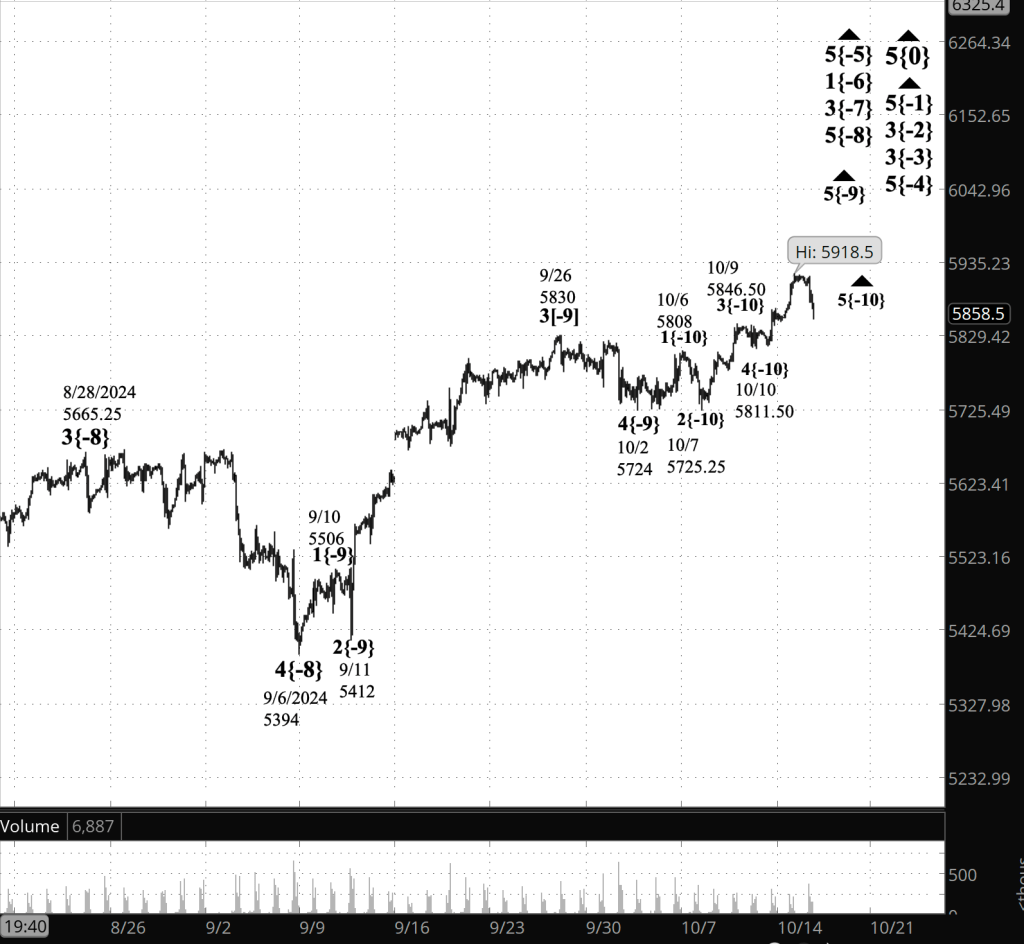
What’s happening now? The S&P 500 E-mini futures rose overnight into the 5920s, breezing past the prior peak, attained on October 14.

What does it mean? The resumption of the rise resolved the Elliott Wave Theory ambiguities that had plagued the chart for the last few days.

Under the new principal analysis, the uptrending 5th wave that began on October 2 continues with it’s count unchanged.

Internally, however, things have changed. The subwave one degree lower than the October 2 wave is now in its 3rd subwave, as is the 3rd wave one degree further down.

Wave labels on the chart are shown as a wave number followed by a subscript in curly brackets denoting the number of degrees distance the wave stands from the present Intermediate degree, wave 5{0}, which began in December 2018.

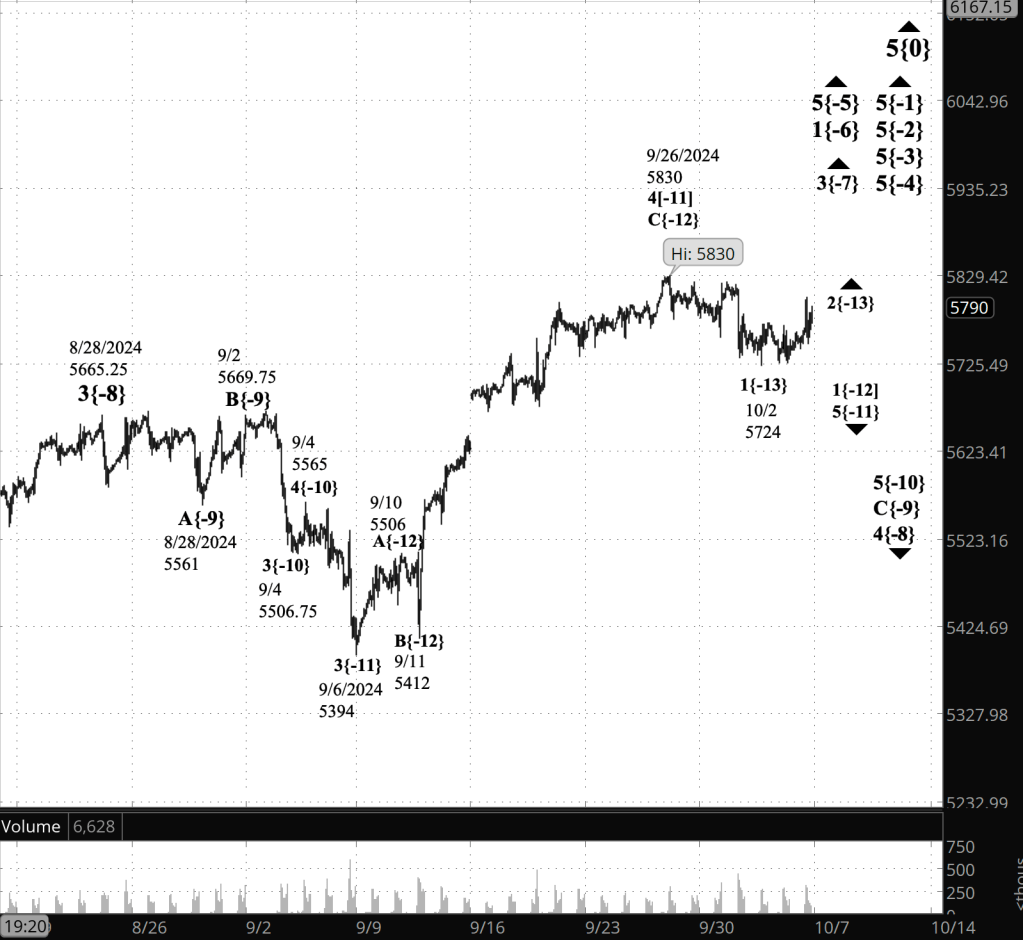
On the chart, the uptrending 5th wave of October 2 is wave 5{-9}, which is in its middle subwave, wave 3{-10}, which in turn is within its middle wave, wave 3{-11}. Basically, wave 3{-10}, which had been labelled as ending on October 9, is now considered to be underway.

The difficulty, as always, is the occasional difficulty of determining placement of any given wave within the fractal structure of the chart.

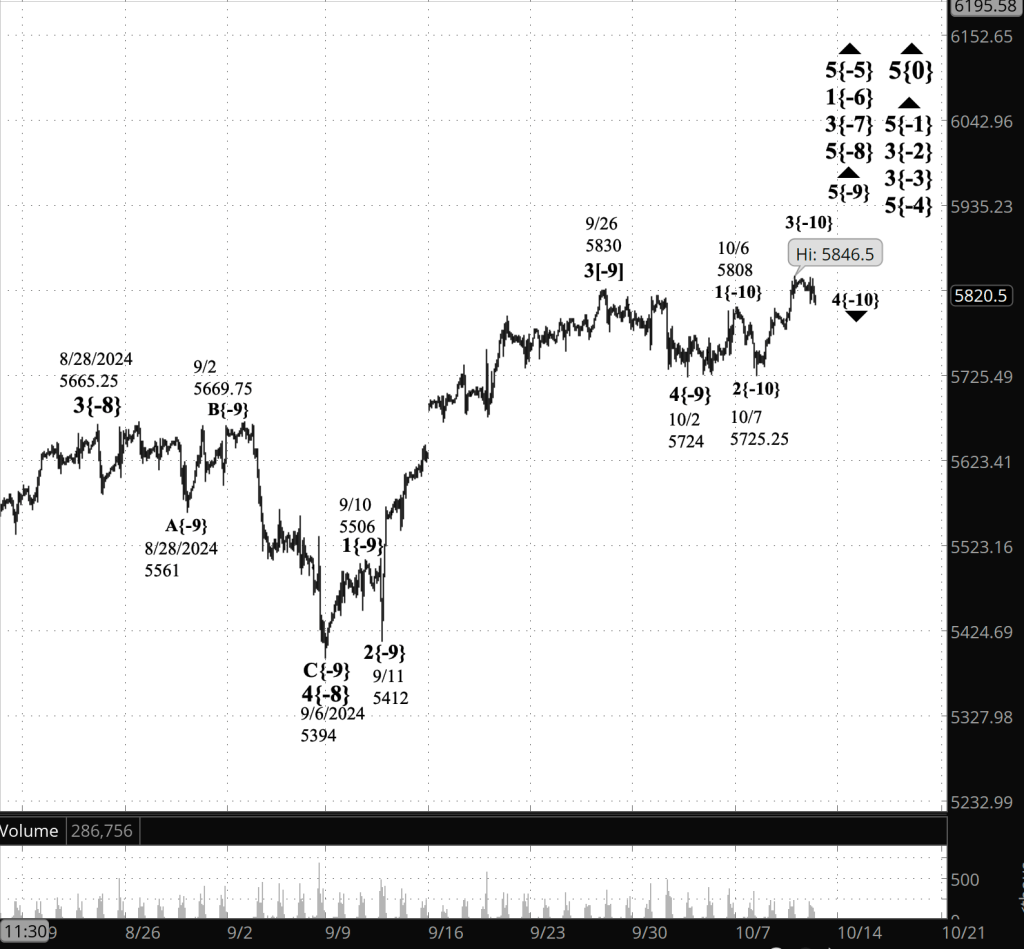
See yesterday’s Trader’s Notebook for the prior principal analysis chart.

[S&P 500 E-mini futures at 3:30 p.m., 110-minute bars, with volume]

What are the alternatives? None at present. they will no doubt develop with the passage of time.

What does Elliott wave theory say? Here are the waves that underly the analyses.

Principal Analysis:

  • Rising wave 5{0} is underway. It is a wave of Intermediate degree that began in December 2018.
  • It is in its final subwave, wave 5{-1}.
  • Within wave 5{-1}, rising waves 5{-2}, 5{-3} and 5{-4} are underway, as is wave 5{-5}.
  • Wave 5{-5} is in its initial subwave, wave 1{-6}, which in turn is in its middle subwave, wave 3{-7}.
  • Wave 3{-7} is in its final; subwave, uptrending wave 5{-8}.
  • Wave 5{-8} is in its final subwave, wave 5{-9}, which is in its middle subwave, rising wave 3{-10}.
  • Wave 3{-10} is in its middle subwave, wave 3{-11}.

Long-term Waves.

These are the waves currently in progress under my principal analysis. Each line on the list shows the wave number, with the subscript in curly brackets, the traditional degree name, the starting date, the starting price of the S&P 500 E-mini futures, and the direction of the wave.

  • S&P 500 Index:
  • 5{+3} Supercycle, 7/8/1932, 4.40 (up)
  • 5{+2} Cycle, 12/9/1974, 60.96 (up)
  • 5{+1} Primary, 3/6/2009, 666.79 (up)
  • 5{0} Intermediate, 12/26/2018, 2346.58 (up)
  • S&P 500 Futures
  • 5{-1} Minor, 10/27/2023, 4127.25 (up)
  • 3{-2} Minute, 10/27/23, 4127.75 (up)
  • 3{-3} Minuette, 10/27/23, 4127.75 (up)
  • 5{-4} Subminuette, 4/18/2024, 4963.50 (up)
  • 5{-5} Micro, 8/5/2024, 5120 (up)
  • 1{-6} Submicro, 8/5/2024, 5120 (up)
  • 3{-7} Minuscule, 8/7/2024, 5182 (up)
  • 5{-8} (unnamed), 9/6/2024, 5394 (up)

Reading the chart. Price movements — waves – – in Elliott wave analysis are labeled with numbers within trending waves and letters with corrective waves. The subscripts — numbers in curly brackets — designate the wave’s degree, which, in Elliott wave analysis, means the relative position of a wave within the larger and smaller structures that make up the chart. R.N. Elliott, who in the 1930s developed the form of analysis that bears his name, viewed the chart as a complex structure of smaller waves nested within larger waves, which in turn are nested within still larger waves. In mathematics it’s called a fractal structure, where at every scale the pattern is similar to the others.

Learning and other resources. Elliott wave analysis provides context, not prophecy. As the 20th century semanticist Alfred Korzybski put it in his book Science and Sanity (1933), “The map is not the territory … The only usefulness of a map depends on similarity of structure between the empirical world and the map.” And I would add, in the ever-changing markets, we can judge that similarity of structure only after the fact.

See the menu page Analytical Methods for a rundown on where to go for information on Elliott wave analysis.

By Tim Bovee, Portland, Oregon, October 17, 2024

Disclaimer

Tim Bovee, Private Trader tracks the analysis and trades of a private trader for his own accounts. Nothing in this blog constitutes a recommendation to buy or sell stocks, options or any other financial instrument. The only purpose of this blog is to provide education and entertainment.

No trader is ever 100 percent successful in his or her trades. Trading in the stock and option markets is risky and uncertain. Each trader must make trading decisions for his or her own account, and take responsibility for the consequences.

License
Creative Commons License

All content on Tim Bovee, Private Trader by Timothy K. Bovee is licensed under a Creative Commons Attribution-ShareAlike 4.0 International License.

Based on a work at www.timbovee.com.

Trader’s Notebook

3:30 p.m. New York time

Half an hour before the closing bell. The S&P 500 futures rose into the 5890s, remaining below the October 14 peak, 5918.50.

Elliott Wave Theory: The movement is consistent with the possible solution to the multiple ambiguities on the chart, whoch would relabel the October 14 peak as the end of the 1st subwave of the rising 5th wave that began on October 10. That would mean that the decline that began on that date is the start of a 2nd-wave downward correction.

9:35 a.m. New York time

What’s happening now? The S&P 500 E-mini futures traded narrowly overnight, fluctuating from the 5850s into the 5860s.

What does it mean? In yesterday’s closing Elliott Wave Theory analysis I described how the smallest wave set I was tracking had fallen into ambiguity, describing three possible interpretations of the chart.

Waves on my charts are labeled with a wave number followed by a subscript in curly brackets showing the wave’s distance, within the fractal structure of the chart from the current wave of Intermediately degree, presently wave 5{0}, which began in December 2018.

The present wave in question is wave 4{-11}, a downward correction that began on October 14 from 5918.50. It is a subwave of wave 5{-10}, which began on October 10 from 5811.50.

These are small waves, and I’ve often found that waves of smaller degree are more likely to lack clarity than larger waves. Perhaps it is because each bar on the chart is a larger percentage of the smaller waves, causing a loss of granularity and as a consequence a loss of data. It’s as though the wave pattern are drawn by a thick magic marker rather than a fine-point pin.

Whatever the cause, the reality is that wave 4{-11} has moved so far down that it has broken a rule of Elliott Wave Theory. Here’s how I discussed it in yesterday’s analysis:

  • Yesterday morning’s principle wave count, where the 4th subwave has begun, remains viable, maybe.
    • A rule of Elliott Wave Theory says a 4th subwave can’t move beyond the end of the preceding 1st subwave. By my preferred count, it’s close but has not crossed the 1st subwave endpoint at 5737.75
    • By the rule-breaking count, although reasonable as a pattern on the chart, the price has moved below the end of the 1st wave-crossing the line at 5868.25. This calls for a major reanaysis.
  • Under the morning’s alternative wave count, the status of the 5th subwave is quite ambiguous.
    • Potentially, the 5th subwave has ended, which means the end of three parent and grandparent waves of increasing size.
  • Not mentioned in the earlier counts, but its possible that the larger 5th wave rise is really a 3rd wave rise, which requires a major re-analysis.

One solution to the problem would be to consider the wave 3{-11} peak on October 14 to be the end of wave 1{-11}, making the present decline wave 2{-11}, a downward correction. The rule for 2nd waves is that they never moved below the start of wave 1, unlike 4th waves, which never move beyond the end of wave 1.

What’s an analyst to do? The ambiguities are two great to make a decision. I need more evidence. So I’ll stick with the present chart labelling, ambiguities and all, until the price patterns gain some clarity.

[S&P 500 E-mini futures at 3:30 p.m., 100-minute bars, with volume]

What are the alternatives? See the “What does it mean?” section, above.

What does Elliott wave theory say? Here are the waves that underly the analyses.

Principal Analysis:

  • Rising wave 5{0} is underway. It is a wave of Intermediate degree that began in December 2018.
  • It is in its final subwave, wave 5{-1}.
  • Within wave 5{-1}, rising waves 5{-2}, 5{-3} and 5{-4} are underway, as is wave 5{-5}.
  • Wave 5{-5} is in its initial subwave, wave 1{-6}, which in turn is in its middle subwave, wave 3{-7}.
  • Wave 3{-7} is in its final; subwave, uptrending wave 5{-8}.
  • Wave 5{-8} is in its final subwave, wave 5{-9}, which is in its final subwave, rising wave 5{-10}.
  • Wave 5{-10} is in its next-to-the-last subwave, wave 4{-11}.
  • Note that the count of wave 5{-10} and 4{-11} is in question.

Long-term Waves.

These are the waves currently in progress under my principal analysis. Each line on the list shows the wave number, with the subscript in curly brackets, the traditional degree name, the starting date, the starting price of the S&P 500 E-mini futures, and the direction of the wave.

  • S&P 500 Index:
  • 5{+3} Supercycle, 7/8/1932, 4.40 (up)
  • 5{+2} Cycle, 12/9/1974, 60.96 (up)
  • 5{+1} Primary, 3/6/2009, 666.79 (up)
  • 5{0} Intermediate, 12/26/2018, 2346.58 (up)
  • S&P 500 Futures
  • 5{-1} Minor, 10/27/2023, 4127.25 (up)
  • 3{-2} Minute, 10/27/23, 4127.75 (up)
  • 3{-3} Minuette, 10/27/23, 4127.75 (up)
  • 5{-4} Subminuette, 4/18/2024, 4963.50 (up)
  • 5{-5} Micro, 8/5/2024, 5120 (up)
  • 1{-6} Submicro, 8/5/2024, 5120 (up)
  • 3{-7} Minuscule, 8/7/2024, 5182 (up)
  • 5{-8} (unnamed), 9/6/2024, 5394 (up)

Reading the chart. Price movements — waves – – in Elliott wave analysis are labeled with numbers within trending waves and letters with corrective waves. The subscripts — numbers in curly brackets — designate the wave’s degree, which, in Elliott wave analysis, means the relative position of a wave within the larger and smaller structures that make up the chart. R.N. Elliott, who in the 1930s developed the form of analysis that bears his name, viewed the chart as a complex structure of smaller waves nested within larger waves, which in turn are nested within still larger waves. In mathematics it’s called a fractal structure, where at every scale the pattern is similar to the others.

Learning and other resources. Elliott wave analysis provides context, not prophecy. As the 20th century semanticist Alfred Korzybski put it in his book Science and Sanity (1933), “The map is not the territory … The only usefulness of a map depends on similarity of structure between the empirical world and the map.” And I would add, in the ever-changing markets, we can judge that similarity of structure only after the fact.

See the menu page Analytical Methods for a rundown on where to go for information on Elliott wave analysis.

By Tim Bovee, Portland, Oregon, October 16, 2024

Disclaimer

Tim Bovee, Private Trader tracks the analysis and trades of a private trader for his own accounts. Nothing in this blog constitutes a recommendation to buy or sell stocks, options or any other financial instrument. The only purpose of this blog is to provide education and entertainment.

No trader is ever 100 percent successful in his or her trades. Trading in the stock and option markets is risky and uncertain. Each trader must make trading decisions for his or her own account, and take responsibility for the consequences.

License
Creative Commons License

All content on Tim Bovee, Private Trader by Timothy K. Bovee is licensed under a Creative Commons Attribution-ShareAlike 4.0 International License.

Based on a work at www.timbovee.com.

Trader’s Notebook

3:30 p.m. New York Time

Half an hour before the closing bell. The S&P 500 futures fell sharply during the session, from the 5910s into the 58 50s so far. The length of the decline has produced some ambiguities regarding the subwaves of the 5th-wave rise that began on October 10.

Elliott Wave Theory: Ambiguities abound.

  • This morning’s principle wave count, where the 4th subwave has begun, remains viable, maybe.
    • A rule of Elliott Wave Theory says a 4th subwave can’t move beyond the end of the preceding 1st subwave. By my preferred count, it’s close but has not crossed the 1st subwave endpoint at 5737.75
    • By the rule-breaking count, although reasonable as a pattern on the chart, the price has moved below the end of the 1st wave-crossing the line at 5868.25. This calls for a major reanaysis.
  • Under this mornings alternative wave count, the status of the 5th subwave is quite ambiguous.
    • Potentially, the 5th subwave has ended, which means the end of three parent and grandparent waves of increasing size.
  • Not mentioned this morning, but its possible that the larger 5th wave rise is really a 3rd wave rise, which requires a major re-analysis.

9:35 a.m. New York time

What’s happening now? The S&P 500 E-mini futures dropped slightly overnight, reversing as the opening bell approached.

What does it mean? The slight decline and reversal, when Elliott Wave Theory are applied are part of a 4th-wave upward correction, a subwave within a rising 5th wave that began on October 10. When that small wave 4 is complete, it will be followed by a rising 5th wave, a subwave of the larger 5th wave.

It is that smaller rising 5th subwave whose end will trigger a cascade of 5th-wave completions up the fractal structure of the chart.

As labeled on the chart, each wave has a number followed by a subscript, in curly brackets, saying how many degrees within the fractal structure the wave stands in relation to the Intermediate degree, rising wave 5{0}, which began in December 2018. Waves with negative subscripts are smaller than the Intermediate wave, and those with positive subscripts are larger.

As seen on the chart, wave 4{-11}, a downward correction, is underway. It will be followed by rising wave 5{-11}, whose completion will also be the end of waves 5{-10], 5{-9} and 5{-8}.

Wave 5{-8} began on September 6 and is subwave of wave 3{-7}, which began on August 7 from 5182. It will be followed by a 4th-wave downward correction of relatively generous proportions compared the lower-degree wave 4s we’ve seen in the last few months.

[S&P 500 E-mini futures at 3:30 pm., 100-minute bars, with volume]

What are the alternatives? There is some ambiguity within the wave 5{-11} subwave count. It will be resolved as that 5th wave progresses toward its end.

What does Elliott wave theory say? Here are the waves that underly the analysis.

Principal Analysis:

  • Rising wave 5{0} is underway. It is a wave of Intermediate degree that began in December 2018.
  • It is in its final subwave, wave 5{-1}.
  • Within wave 5{-1}, rising waves 5{-2}, 5{-3} and 5{-4} are underway, as is wave 5{-5}.
  • Wave 5{-5} is in its initial subwave, wave 1{-6}, which in turn is in its middle subwave, wave 3{-7}.
  • Wave 3{-7} is in its final; subwave, uptrending wave 5{-8}.
  • Wave 5{-8} is in its final subwave, wave 5{-9}, which is in its final subwave, rising wave 5{-10}.
  • Wave 5{-10} is in its next-to-the-last subwave, wave 4{-11}.

Long-term Waves.

These are the waves currently in progress under my principal analysis. Each line on the list shows the wave number, with the subscript in curly brackets, the traditional degree name, the starting date, the starting price of the S&P 500 E-mini futures, and the direction of the wave.

  • S&P 500 Index:
  • 5{+3} Supercycle, 7/8/1932, 4.40 (up)
  • 5{+2} Cycle, 12/9/1974, 60.96 (up)
  • 5{+1} Primary, 3/6/2009, 666.79 (up)
  • 5{0} Intermediate, 12/26/2018, 2346.58 (up)
  • S&P 500 Futures
  • 5{-1} Minor, 10/27/2023, 4127.25 (up)
  • 3{-2} Minute, 10/27/23, 4127.75 (up)
  • 3{-3} Minuette, 10/27/23, 4127.75 (up)
  • 5{-4} Subminuette, 4/18/2024, 4963.50 (up)
  • 5{-5} Micro, 8/5/2024, 5120 (up)
  • 1{-6} Submicro, 8/5/2024, 5120 (up)
  • 3{-7} Minuscule, 8/7/2024, 5182 (up)
  • 5{-8} (unnamed), 9/6/2024, 5394 (up)

Reading the chart. Price movements — waves – – in Elliott wave analysis are labeled with numbers within trending waves and letters with corrective waves. The subscripts — numbers in curly brackets — designate the wave’s degree, which, in Elliott wave analysis, means the relative position of a wave within the larger and smaller structures that make up the chart. R.N. Elliott, who in the 1930s developed the form of analysis that bears his name, viewed the chart as a complex structure of smaller waves nested within larger waves, which in turn are nested within still larger waves. In mathematics it’s called a fractal structure, where at every scale the pattern is similar to the others.

Learning and other resources. Elliott wave analysis provides context, not prophecy. As the 20th century semanticist Alfred Korzybski put it in his book Science and Sanity (1933), “The map is not the territory … The only usefulness of a map depends on similarity of structure between the empirical world and the map.” And I would add, in the ever-changing markets, we can judge that similarity of structure only after the fact.

See the menu page Analytical Methods for a rundown on where to go for information on Elliott wave analysis.

By Tim Bovee, Portland, Oregon, October 15, 2024

Disclaimer

Tim Bovee, Private Trader tracks the analysis and trades of a private trader for his own accounts. Nothing in this blog constitutes a recommendation to buy or sell stocks, options or any other financial instrument. The only purpose of this blog is to provide education and entertainment.

No trader is ever 100 percent successful in his or her trades. Trading in the stock and option markets is risky and uncertain. Each trader must make trading decisions for his or her own account, and take responsibility for the consequences.

License
Creative Commons License

All content on Tim Bovee, Private Trader by Timothy K. Bovee is licensed under a Creative Commons Attribution-ShareAlike 4.0 International License.

Based on a work at www.timbovee.com.

Trader’s Notebook

3:30 p.m. New York time

Half an hour before the closing bell. The S&P 500 futures continued to rise during the session, reaching into the 5910s.

Elliott Wave Theory: The rise is a middle subwave — wave 3 — within a series of three 5th waves, each larger than the one before. The 5th waves, smaller to larger, began on October 10, October 2 and September 6.

Third waves tend to be the longest in a motive wave, which has five subwaves. So within the 5th wave that began on October 10, we’ll see a small 4th-wave downward correction after the 3rd wave is complete, and then a 5th wave that will finish the whole collection of 5th waves in the structure.

9:35 a.m. New York time

U.S. bond markets are closed today for a minor federal holiday, other U.S. markets, including stocks and options, will trade their normal schedules. Bonds resume their usual schedule on Tuesday, October 15.

What’s happening now? The S&P 500 E-mini futures continued to rise after trading resumed overnight, reaching into the 5870s.

What does it mean? Elliott Wave Theory designates the continued rise as a subwave within the rising 5th wave that began on October 10.

That 5th wave is a subwave of a larger 5th wave that began on October 7, which in turn is a subwave of a still larger 5th wave that began on September 6 from 5394.

Those 5th waves are all part of a still larger 3rd wave that began on August 7 from 5182.

When the smallest of those 5th waves, the one that began on October 10, reaches its end, the event will cascade up the series of 5th wave, ending them all and also the still larger 3rd wave, beginning a 4th-wave downward correction that will likely end somewhere from the 5610s into the 5640s, the 4th subwave of the 3rd wave that began on August 7.

[S&P 500 E-mini futures at 3:30 p.m., 90-minute bars, with volume]

What are the alternatives? None at present. They are certain to develop.

What does Elliott wave theory say? Here are the waves that underly the analyses.

Principal Analysis:

  • Rising wave 5{0} is underway. It is a wave of Intermediate degree that began in December 2018.
  • It is in its final subwave, wave 5{-1}.
  • Within wave 5{-1}, rising waves 5{-2}, 5{-3} and 5{-4} are underway, as is wave 5{-5}.
  • Wave 5{-5} is in its initial subwave, wave 1{-6}, which in turn is in its middle subwave, wave 3{-7}.
  • Wave 3{-7} is in its final; subwave, uptrending wave 5{-8}.
  • Wave 5{-8} is in its final subwave, wave 5{-9}, which is in its final subwave, rising wave 5{-10}.
  • Wave 5{-10} is in its middle subwave, wave 3{-11}.

Long-term Waves.

These are the waves currently in progress under my principal analysis. Each line on the list shows the wave number, with the subscript in curly brackets, the traditional degree name, the starting date, the starting price of the S&P 500 E-mini futures, and the direction of the wave.

  • S&P 500 Index:
  • 5{+3} Supercycle, 7/8/1932, 4.40 (up)
  • 5{+2} Cycle, 12/9/1974, 60.96 (up)
  • 5{+1} Primary, 3/6/2009, 666.79 (up)
  • 5{0} Intermediate, 12/26/2018, 2346.58 (up)
  • S&P 500 Futures
  • 5{-1} Minor, 10/27/2023, 4127.25 (up)
  • 3{-2} Minute, 10/27/23, 4127.75 (up)
  • 3{-3} Minuette, 10/27/23, 4127.75 (up)
  • 5{-4} Subminuette, 4/18/2024, 4963.50 (up)
  • 5{-5} Micro, 8/5/2024, 5120 (up)
  • 1{-6} Submicro, 8/5/2024, 5120 (up)
  • 3{-7} Minuscule, 8/7/2024, 5182 (up)
  • 5{-8} (unnamed), 9/6/2024, 5394 (up)

Reading the chart. Price movements — waves – – in Elliott wave analysis are labeled with numbers within trending waves and letters with corrective waves. The subscripts — numbers in curly brackets — designate the wave’s degree, which, in Elliott wave analysis, means the relative position of a wave within the larger and smaller structures that make up the chart. R.N. Elliott, who in the 1930s developed the form of analysis that bears his name, viewed the chart as a complex structure of smaller waves nested within larger waves, which in turn are nested within still larger waves. In mathematics it’s called a fractal structure, where at every scale the pattern is similar to the others.

Learning and other resources. Elliott wave analysis provides context, not prophecy. As the 20th century semanticist Alfred Korzybski put it in his book Science and Sanity (1933), “The map is not the territory … The only usefulness of a map depends on similarity of structure between the empirical world and the map.” And I would add, in the ever-changing markets, we can judge that similarity of structure only after the fact.

See the menu page Analytical Methods for a rundown on where to go for information on Elliott wave analysis.

By Tim Bovee, Portland, Oregon, October 14, 2024

Disclaimer

Tim Bovee, Private Trader tracks the analysis and trades of a private trader for his own accounts. Nothing in this blog constitutes a recommendation to buy or sell stocks, options or any other financial instrument. The only purpose of this blog is to provide education and entertainment.

No trader is ever 100 percent successful in his or her trades. Trading in the stock and option markets is risky and uncertain. Each trader must make trading decisions for his or her own account, and take responsibility for the consequences.

License
Creative Commons License

All content on Tim Bovee, Private Trader by Timothy K. Bovee is licensed under a Creative Commons Attribution-ShareAlike 4.0 International License.

Based on a work at www.timbovee.com.

Trader’s Notebook

3:30 p.m. New York time

Half an hour before the closing bell. The S&P 500 futures resumed their rise during the session, reaching into the 5860s.

Elliott Wave Theory: The uptrending 5th wave that began on October 2 completed its 4th subwave, a downward correction, during the session and began its rising 5th and final subwave.

9:35 a.m. New York time

What’s happening now? The S&P 500 E-mini futures declined overnight, reaching into the 5810s and then rising into the 5890s with the release of the Producer Price Index an hour before the opening bell.

What does it mean? The net sideways movement within the narrow range suggests, in Elliott Wave Theory, that the 4th-wave downward correction that began on October 9 from 5846.50 continues. The correction is the next-to-the-last subwave within an uptrending 5th-wave that began on October 2. That uptrending wave is a small part of a larger uptrending 5th wave that began on September 6 from 5394.

On the chart. Each wave on the chart is labeled with the wave number and a subscript in curly brackets indicating the wave’s distance in degrees from the current Intermediate degree wave within the fractal. Presently underway at the Intermediate degree is wave 5{0}, which began in December 2018.

What’s next? The smallest wave tracked on the present chart, the downward correction, wave 4{-10}, will be followed by a wave 5{-10}, an uptrending motive wave.

Fifth waves are famed for being quirky. Usually, they move beyond the end of the preceding 3rd wave, 5846.50 at this point. But sometimes the 5th-wave falls short, a condition known as truncation. Or sometimes continues longer in time and distance than would seem reasonable, a continues known as extension. There’s no way to tell at this point what sort of path wave 5{-10} will follow.

What we can know is that when wave 5{-10} reaches its end, it will also be the end of its parent wave 5{-9}, and its grandparet wave, 5{-8}, the latter having begun on September 9.

Wave 3{-7}, one degree larger, will also reach its end with the end of wave 5{-10}. Wave 3{-7} began on August 7 from 5182.

A 4th-wave downward correction, three degrees larger than the small downward correction now underway, wave 4{-10}, will follow.

[S&P 500 E-mini futures at 3:30 p.m., hourly bars, with volume]

What are the alternatives? None at present. I’m quite certain that ambiguities will present themselves, as they rarely fail to do.

What does Elliott wave theory say? Here are the waves that underly the analyses.

Principal Analysis:

  • Rising wave 5{0} is underway. It is a wave of Intermediate degree that began in December 2018.
  • It is in its final subwave, wave 5{-1}.
  • Within wave 5{-1}, rising waves 5{-2}, 5{-3} and 5{-4} are underway, as is wave 5{-5}.
  • Wave 5{-5} is in its initial subwave, wave 1{-6}, which in turn is in its middle subwave, wave 3{-7}.
  • Wave 3{-7} is in its final; subwave, uptrending wave 5{-8}.
  • Wave 5{-8} is in its final subwave, wave 5{-9}, which is in its next-to-the-last subwave, wave 4{-10}.

Long-term Waves.

These are the waves currently in progress under my principal analysis. Each line on the list shows the wave number, with the subscript in curly brackets, the traditional degree name, the starting date, the starting price of the S&P 500 E-mini futures, and the direction of the wave.

  • S&P 500 Index:
  • 5{+3} Supercycle, 7/8/1932, 4.40 (up)
  • 5{+2} Cycle, 12/9/1974, 60.96 (up)
  • 5{+1} Primary, 3/6/2009, 666.79 (up)
  • 5{0} Intermediate, 12/26/2018, 2346.58 (up)
  • S&P 500 Futures
  • 5{-1} Minor, 10/27/2023, 4127.25 (up)
  • 3{-2} Minute, 10/27/23, 4127.75 (up)
  • 3{-3} Minuette, 10/27/23, 4127.75 (up)
  • 5{-4} Subminuette, 4/18/2024, 4963.50 (up)
  • 5{-5} Micro, 8/5/2024, 5120 (up)
  • 1{-6} Submicro, 8/5/2024, 5120 (up)
  • 3{-7} Minuscule, 8/7/2024, 5182 (up)
  • 5{-8} (unnamed), 9/6/2024, 5394 (up)

Reading the chart. Price movements — waves – – in Elliott wave analysis are labeled with numbers within trending waves and letters with corrective waves. The subscripts — numbers in curly brackets — designate the wave’s degree, which, in Elliott wave analysis, means the relative position of a wave within the larger and smaller structures that make up the chart. R.N. Elliott, who in the 1930s developed the form of analysis that bears his name, viewed the chart as a complex structure of smaller waves nested within larger waves, which in turn are nested within still larger waves. In mathematics it’s called a fractal structure, where at every scale the pattern is similar to the others.

Learning and other resources. Elliott wave analysis provides context, not prophecy. As the 20th century semanticist Alfred Korzybski put it in his book Science and Sanity (1933), “The map is not the territory … The only usefulness of a map depends on similarity of structure between the empirical world and the map.” And I would add, in the ever-changing markets, we can judge that similarity of structure only after the fact.

See the menu page Analytical Methods for a rundown on where to go for information on Elliott wave analysis.

By Tim Bovee, Portland, Oregon, October 11, 2024

Disclaimer

Tim Bovee, Private Trader tracks the analysis and trades of a private trader for his own accounts. Nothing in this blog constitutes a recommendation to buy or sell stocks, options or any other financial instrument. The only purpose of this blog is to provide education and entertainment.

No trader is ever 100 percent successful in his or her trades. Trading in the stock and option markets is risky and uncertain. Each trader must make trading decisions for his or her own account, and take responsibility for the consequences.

License
Creative Commons License

All content on Tim Bovee, Private Trader by Timothy K. Bovee is licensed under a Creative Commons Attribution-ShareAlike 4.0 International License.

Based on a work at www.timbovee.com.

Trader’s Notebook

3:30 p.m. New York time

Half an hour before the closing bell. The S&P 500 futures zigzagged from the 5840s to the 5810s and back during the session.

The pause in the rise that began on October 2, when Elliott Wave Theory is applied, is a 4th-degree subwave within a 5th-wave uptrend. The 4th wave will be followed by a final rising subwave.

9:35 a.m. New York time

What’s happening now? The S&P 500 E-mini futures traded sideways in a narrow range overnight, whipsawing briefly with the release of the latest Consumer Price Index data, and ending up with a net downward movement.

What does it mean? Elliott Wave Theory sees the largely sideways movement as an uptrending 3rd subwave within a the final subwave, wave 5, within a larger uptrending 5th wave that began on September 6.

A revised analysis. The main impact of Yesterday afternoon’s revision of the analysis is to strengthen the uptrendng nature of the market. The prior analysis, knocked out by a couple of violations of Elliott Wave Theory rules, had seen any rise as an upward correction within a downtrending 5th wave. The current analysis is an uptrending 5th wave, pure and simple.

The bigger picture. As part of my analytical revision, I also revised the labeling of some of the larger waves, which are listed on the chart in the upper-right. I’ve also posted, below, a list of ongoing waves still underway, up to the S&P 500 index 5th wave that began on on July 8, 1932. and is in its final subwave.

Yes, the chart is looking bullish over the past couple of months. Yes, the index has been in an uptrend for 92 years, beginning during the Great Depression of the 1930s. But it’s also clear, based on the number of 5th and final waves within the wave structure, that the bullish trend will be gradually unwindng over tme.

[S&P 500 E-mini futures at 3:30 p.m., 90-minute bars, with volume]

What are the alternatives?

What does Elliott wave theory say? Here are the waves that underly the analyses.

Principal Analysis:

  • Rising wave 5{0} is underway. It is a wave of Intermediate degree that began in December 2018.
  • It is in its final subwave, wave 5{-1}.
  • Within wave 5{-1}, rising waves 5{-2}, 5{-3} and 5{-4} are underway, as is wave 5{-5}.
  • Wave 5{-5} is in its initial subwave, wave 1{-6}, which in turn is in its middle subwave, wave 3{-7}.
  • Wave 3{-7} is in its final; subwave, uptrending wave 5{-8}.
  • Wave 5{-8} is in its final subwave, wave 5{-9}, which is in its next-to-the-last subwave, wave 4{-10}.

Long-term Waves.

These are the waves currently in progress under my principal analysis. Each line on the list shows the wave number, with the subscript in curly brackets, the traditional degree name, the starting date, the starting price of the S&P 500 E-mini futures, and the direction of the wave.

  • S&P 500 Index:
  • 5{+3} Supercycle, 7/8/1932, 4.40 (up)
  • 5{+2} Cycle, 12/9/1974, 60.96 (up)
  • 5{+1} Primary, 3/6/2009, 666.79 (up)
  • 5{0} Intermediate, 12/26/2018, 2346.58 (up)
  • S&P 500 Futures
  • 5{-1} Minor, 10/27/2023, 4127.25 (up)
  • 3{-2} Minute, 10/27/23, 4127.75 (up)
  • 3{-3} Minuette, 10/27/23, 4127.75 (up)
  • 5{-4} Subminuette, 4/18/2024, 4963.50 (up)
  • 5{-5} Micro, 8/5/2024, 5120 (up)
  • 1{-6} Submicro, 8/5/2024, 5120 (up)
  • 3{-7} Minuscule, 8/7/2024, 5182 (up)
  • 5{-8} (unnamed), 9/6/2024, 5394 (up)

Reading the chart. Price movements — waves – – in Elliott wave analysis are labeled with numbers within trending waves and letters with corrective waves. The subscripts — numbers in curly brackets — designate the wave’s degree, which, in Elliott wave analysis, means the relative position of a wave within the larger and smaller structures that make up the chart. R.N. Elliott, who in the 1930s developed the form of analysis that bears his name, viewed the chart as a complex structure of smaller waves nested within larger waves, which in turn are nested within still larger waves. In mathematics it’s called a fractal structure, where at every scale the pattern is similar to the others.

Learning and other resources. Elliott wave analysis provides context, not prophecy. As the 20th century semanticist Alfred Korzybski put it in his book Science and Sanity (1933), “The map is not the territory … The only usefulness of a map depends on similarity of structure between the empirical world and the map.” And I would add, in the ever-changing markets, we can judge that similarity of structure only after the fact.

See the menu page Analytical Methods for a rundown on where to go for information on Elliott wave analysis.

By Tim Bovee, Portland, Oregon, October 10, 2024

Disclaimer

Tim Bovee, Private Trader tracks the analysis and trades of a private trader for his own accounts. Nothing in this blog constitutes a recommendation to buy or sell stocks, options or any other financial instrument. The only purpose of this blog is to provide education and entertainment.

No trader is ever 100 percent successful in his or her trades. Trading in the stock and option markets is risky and uncertain. Each trader must make trading decisions for his or her own account, and take responsibility for the consequences.

License
Creative Commons License

All content on Tim Bovee, Private Trader by Timothy K. Bovee is licensed under a Creative Commons Attribution-ShareAlike 4.0 International License.

Based on a work at www.timbovee.com.

Trader’s Notebook

3:30 p.m. New York time

Half an hour before the closing bell. The S&P 500 futures rose during the session, reaching 5840 and then pulling back slightly.

That session peak has exceeded the starting point of wave of a smaller 1st subwave and a larger parent 1st wave.

In this morning’s discussion I described a rule of Elliott Wave Theory and the possiblity that it would be broken. That higher high broke the rule, and I have reanalyzed the chart. See the “What does it mean?” section below for a discussion of the rule.

A new analysis. In order to bring the analysis back within the rule, I had to change the wave count of the current rise that began on October 7 from a corrective wave to a motive wave. To do that I had to rework the wave labeling all the way back to the decline that began on August 28.

This morning I described the wave labeling system, and I’ll repeated that here.

On the chart each wave is labelled with a wave number or letter followed by a subscript in curly brackets showng the waves distance in degrees from the Intermediate degree, presently wave 5{0}, which began in December 2018.

Here are the wave number changes, and the ending date of each:

  • wave 3{-8}, unchanged, August 28
  • wave 3{-11} to wave 4{-8}, September 6.
  • wave 4{-11} to wave 3{-9}, September 26
  • wave 1{-13} to wave 4{-9}, October 2
  • wave 1{-14} to wave 2{-10}, October 7
  • waves 3{-13 and 2{-14} to waves 5{-8} and 5{-9}, underway

The chart immediately below is based on the new analysis. I’ve left this morning’s chart in place for comparison. Two sections, “What are the alternatives?” and “What does Elliott Wave Theory say”, will remain as they were this morning and will be revised for the October 10 morning analysis.

[S&P 500 E-mini futures at 3:30 p.m., 90-minute bars, with volume]

9:35 a.m. New York time

What’s happening now? The S&P 500 E-mini futures reached a low overnight of 5780.75 and then rose, reaching just above 5800.

What does it mean? Elliott Wave Theory have a rule that might come into play with the chart’s present configuration.

The present wave line-up, from lower degree to higher, is rising wave 2 within falling wave 3 within within falling wave 1 within falling wave 5.

On the chart each wave is labelled with a wave number or letter followed by a subscript in curly brackets showng the waves distance in degrees from the Intermediate degree, presently wave 5{0}, which began in December 2018.

The wave line-up on the chart, from lower degree to higher, is wave 2{-14} within wave 3{-13} within wave 1{-12}. All of that is within wave 5{-11}, a downtrend that began on September 26.

Elliott Wave Theory rules, if broken, invalidate the analysis.

For example, the smallest degree on the chart is wave 2{-14}. The rule is that if a 2nd wave moves beyond the start of the of the preceding first wave, the wave in question isn’t a 2nd wave and something else is going on. Wave 1{-14} began on October 6 from 5808. If the present rising 2nd wave moves above 5808, then the anaysis will be redone.

Most likely, the revised analysis would conclude that the wave one degree higher, wave 2{-13}, didn’t end on October 6. Instead, the high on that date was the end of the final subwave of wave 2{-13} — wave C{-14}. The alternative analysis had seen this possibility since I marked wave 2{-13} as having ended — Alternative #2 in today’s report.

Of course, the 2nd-wave rule also applies to wave 2{-13} — if it moves above the start of wave 1{-13}, then it’s not a 2nd wave and requires a reanalysis. Wave 1{-13} began on September 26 from 5830. If the price moves above that level, then it’s time for a reanalysis.

The beauty of Elliott Wave Theory isn’t that analyses are never wrong. Stock charts are filled with ambiguity. Elliott Wave Theory, compared to other methods, always shows the analyst precisely what went wrong.

This chart has been replaced by a chart showing the afternoon analysis based on alternative #3, which has become the principal analysis. See the afternoon analysis, above.

[S&P 500 E-mini futures at 9:35 a.m., 90-minute bars, with volume]

What are the alternatives? There were two, and both are now invalid in light of a fresh analysis in the afternoon post. See above.

Alternative #1:

Occasionally a subwave will take a compound form, containing two or three corrective patterns, each composed of three subwaves — waves A, B and C — and connected to the prior pattern by a wave called an X wave. This would mean that the 4th-wave upward correction is still underway and would delay the start of the following 5th wave downtrend.

Alternative #2:

The small 2nd-wave uptrend that began on October 2 is still underway, has completed its first two subwaves, waves A and B, and is now in its final subwave, wave C.

What does Elliott wave theory say? Here are the waves that underlaid the morning analyses. They are now invalid in light of a fresh analysis in the afternoon post. See above..

Principal Analysis

  • Rising wave 5{0} is underway. It is a wave of Intermediate degree that began in December 2018.
  • It is in its final subwave, wave 5{-1}.
  • Within wave 5{-1}, rising waves 5{-2}, 5{-3} and 5{-4} are underway, as is wave 5{-5}.
  • Wave 5{-5} is in its initial subwave, wave 1{-6}, which in turn is in its middle subwave, wave 3{-7}.
  • Wave 3{-7} is in its next-to-the-last subwave, wave 4{-8}, a downward correction.
  • Wave 4{-8} is in its final subwave, wave C{-9}, which is within wave 5{-10}.
  • Wave 5{-10} is in its initial subwave, declining wave 5{-11}, which in its 1st subwave, declining wave 1{-12}, which in turn is in a 3rd-wave downtrend, wave 3{-13}.
  • Wave 2{-14}, a subwave of wave 3{-13}, is now underway.

Alternative #1:

  • Wave 4{-11} a rising correction, is taking a compound form,
  • The three subwaves — waves A{-12}, B{-12} and C{-12} — have completed the first corrective pattern. A declining connector wave — wave X{-12} is underway.

Alternative #2

  • Wave 2{-13}, an upward correction, continues and is in its 3rd subwave, wave C{-14}.

Reading the chart. Price movements — waves – – in Elliott wave analysis are labeled with numbers within trending waves and letters with corrective waves. The subscripts — numbers in curly brackets — designate the wave’s degree, which, in Elliott wave analysis, means the relative position of a wave within the larger and smaller structures that make up the chart. R.N. Elliott, who in the 1930s developed the form of analysis that bears his name, viewed the chart as a complex structure of smaller waves nested within larger waves, which in turn are nested within still larger waves. In mathematics it’s called a fractal structure, where at every scale the pattern is similar to the others.

Learning and other resources. Elliott wave analysis provides context, not prophecy. As the 20th century semanticist Alfred Korzybski put it in his book Science and Sanity (1933), “The map is not the territory … The only usefulness of a map depends on similarity of structure between the empirical world and the map.” And I would add, in the ever-changing markets, we can judge that similarity of structure only after the fact.

See the menu page Analytical Methods for a rundown on where to go for information on Elliott wave analysis.

By Tim Bovee, Portland, Oregon, October 9, 2024

Disclaimer

Tim Bovee, Private Trader tracks the analysis and trades of a private trader for his own accounts. Nothing in this blog constitutes a recommendation to buy or sell stocks, options or any other financial instrument. The only purpose of this blog is to provide education and entertainment.

No trader is ever 100 percent successful in his or her trades. Trading in the stock and option markets is risky and uncertain. Each trader must make trading decisions for his or her own account, and take responsibility for the consequences.

License
Creative Commons License

All content on Tim Bovee, Private Trader by Timothy K. Bovee is licensed under a Creative Commons Attribution-ShareAlike 4.0 International License.

Based on a work at www.timbovee.com.

Trader’s Notebook

3:30 p.m. New York time

Half an hour before the closing bell. The S&P 500 futures rose during the session, approaching 5800. Elliott Wave Theory: The 5th-wave downtrend that began on September 26 is in its first subwave, which in turn is in its declining 3rd subwave. The present rise is a subwave of the larger declining 3rd wave.

9:35 a.m. New York time

What’s happening now? The S&P 500 E-mini futures rose overnight from the 5720s into the 5770s.

What does it mean? Elliott Wave Theory sees the upward movement as a 4th-wave correction within the middle subwave, wave 3, of the first subwave of a a 5th-wave downtrend that began on September 26.

When the 4th-wave correction is complete, the parent wave, a downtrending 1st wave, will resume with its final subwave. When complete, that final subwave will also be the end of the first wave of within the September 26 5th wave. A 2nd wave upward correction will follow.

[S&P 500 E-mini futures at 3:30 p.m., 80-minute bars, with volume]

What are the alternatives? There are two.

Alternative #1:

Occasionally a subwave will take a compound form, containing two or three corrective patterns, each composed of three subwaves — waves A, B and C — and connected to the prior pattern by a wave called an X wave. This would mean that the 4th-wave upward correction is still underway and would delay the start of the following 5th wave downtrend.

Alternative #2:

The 4th-wave upward correction that began on September 6 is still underway and will soon reverse, reaching above the September 26 high, 5830. The lower it goes, the less likely this scenario becomes.

What does Elliott wave theory say? Here are the waves that underly the analyses.

Principal Analysis:

  • Rising wave 5{0} is underway. It is a wave of Intermediate degree that began in December 2018.
  • It is in its final subwave, wave 5{-1}.
  • Within wave 5{-1}, rising waves 5{-2}, 5{-3} and 5{-4} are underway, as is wave 5{-5}.
  • Wave 5{-5} is in its initial subwave, wave 1{-6}, which in turn is in its middle subwave, wave 3{-7}.
  • Wave 3{-7} is in its next-to-the-last subwave, wave 4{-8}, a downward correction.
  • Wave 4{-8} is in its final subwave, wave C{-9}, which is within wave 5{-10}.
  • Wave 5{-10} is in its initial subwave, declining wave 5{-11}, which in its 1st subwave, declining wave 1{-12}, which in turn is in a 3rd-wave downtrend, wave 3{-13}.

Alternative #1:

  • Wave 4{-11} a rising correction, is taking a compound form,
  • The three subwaves — waves A{-12}, B{-12} and C{-12} — have completed the first corrective pattern. A declining connector wave — wave X{-12} is underway

Reading the chart. Price movements — waves – – in Elliott wave analysis are labeled with numbers within trending waves and letters with corrective waves. The subscripts — numbers in curly brackets — designate the wave’s degree, which, in Elliott wave analysis, means the relative position of a wave within the larger and smaller structures that make up the chart. R.N. Elliott, who in the 1930s developed the form of analysis that bears his name, viewed the chart as a complex structure of smaller waves nested within larger waves, which in turn are nested within still larger waves. In mathematics it’s called a fractal structure, where at every scale the pattern is similar to the others.

Learning and other resources. Elliott wave analysis provides context, not prophecy. As the 20th century semanticist Alfred Korzybski put it in his book Science and Sanity (1933), “The map is not the territory … The only usefulness of a map depends on similarity of structure between the empirical world and the map.” And I would add, in the ever-changing markets, we can judge that similarity of structure only after the fact.

See the menu page Analytical Methods for a rundown on where to go for information on Elliott wave analysis.

By Tim Bovee, Portland, Oregon, October 8, 2024

Disclaimer

Tim Bovee, Private Trader tracks the analysis and trades of a private trader for his own accounts. Nothing in this blog constitutes a recommendation to buy or sell stocks, options or any other financial instrument. The only purpose of this blog is to provide education and entertainment.

No trader is ever 100 percent successful in his or her trades. Trading in the stock and option markets is risky and uncertain. Each trader must make trading decisions for his or her own account, and take responsibility for the consequences.

License
Creative Commons License

All content on Tim Bovee, Private Trader by Timothy K. Bovee is licensed under a Creative Commons Attribution-ShareAlike 4.0 International License.

Based on a work at www.timbovee.com.

Trader’s Notebook

3:30 p.m. New York time

Half an hour before the closing bell. The S&P 500 futures continued to fall during the session. In Elliott Wave Theory, the continued decline suggests that wave 3, a subwave within the first subwave of a 5th-wave downtrend. The wave of the smallest degree, wave 3, began on October 6 from 5808. That interpretation confirms this morning’s somewhat tentative analysis.

9:35 a.m. New York time

What’s happening now? The S&P 500 E-mini futures fell fewer than 50 points after trading resumed overnight and then rose a fraction of the decline.

What does it mean? The decline, as analyzed usng Elliott Wave Theory, is a subwave buried two-degrees deep within a downtrending 5th wave that began on September 26.

The 5th wave is in its initial subwave. One degree lower, the overnight decline appears to be a downtrending wave 3 that began moments after trading resumed on Sunday, New York time.

That conclusion carries a caveat. It’s possible that the small 2nd-wave upward correction that began on October 6 is still underway. [Invalidated by the afternoon analysis.]

[S&P 500 E-mini futures at 3:30 p.m., 80-minute bars, with volume]

What are the alternatives? There are three, one of which is no longer a possibility.

Alternative #1:

Occasionally a subwave will take a compound form, containing two or three corrective patterns, each composed of three subwaves — waves A, B and C — and connected to the prior pattern by a wave called an X wave. This would mean that the 4th-wave upward correction is still underway and would delay the start of the following 5th wave downtrend.

Alternative #2:

The 4th-wave upward correction that began on September 6 is still underway and will soon reverse, reaching above the September 26 high, 5830. The lower it goes, the less likely this scenario becomes.

Alternative #3: [Invalidated by the afternoon analysis]

The small 2nd-wave uptrend that began on October 2 is still underway, has completed its first subwave, wave A, and is now in its second, wave B.

What does Elliott wave theory say? Here are the waves that underly the analyses.

Principal Analysis:Here are the waves that underly the analyses.

Principal Analysis:

  • Rising wave 5{0} is underway. It is a wave of Intermediate degree that began in December 2018.
  • It is in its final subwave, wave 5{-1}.
  • Within wave 5{-1}, rising waves 5{-2}, 5{-3} and 5{-4} are underway, as is wave 5{-5}.
  • Wave 5{-5} is in its initial subwave, wave 1{-6}, which in turn is in its middle subwave, wave 3{-7}.
  • Wave 3{-7} is in its next-to-the-last subwave, wave 4{-8}, a downward correction.
  • Wave 4{-8} is in its final subwave, wave C{-9}, which is within wave 5{-10}.
  • Wave 5{-10} is in its initial subwave, declining wave 5{-11}, which in its 1st subwave, declining wave 1{-12}, which in turn is in a 3rd-wave downtrend, wave 3{-13}.

Alternative #1:

  • Wave 4{-11} a rising correction, is taking a compound form,
  • The three subwaves — waves A{-12}, B{-12} and C{-12} — have completed the first corrective pattern. A declining connector wave — wave X{-12} is underway.

Alternative #2:

  • Wave 4{-11} continues to decline as a subwave of wave C{-12}.
  • When the subwave is complete wave C{-12} within wave 4{-11} will continue to rise.

Alternative #3 [Invalidate by the afternoon analysis]

  • Wave 2{-13}, an upward correction, continues and is in its 3rd subwave, wave B{-14}.

Reading the chart. Price movements — waves – – in Elliott wave analysis are labeled with numbers within trending waves and letters with corrective waves. The subscripts — numbers in curly brackets — designate the wave’s degree, which, in Elliott wave analysis, means the relative position of a wave within the larger and smaller structures that make up the chart. R.N. Elliott, who in the 1930s developed the form of analysis that bears his name, viewed the chart as a complex structure of smaller waves nested within larger waves, which in turn are nested within still larger waves. In mathematics it’s called a fractal structure, where at every scale the pattern is similar to the others.

Learning and other resources. Elliott wave analysis provides context, not prophecy. As the 20th century semanticist Alfred Korzybski put it in his book Science and Sanity (1933), “The map is not the territory … The only usefulness of a map depends on similarity of structure between the empirical world and the map.” And I would add, in the ever-changing markets, we can judge that similarity of structure only after the fact.

See the menu page Analytical Methods for a rundown on where to go for information on Elliott wave analysis.

By Tim Bovee, Portland, Oregon, October 7, 2024

Disclaimer

Tim Bovee, Private Trader tracks the analysis and trades of a private trader for his own accounts. Nothing in this blog constitutes a recommendation to buy or sell stocks, options or any other financial instrument. The only purpose of this blog is to provide education and entertainment.

No trader is ever 100 percent successful in his or her trades. Trading in the stock and option markets is risky and uncertain. Each trader must make trading decisions for his or her own account, and take responsibility for the consequences.

License
Creative Commons License

All content on Tim Bovee, Private Trader by Timothy K. Bovee is licensed under a Creative Commons Attribution-ShareAlike 4.0 International License.

Based on a work at www.timbovee.com.

Trader’s Notebook

3:30 p.m. New York time

Half an hour before the closing bell. The S&P 500 futures attained an overnight peak 5803.25 as the opening bell approached, and then fell during the session into the 5740s, fluctuating narrowly thereafter.

The session-opening Elliott Wave Theory analysis remains unchanged. A 2nd-wave upward correction continues within a larger 5th-wave downtrend that began on September 26.

9:35 a.m. New York time

What’s happening now? The S&P 500 E-mini futures rose sharply into the 5790s upon the release of the Employment Situation Report for September.

What does it mean? Elliott Wave Theory sees the movement as a 2nd-wave upward correction within the initial subwave of a 5th-wave downtrend that began on September 26.

Under the Elliott Wave rules, the rising 2nd wave must remain below the start of the preceding 3rd wave — 5830. If it were to move above that level, then something else is going on and the analysis will be redone.

[S&P 500 E-mini futures at 3:30 p.m., 80-minute bars, with volume]

What are the alternatives? There are two.

Alternative #1:

Occasionally a subwave will take a compound form, containing two or three corrective patterns, each composed of three subwaves — waves A, B and C — and connected to the prior pattern by a wave called an X wave. This would mean that the 4th-wave upward correction is still underway and would delay the start of the following 5th wave downtrend.

Alternative #2:

The 4th-wave upward correction that began on September 6 is still underway and will soon reverse, reaching above the September 26 high, 5830. The lower it goes, the less likely this scenario becomes.

What does Elliott wave theory say? Here are the waves that underly the analyses.

Principal Analysis:

  • Rising wave 5{0} is underway. It is a wave of Intermediate degree that began in December 2018.
  • It is in its final subwave, wave 5{-1}.
  • Within wave 5{-1}, rising waves 5{-2}, 5{-3} and 5{-4} are underway, as is wave 5{-5}.
  • Wave 5{-5} is in its initial subwave, wave 1{-6}, which in turn is in its middle subwave, wave 3{-7}.
  • Wave 3{-7} is in its next-to-the-last subwave, wave 4{-8}, a downward correction.
  • Wave 4{-8} is in its final subwave, wave C{-9}, which is within wave 5{-10}.
  • Wave 5{-10} is in its initial subwave, declining wave 5{-11}, which in its 1st subwave, declining wave 1{-12}, which in turn is in a 2nd-wave upward correction, wave 2{-13}.

Alternative #1:

  • Wave 4{-11} a rising correction, is taking a compound form,
  • The three subwaves — waves A{-12}, B{-12} and C{-12} — have completed the first corrective pattern. A declining connector wave — wave X{-12} is underway.

Alternative #2:

  • Wave 4{-11} continues to decline as a subwave of wave C{-12}.
  • When the subwave is complete wave C{-12} within wave 4{-11} will continue to rise.

Learning and other resources. Elliott wave analysis provides context, not prophecy. As the 20th century semanticist Alfred Korzybski put it in his book Science and Sanity (1933), “The map is not the territory … The only usefulness of a map depends on similarity of structure between the empirical world and the map.” And I would add, in the ever-changing markets, we can judge that similarity of structure only after the fact.

See the menu page Analytical Methods for a rundown on where to go for information on Elliott wave analysis.

By Tim Bovee, Portland, Oregon, October 4, 2024

Disclaimer

Tim Bovee, Private Trader tracks the analysis and trades of a private trader for his own accounts. Nothing in this blog constitutes a recommendation to buy or sell stocks, options or any other financial instrument. The only purpose of this blog is to provide education and entertainment.

No trader is ever 100 percent successful in his or her trades. Trading in the stock and option markets is risky and uncertain. Each trader must make trading decisions for his or her own account, and take responsibility for the consequences.

License
Creative Commons License

All content on Tim Bovee, Private Trader by Timothy K. Bovee is licensed under a Creative Commons Attribution-ShareAlike 4.0 International License.

Based on a work at www.timbovee.com.