3:30 p.m. New York time
Half an hour before the closing bell. The S&P 500 futures rose from the 4650s to the 4670s during the session. No change in this morning’s analysis. Wave C within the 2nd-wave upward correction that began on October 13 continues. I’ve updated the lowest of the three charts and left others as they were during this morning’s analysis.
9:35 a.m. New York time
What’s happening now? The S&P 500 E-mini futures gapped higher when trading resumed overnight, opening at 4666.50, more than 30 points higher than a level that triggers a reanalysis of the chart.
S&P 500 E-mini futures at 8:30 a.m., 5-minute bars.
On the S&P 500 futures chart showing the gap, above, the trigger level for a reanalysis is shown as a red line.
What does it mean? The trigger point was 4634.50, the start of the 1st wave preceding what had been labeled a 4th-wave upward correction that began on October 27. A rule of Elliott Wave Theory says that a 4th wave never moves above the beginning of the preceding 1st wave. When it does happen, it’s time to reanalyze the chart so that the rule remains intact, so that the unthinkable never happened.
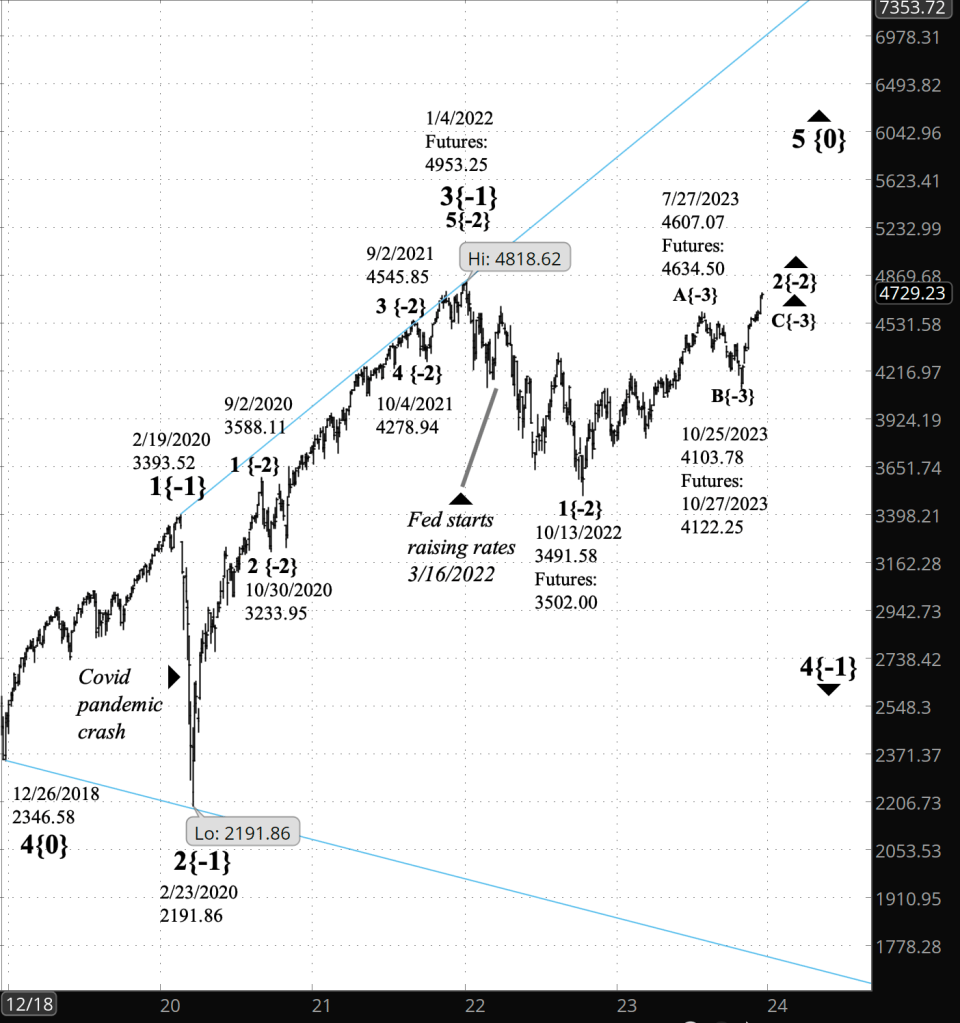
The chart below is the S&P 500 index starting with the January 4, 2022 peak. That peak marked the end of the 3rd wave within an expanding Diagonal Triangle that began in December 2018. The triangle’s 4th wave is now underway.
On the chart, the degree of each wave within the fractal structure is shown as a subscript in curly brackets and a number indicating the wave’s relationship to what Elliott called the Intermediate degree. I show that degree as {0} on the chart.
The upper boundary of the Diagonal Triangle’s price channel is shown as a blue line.
S&P 500 index at 9:30 a.m., 3-day bars.
Presently underway are wave 4{-1}, a subwave of wave 5{0}.
The chart labels show the index price and also the futures price, and date where it differs from the index.
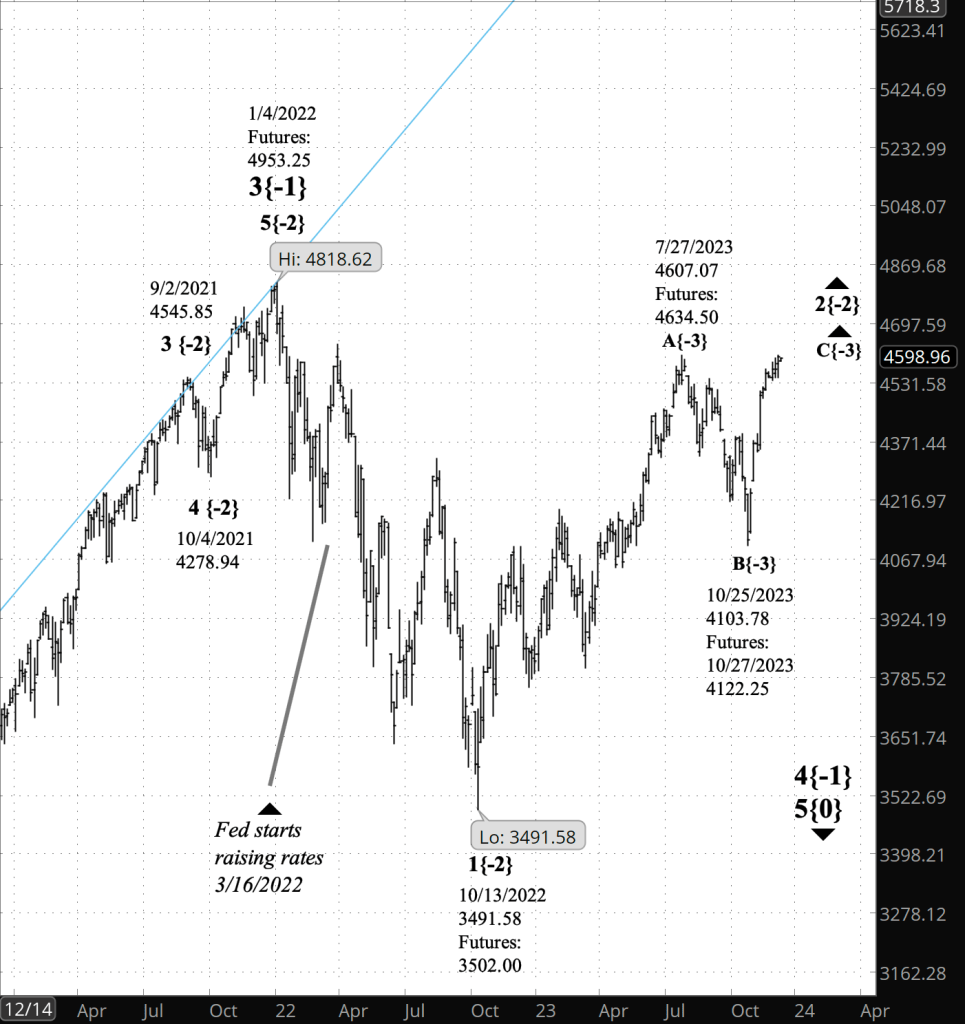
The main change is within wave 2{-2}, a rising correction that began on October 13, 2022. The former analysis showed wave 2{-2} as having ended on July 27, 2023 and downtrending wave 3{-2} as having begun on that date.
Because of the Elliott Wave Theory rule violation, the July 27 turning point has been demoted to a subwave, wave A{-3}, of wave 2{-2}, followed by a descending wave B{-3}.
Wave C{-3}, the rising wave that began on October 25 on the index and October 27 on the futures, is now underway.
When wave C{-3} is complete, it will also be the end of the parent wave 2{-2} and the start of a powerful downtrend, wave 3{-2}, which will carry the price below 3491.58 on the index, 3502 on the futures, and almost certainly significantly below that level.
The present upward correction, wave 2{-2}, has five subwaves in its first segment, wave A{-3}, and also in its second segment, wave B{-3}. In a Zigzag or Flat corrective pattern, the B wave always has three subwaves. The present wave counts suggest that wave 2{-2} is taking the form of a triangle.
In any case, some corrections take a compound form, and if that happens, wave 2{-2} will contain two or three corrective patterns and would last longer than it will if it takes the form of a simple correction.
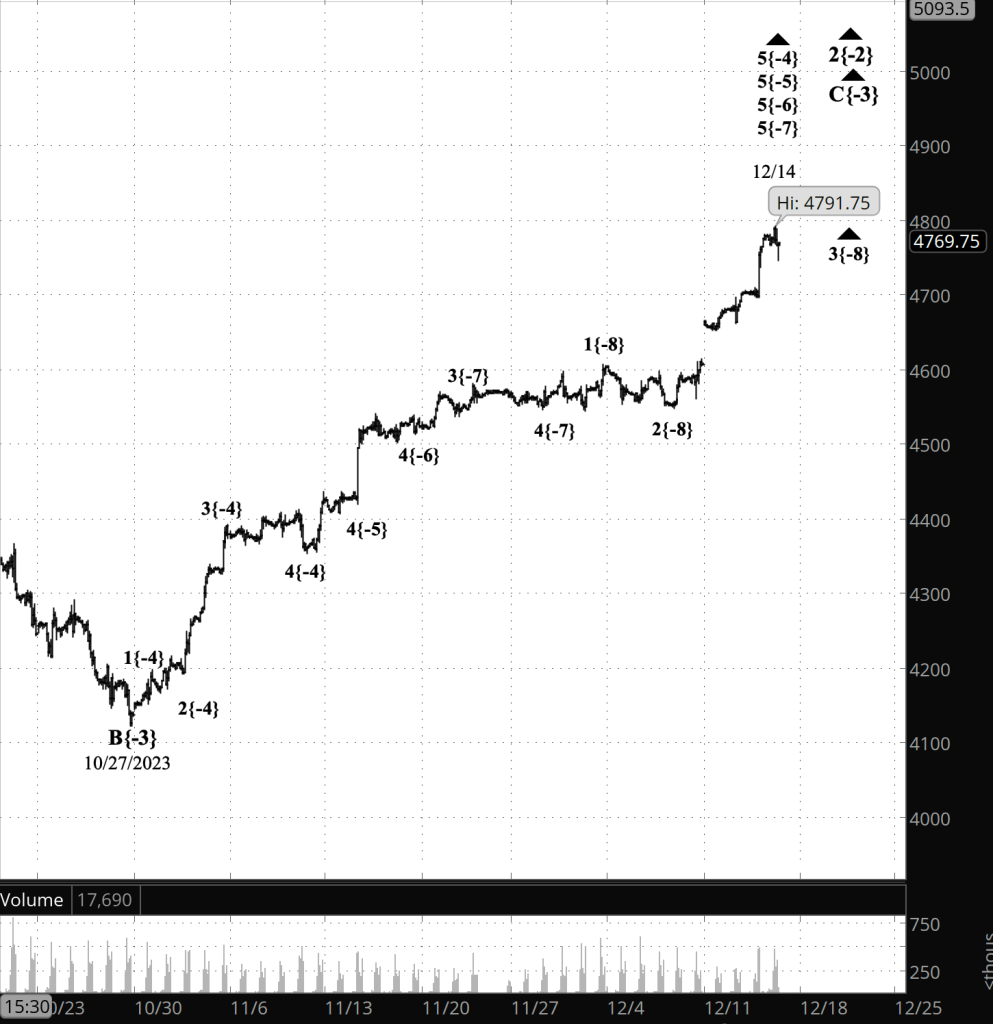
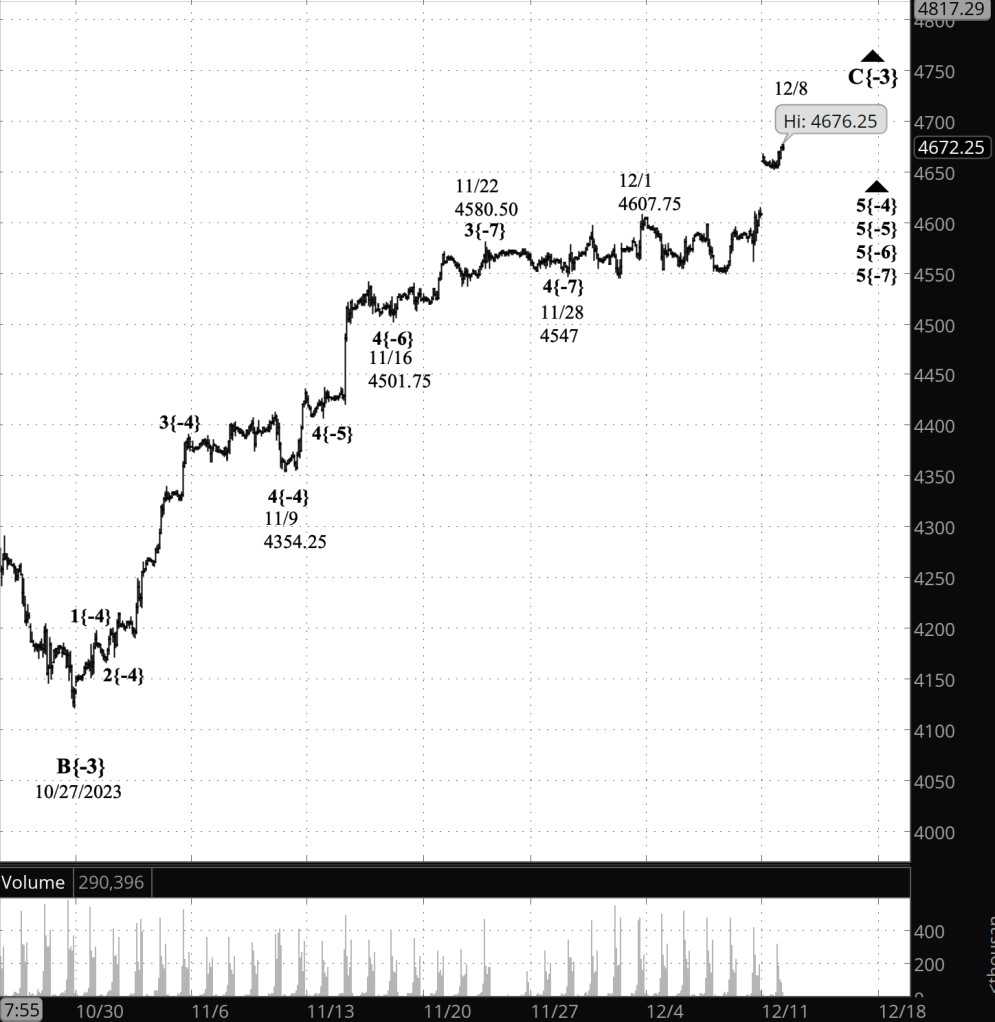
The next chart shows a detailed analysis of the ongoing C wave within the 2nd-wave correction.
[S&P 500 E-mini futures at 3:30 p.m., 85-minute bars, with volume]
What are the alternatives? None at present. They are certain to develop.
What does Elliott wave theory say? Here are the waves that underly the analyses.
Principal Analysis:
- A downtrend, wave 4{-1}, began on January 4, 2022 and is underway.
- Within wave 4{-1}, an upward correction, wave 2{-2}, began on October 13, 2022.
- The third wave of the correction, wave C{-3}, is underway.
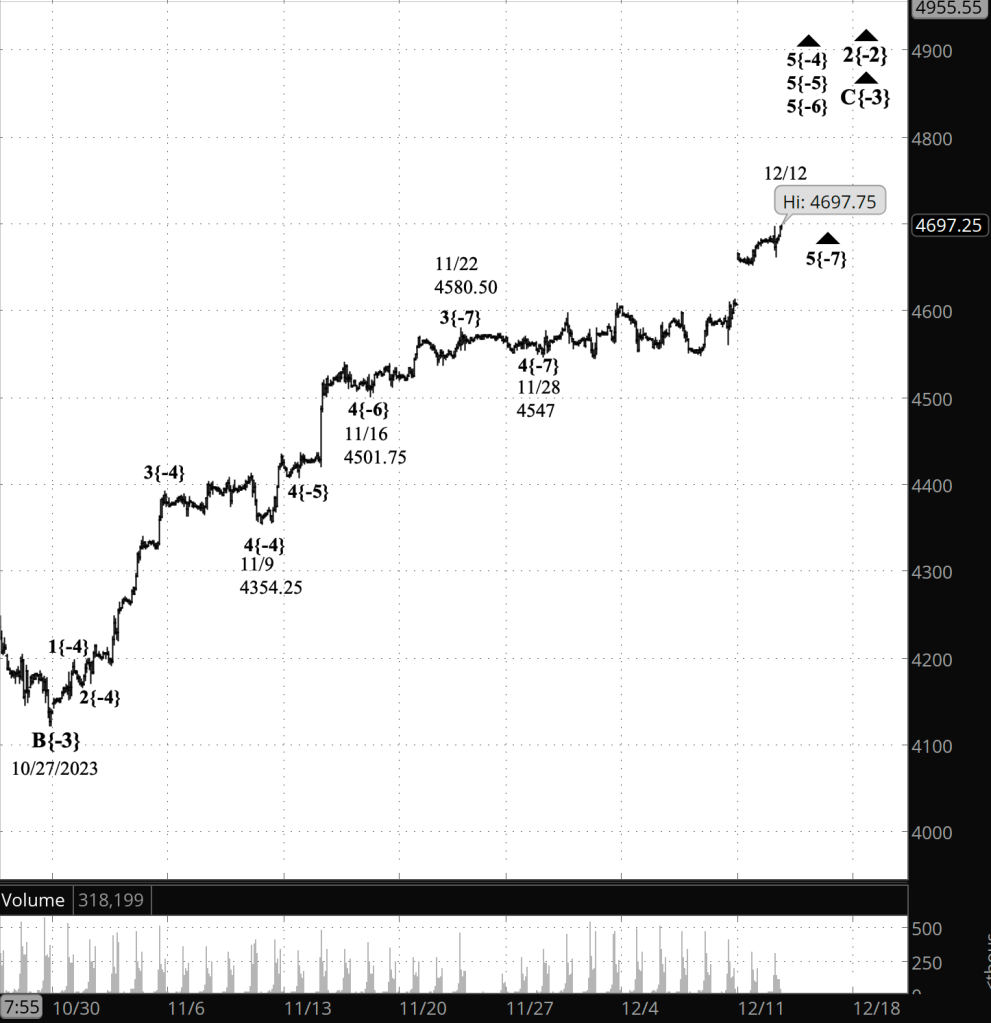
- Wave C{-3} has reached its 5th and final subwave, wave 5{-4} and a series of smaller 5th waves, down to wave 5{-7}.
- When wave 5{-7} is complete, it will cascade up the fractal structure, also ending wave 5{-4} and its parent, wave C{-3} and possibly the upward corection, wave 2{-2}.
We Are Here.
These are the waves currently in progress under my principal analysis. Each line on the list shows the wave number, with the subscript in curly brackets, the traditional degree name, the starting date, the starting price of the S&P 500 E-mini futures, and the direction of the wave.
- S&P 500 Index:
- 5{+3} Supercycle, 7/8/1932, 4.40 (up)
- 5{+2} Cycle, 12/9/1974, 60.96 (up)
- 5{+1} Primary, 3/6/2009, 666.79 (up)
- 5{0} Intermediate, 12/26/2018, 2346.58 (up)
- S&P 500 Futures and index:
- 4{-1} Minor, 1/4/2022, 4953.25 (down) (futures), 4818.62 (down) (index)
- S&P 500 Futures:
- 2{-2} Minute, 10/13/2022, 3491.58 ()
- C{-3} Minuette, 10/27/2023, 4122.25 (up)
Reading the chart. Price movements — waves – – in Elliott wave analysis are labeled with numbers within trending waves and letters with corrective waves. The subscripts — numbers in curly brackets — designate the wave’s degree, which, in Elliott wave analysis, means the relative position of a wave within the larger and smaller structures that make up the chart. R.N. Elliott, who in the 1930s developed the form of analysis that bears his name, viewed the chart as a complex structure of smaller waves nested within larger waves, which in turn are nested within still larger waves. In mathematics it’s called a fractal structure, where at every scale the pattern is similar to the others.
Learning and other resources. Elliott wave analysis provides context, not prophecy. As the 20th century semanticist Alfred Korzybski put it in his book Science and Sanity (1933), “The map is not the territory … The only usefulness of a map depends on similarity of structure between the empirical world and the map.” And I would add, in the ever-changing markets, we can judge that similarity of structure only after the fact.
See the menu page Analytical Methods for a rundown on where to go for information on Elliott wave analysis.
By Tim Bovee, Portland, Oregon, December 11, 2023
Disclaimer
Tim Bovee, Private Trader tracks the analysis and trades of a private trader for his own accounts. Nothing in this blog constitutes a recommendation to buy or sell stocks, options or any other financial instrument. The only purpose of this blog is to provide education and entertainment.
No trader is ever 100 percent successful in his or her trades. Trading in the stock and option markets is risky and uncertain. Each trader must make trading decisions for his or her own account, and take responsibility for the consequences.
License

All content on Tim Bovee, Private Trader by Timothy K. Bovee is licensed under a Creative Commons Attribution-ShareAlike 4.0 International License.
Based on a work at www.timbovee.com.


You must be logged in to post a comment.