Trader’s Notebook

3:30 p.m. New York time

Half an hour before the closing bell. The S&P 500 futures have traded sideways during the session, remaining below the July 19 peak that marks the highest point of the upward correction that began on October 13, 2022.

Since July 19 the price has engaged in a five-wave pattern, indicative of a trending move (as opposed to a counter-trend correction). That suggests that the July 19 peak was the end of the middle leg of wave E{-4}, the wave that is in play as the corrective pattern nears its end.

On this very near-term chart, I’ve marked the peak as the end of wave C{-5} and falling wave D{-5} as being underway. In the smaller wave count, I have no idea what degree those waves are. I’ve marked the larger degree with a place-holder {n} as the degree number, and the subwave of that degree as {n-1}. An expedient, but it works.

Wave D{-5} as a counter-trend move ought to have three subwaves. It is certainly possible for those waves to take a Zigzag pattern, which would mean five subwaves for the first of the three waves, suggesting that the {n} degree could be degree {-6} and {n-1}, {-7}.

If this analysis proves correct, then wave D{-5} with its three subwaves will be followed by rising wave E{-5}, with five subwaves, which will be the final subwave of wave E{-4} whose completion will also be the end of wave C{-3} in the second corrective pattern within rising correction wave 2{-2}.

The chart in Thursday’s post gives context to the waves that led up to the July 19 peak and the small price movements that have followed it.

I’ve left this morning’s chart without an update, since the price movements are too small to show meaningfully on a chart of that scale.

[S&P 500 E-mini futures at 3:30 p.m., 10-minute bars, with volume]

9:35 a.m. New York time

What’s happening now? The S&P 500 E-mini futures traded in the 4560s and 4570s overnight, rising sharply into the 4590s as the opening bell approached.

What does it mean? The upward correction that began on October 13 continues. It has taken a compound form and is in its second corrective pattern. When that pattern is complete, it may be the end of the correction, or it may be followed by a third corrective pattern that will end the correction.

In any case, when upward correction is complete, it will be followed by a powerful downtrend. Trends in Elliott wave theory are composed of five waves: 1st, 3rd and 5th in the direction of the trend, and 2nd and 4th as countertrend corrections.

In the near-term view of the market, little has changed over the past few sessions, and I’d like end the week by pulling out for the long view. All of the ups and downs of the upward correction, a 2nd wave, have been part of a 4th wave downtrend, the next to the last wave within a massive expanding Diagonal Triangle, a 5th wave that began in December 2018.

For the nearer-term analysis, I refer the reader to yesterday’s Trader’s Notebook and to editions posted earlier in the week. There’s a rather mind-numbing sameness to them all as the present corrective pattern keeps reaching new heights, each of which could be the end the pattern, but so none has been.

In the discussion below I refer to waves by number, with their degree — their place in the fractal structure — indicated by a subscript in curly brackets. See the “Reading the Chart” section further down in this posting.

The expanding part of “expanding Diagonal Triangle” means that each reversal point is beyond the one that came before. The price channel I’ve marked on the chart, in blue, shows how the pattern got its name.

The Triangle is wave 5{0}, which began on December 26, 2018. It is the final wave of a rising wave 5{+1}. which which began on March 6, 2009. That wave, in turn is nested in two still larger rising trends, wave 5{+2}, which began on December 9, 1974, and wave 5{+3}, which began on July 8, 1932.

That all means that there are multiple end games underway. The present upward correction, wave 2{-2}, is a subwave of wave 4{-1}, which began on January 4, 2022. The future downtrend, wave 3{-2}, will be followed by another upward correction, wave 4{-2}, and then a final downward push, wave 5{-2}, which may well turn out to be more powerful than the 3rd wave that preceded it.

The end of wave 5{-2} will also be the end of the next-to-the-last wave of the Triangle, wave 4{-1}. And that’s when things get interesting. Wave 5{-1} will follow, a powerful rise that will carry the price up into the neighborhood of the upper price channel, which is presently in the 6400s and rising higher every day. It will be a bull market for the history books.

As all experienced traders know, just as the dark of night follows a bright and sunny day, so any bull market is followed by a bear market. And what a bear market it will be!

The end of wave 5{-1} will also be the end of wave 5{0} — the expanding Diagonal Triangle — and also of the larger enclosing waves, all the way up to wave 5{+3}, the uptrend that began in 1932, from the low of the Great Depression.

The downward movement that follows will eclipse any downtrend in the memories of people now living. I expect that it will feel like the end of the world as we know it.

What are the alternatives? Some analysts see the structure that began in December 2018 as a regular five-wave trend rather than as an expanding Diagonal Triangle. The scale of the wave 4{-1} decline and wave 5{-1} rise may vary depending upon which analysis proves correct. The wave numberings and relative scales that lie ahead are the same for both analyses.

[S&P 500 index at 9:35 a.m., 3-day bars]

What does Elliott wave theory say? Here are the waves that underly the nearer-term analysis. For longer-term waves, see the “We Are Here” section below.

Principal analysis:

  • An upward correction, a Zigzag, wave 2{-2}, began on October 13, 2022 and is underway.
  • The upward correction, wave 2{-2}, is taking a compound form, which can contain up to three corrective patterns.
  • The correction is in its second corrective pattern, which is in wave C{-3}, its final wave.
  • The end of the present wave C{-3} could also be the end of the wave 2{-2} correction if the compound structure contains two subwaves.
  • Or the present corrective pattern could be followed by a declining connector, wave X{-3}, and then a third corrective pattern.
  • Wave C{-3} will have five subwaves and is at wave E{-4}, the final subwave.
  • Wave E{-4} is in its third of five subwaves, wave C{-5}.
  • Wave 2{-2}, when complete, will be followed by a powerful downtrend, wave 3{-2}.
  • Under the rules of Elliott wave analysis, wave 2{-2} cannot move beyond the beginning of wave 1{-2}, which was the January 4, 2022 peak at 4953.25

Alternative analysis:

  • Wave E{-4} is in its fourth of five subwaves, wave D{-5}, a declining wave that will be followed by an upward push to completion

We Are Here.

These are the waves currently in progress under my principal analysis. Each line on the list shows the wave number, with the subscript in curly brackets, the traditional degree name, the starting date, the starting price of the S&P 500 E-mini futures, and the direction of the wave.

  • S&P 500 Index:
  • 5{+3} Supercycle, 7/8/1932, 4.40 (up)
  • 5{+2} Cycle, 12/9/1974, 60.96 (up)
  • 5{+1} Primary, 3/6/2009, 666.79 (up)
  • 5{0} Intermediate, 12/26/2018, 2346.58 (up)
  • S&P 500 Futures and index:
  • 4{-1} Minor, 1/4/2022, 4953.25 (down) (futures), 4818.62 (down) (index)
  • S&P 500 Futures:
  • 2{-2} Minute, 10/13/2022, 3577.75 (up)

Reading the chart. Price movements — waves – – in Elliott wave analysis are labeled with numbers within trending waves and letters with corrective waves. The subscripts — numbers in curly brackets — designate the wave’s degree, which, in Elliott wave analysis, means the relative position of a wave within the larger and smaller structures that make up the chart. R.N. Elliott, who in the 1930s developed the form of analysis that bears his name, viewed the chart as a complex structure of smaller waves nested within larger waves, which in turn are nested within still larger waves. In mathematics it’s called a fractal structure, where at every scale the pattern is similar to the others.

Learning and other resources. Elliott wave analysis provides context, not prophecy. As the 20th century semanticist Alfred Korzybski put it in his book Science and Sanity (1933), “The map is not the territory … The only usefulness of a map depends on similarity of structure between the empirical world and the map.” And I would add, in the ever-changing markets, we can judge that similarity of structure only after the fact.

See the menu page Analytical Methods for a rundown on where to go for information on Elliott wave analysis.

By Tim Bovee, Portland, Oregon, July 21, 2023

Disclaimer

Tim Bovee, Private Trader tracks the analysis and trades of a private trader for his own accounts. Nothing in this blog constitutes a recommendation to buy or sell stocks, options or any other financial instrument. The only purpose of this blog is to provide education and entertainment.

No trader is ever 100 percent successful in his or her trades. Trading in the stock and option markets is risky and uncertain. Each trader must make trading decisions for his or her own account, and take responsibility for the consequences.

License
Creative Commons License

All content on Tim Bovee, Private Trader by Timothy K. Bovee is licensed under a Creative Commons Attribution-ShareAlike 4.0 International License.

Based on a work at www.timbovee.com.

Trader’s Notebook

3:30 p.m. New York time

Half an hour before the closing bell. The S&P 500 futures fell during the session from the 4590s into the 4550s. This morning’s analysis remains unchanged. I’ve updated the chart.

9:35 a.m. New York time

What’s happening now? The S&P 500 E-mini futures meandered sideways overnight, remaining in the 4590s and 4580s until shortly before the opening bell, when the price dropped into the 4570s.

What does it mean? The pause is either a small subwave within the last leg of the corrective pattern that began on March 12, …

What are the alternatives? … or the tentative start of a wave connecting that corrective pattern, which ended at yesterday’s high, with another corrective pattern, …

… or the first steps of a powerful downtrend following the completion yesterday of the upward compound correction that began on October 13, 2022.

Which analysis reflects the path of the price will become clear eventually. At this point, it’s ambiguous.

Within the principal analysis, there’s room to question whether the last leg of the corrective pattern is in its middle or next-to-the-last subwave. I’ve chose the middle wave for the chart, wave C{-5}, although without a great deal of confidence.

Reading the chart. The chart shows the second corrective pattern in its entirety, overlaid by the Fibonacci ladder, in red, for the retracement of wave C{-3}, the last leg of the upward correction.

Price movements — waves – – in Elliott wave analysis are labeled with numbers within trending waves and letters with corrective waves. The subscripts — numbers in curly brackets — designate the wave’s degree, which, in Elliott wave analysis, means the relative position of a wave within the larger and smaller structures that make up the chart. R.N. Elliott, who in the 1930s developed the form of analysis that bears his name, viewed the chart as a complex structure of smaller waves nested within larger waves, which in turn are nested within still larger waves. In mathematics it’s called a fractal structure, where at every scale the pattern is similar to the others.

[S&P 500 E-mini futures at 3:30 p.m., 260-minute bars, with volume]

What does Elliott wave theory say? Here are the waves that underly the analysis.

Principal analysis:

  • An upward correction, a Zigzag, wave 2{-2}, began on October 13, 2022 and is underway.
  • The upward correction, wave 2{-2}, is taking a compound form, which can contain up to three corrective patterns.
  • The correction is in its second corrective pattern, which is in wave C{-3}, its final wave.
  • The end of the present wave C{-3} could also be the end of the wave 2{-2} correction if the compound structure contains two subwaves.
  • Or the present corrective pattern could be followed by a declining connector, wave X{-3}, and then a third corrective pattern.
  • Wave C{-3} will have five subwaves and is at wave E{-4}, the final subwave.
  • Wave E{-4} is in its third of five subwaves, wave C{-5}.
  • Wave 2{-2}, when complete, will be followed by a powerful downtrend, wave 3{-2}.
  • Under the rules of Elliott wave analysis, wave 2{-2} cannot move beyond the beginning of wave 1{-2}, which was the January 4, 2022 peak at 4953.25

Alternative analysis:

  • Wave E{-4} is in its fourth of five subwaves, wave D{-5}, a declining wave that will be followed by an upward push to completion

We Are Here.

These are the waves currently in progress under my principal analysis. Each line on the list shows the wave number, with the subscript in curly brackets, the traditional degree name, the starting date, the starting price of the S&P 500 E-mini futures, and the direction of the wave.

  • S&P 500 Index:
  • 5{+3} Supercycle, 7/8/1932, 4.40 (up)
  • 5{+2} Cycle, 12/9/1974, 60.96 (up)
  • 5{+1} Primary, 3/6/2009, 666.79 (up)
  • 5{0} Intermediate, 12/26/2018, 2346.58 (up)
  • S&P 500 Futures and index:
  • 4{-1} Minor, 1/4/2022, 4953.25 (down) (futures), 4818.62 (down) (index)
  • S&P 500 Futures:
  • 2{-2} Minute, 10/13/2022, 3577.75 (up)

Learning and other resources. Elliott wave analysis provides context, not prophecy. As the 20th century semanticist Alfred Korzybski put it in his book Science and Sanity (1933), “The map is not the territory … The only usefulness of a map depends on similarity of structure between the empirical world and the map.” And I would add, in the ever-changing markets, we can judge that similarity of structure only after the fact.

See the menu page Analytical Methods for a rundown on where to go for information on Elliott wave analysis.

By Tim Bovee, Portland, Oregon, July 20, 2023

Disclaimer

Tim Bovee, Private Trader tracks the analysis and trades of a private trader for his own accounts. Nothing in this blog constitutes a recommendation to buy or sell stocks, options or any other financial instrument. The only purpose of this blog is to provide education and entertainment.

No trader is ever 100 percent successful in his or her trades. Trading in the stock and option markets is risky and uncertain. Each trader must make trading decisions for his or her own account, and take responsibility for the consequences.

License
Creative Commons License

All content on Tim Bovee, Private Trader by Timothy K. Bovee is licensed under a Creative Commons Attribution-ShareAlike 4.0 International License.

Based on a work at www.timbovee.com.
Trader’s Notebook

3:30 p.m. New York time

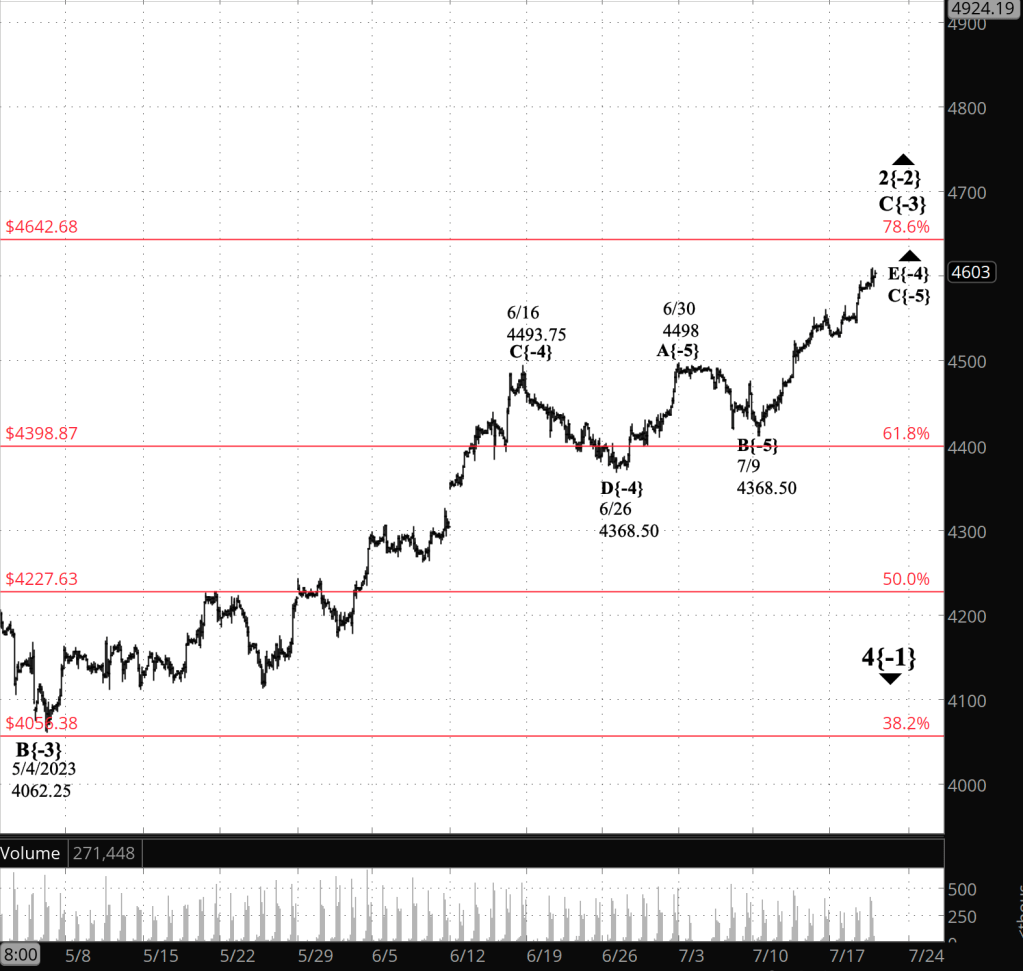
Half an hour before the closing bell. The S&P 500 futures have hit a session high, so far, of 4609.25, which is also a high for the upward correction that began on October 13, 2022. No change in the analysis. I’ve updated the chart.

9:35 a.m. New York time

What’s happening now? The S&P 500 E-mini futures tracked sideways overnight, remaining within the 4580s and 4590s.

What does it mean? The trip to nowhere was a low-degree pause in the rise that began on July 9, part of the final portion of the second corrective pattern within a long-running upward compound correction that has defined the market for nine months.

As the opening bell approached, the price broke past yesterday’s peak, 4594.50 and in the first few minutes of the session reached higher, to 4603. Any higher high continues the last leg of the corrective pattern. Alternatively, any high is potentially the end of the corrective pattern.

Could a high also be the end of the correction itself? Maybe. A compound correction can have up to three corrective patterns, so it’s possible that the present second pattern will be followed by a shallow decline that will connect that pattern to the future third pattern. And it’s also possible that the second pattern will the end of the correction, setting off a powerful decline that will care the price below 3502, where the correction began, and typically far below that level.

What are the alternatives? All of the above. There is no way to know at this point how many corrective patterns the compound correction will produce. And there’s no way to pinpoint the final high with any degree of certainty. As the stand-up comedian Emo Phillips once defined it, “Ambiguity — the Devil’s volleyball.” Analyzing this market, it certainly seems that way.

[S&P 500 E-mini futures at 3:30 p.m., 2-hour bars, with volume]

What does Elliott wave theory say? Here are the waves that underly the analysis.

Principal analysis:

  • An upward correction, a Zigzag, wave 2{-2}, began on October 13, 2022 and is underway.
  • The upward correction, wave 2{-2}, is taking a compound form, which can contain up to three corrective patterns.
  • The correction is in its second corrective pattern, which is in wave C{-3}, its final wave.
  • The end of the present wave C{-3} could also be the end of the wave 2{-2} correction if the compound structure contains two subwaves.
  • Or the present corrective pattern could be followed by a declining connector, wave X{-3}, and then a third corrective pattern.
  • Wave C{-3} will have five subwaves and is at wave E{-4}, the final subwave.
  • Wave E{-4} is in its third of five subwaves, wave C{-5}.
  • Wave 2{-2}, when complete, will be followed by a powerful downtrend, wave 3{-2}.
  • Under the rules of Elliott wave analysis, wave 2{-2} cannot move beyond the beginning of wave 1{-2}, which was the January 4, 2022 peak at 4953.25

Alternative analysis:

  • Wave E{-4} is in its fourth of five subwaves, wave D{-5}, a declining wave that will be followed by an upward push to completion

Reading the chart. The chart contains, in red, the Fibonacci ladder for the retracement of wave C{-3}, the last leg of the upward correction.

Price movements — waves – – in Elliott wave analysis are labeled with numbers within trending waves and letters with corrective waves. The subscripts — numbers in curly brackets — designate the wave’s degree, which, in Elliott wave analysis, means the relative position of a wave within the larger and smaller structures that make up the chart. R.N. Elliott, who in the 1930s developed the form of analysis that bears his name, viewed the chart as a complex structure of smaller waves nested within larger waves, which in turn are nested within still larger waves. In mathematics it’s called a fractal structure, where at every scale the pattern is similar to the others.

We Are Here. These are the waves currently in progress under my principal analysis. Each line on the list shows the wave number, with the subscript in curly brackets, the traditional degree name, the starting date, the starting price of the S&P 500 E-mini futures, and the direction of the wave.

  • S&P 500 Index:
  • 5{+3} Supercycle, 7/8/1932, 4.40 (up)
  • 5{+2} Cycle, 12/9/1974, 60.96 (up)
  • 5{+1} Primary, 3/6/2009, 666.79 (up)
  • 5{0} Intermediate, 12/26/2018, 2346.58 (up)
  • S&P 500 Futures and index:
  • 4{-1} Minor, 1/4/2022, 4953.25 (down) (futures), 4818.62 (down) (index)
  • S&P 500 Futures:
  • 2{-2} Minute, 10/13/2022, 3577.75 (up)

Learning and other resources. Elliott wave analysis provides context, not prophecy. As the 20th century semanticist Alfred Korzybski put it in his book Science and Sanity (1933), “The map is not the territory … The only usefulness of a map depends on similarity of structure between the empirical world and the map.” And I would add, in the ever-changing markets, we can judge that similarity of structure only after the fact.

See the menu page Analytical Methods for a rundown on where to go for information on Elliott wave analysis.

By Tim Bovee, Portland, Oregon, July 19, 2023

Disclaimer

Tim Bovee, Private Trader tracks the analysis and trades of a private trader for his own accounts. Nothing in this blog constitutes a recommendation to buy or sell stocks, options or any other financial instrument. The only purpose of this blog is to provide education and entertainment.

No trader is ever 100 percent successful in his or her trades. Trading in the stock and option markets is risky and uncertain. Each trader must make trading decisions for his or her own account, and take responsibility for the consequences.

License
Creative Commons License

All content on Tim Bovee, Private Trader by Timothy K. Bovee is licensed under a Creative Commons Attribution-ShareAlike 4.0 International License.

Based on a work at www.timbovee.com.
Trader’s Notebook

3:30 p.m. New York time

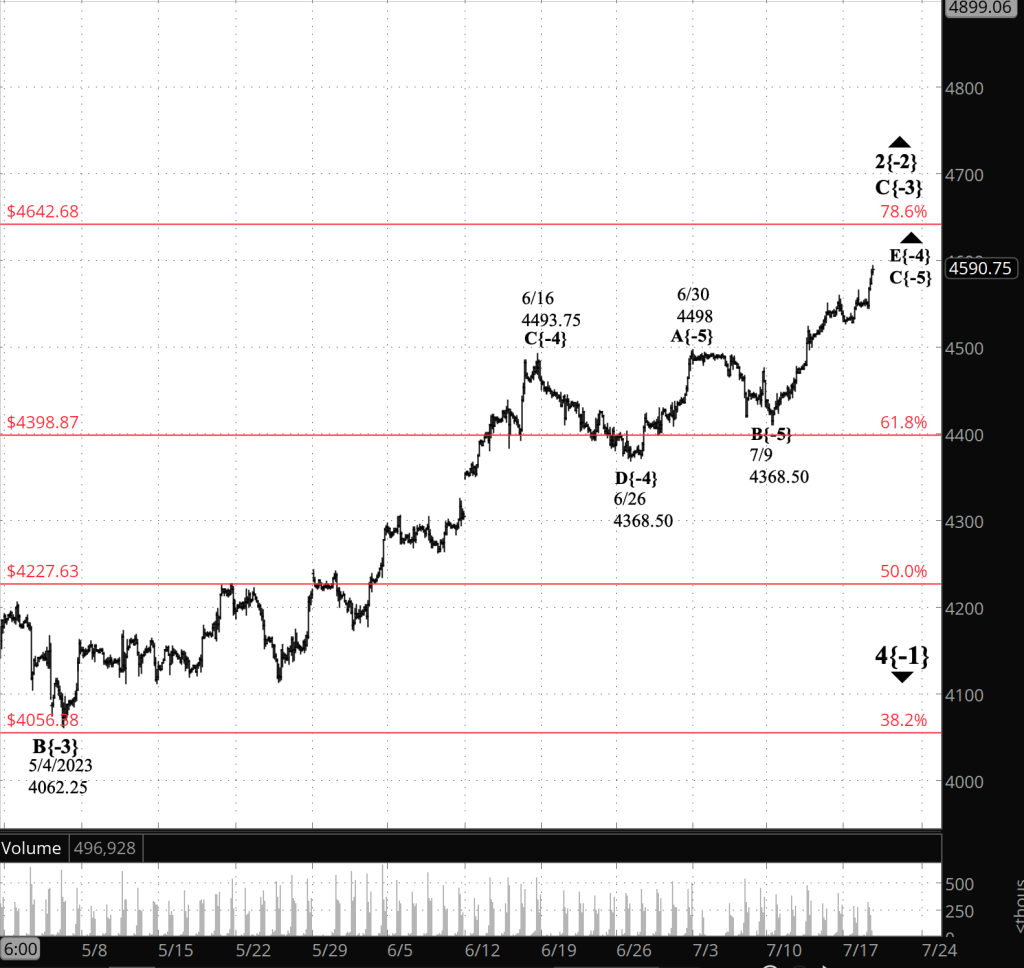
Half an hour before the closing bell. The S&P 500 futures rose during the session, reaching into the 4590s. No change from this morning’s analysis. The second corrective pattern within a rising upward correction that began last October continues. I’ve updated the chart.

9:35 a.m. New York time

What’s happening now? The S&P 500 E-mini futures fell back into the 4530s overnight and then rose again into the 4550s as the opening bell approached.

What does it mean? At this point any peak and withdrawal could either be a stopping point on the middle wave of the rise that began on June 26, the final stage of the corrective pattern that began March 12. It is the second corrective pattern within a rising compound correction that began on October 13, 2022.

What is the alternative? Or the high could be the end of the middle wave of the June 26 rise and the beginning of a declining next-to-the-last wave that will be followed by the final wave of the corrective pattern.

Under both scenarios. A compound correction can contain two or three corrective patterns.

If this correction ends with two patterns, then the next step will be an energetic downtrend that will carry the price down to the correction’s starting point, 3502, and below, perhaps significantly lower.

If the correction turns out to contain three patterns, then the next step will be a shallow decline connecting the pattern just ended with the future pattern.

[S&P 500 E-mini futures at 3:30 p.m., 2-hour bars, with volume]

What does Elliott wave theory say? Here are the waves that underly the analysis.

Principal analysis:

  • An upward correction, a Zigzag, wave 2{-2}, began on October 13, 2022 and is underway.
  • The upward correction, wave 2{-2}, is taking a compound form, which can contain up to three corrective patterns.
  • The correction is in its second corrective pattern, which is in wave C{-3}, its final wave.
  • The end of the present wave C{-3} could also be the end of the wave 2{-2} correction if the compound structure contains two subwaves.
  • Or the present corrective pattern could be followed by a declining connector, wave X{-3}, and then a third corrective pattern.
  • Wave C{-3} will have five subwaves and is at wave E{-4}, the final subwave.
  • Wave E{-4} is in its third of five subwaves, wave C{-5}.
  • Wave 2{-2}, when complete, will be followed by a powerful downtrend, wave 3{-2}.
  • Under the rules of Elliott wave analysis, wave 2{-2} cannot move beyond the beginning of wave 1{-2}, which was the January 4, 2022 peak at 4953.25

Alternative analysis:

  • Wave E{-4} is in its fourth of five subwaves, wave D{-5}, a declining wave that will be followed by an upward push to completion

Reading the chart. The chart contains, in red, the Fibonacci ladder for the retradement of wave C{-3}, the last leg of the upward correction.

Price movements — waves – – in Elliott wave analysis are labeled with numbers within trending waves and letters with corrective waves. The subscripts — numbers in curly brackets — designate the wave’s degree, which, in Elliott wave analysis, means the relative position of a wave within the larger and smaller structures that make up the chart. R.N. Elliott, who in the 1930s developed the form of analysis that bears his name, viewed the chart as a complex structure of smaller waves nested within larger waves, which in turn are nested within still larger waves. In mathematics it’s called a fractal structure, where at every scale the pattern is similar to the others.

We Are Here.

These are the waves currently in progress under my principal analysis. Each line on the list shows the wave number, with the subscript in curly brackets, the traditional degree name, the starting date, the starting price of the S&P 500 E-mini futures, and the direction of the wave.

  • S&P 500 Index:
  • 5{+3} Supercycle, 7/8/1932, 4.40 (up)
  • 5{+2} Cycle, 12/9/1974, 60.96 (up)
  • 5{+1} Primary, 3/6/2009, 666.79 (up)
  • 5{0} Intermediate, 12/26/2018, 2346.58 (up)
  • S&P 500 Futures and index:
  • 4{-1} Minor, 1/4/2022, 4953.25 (down) (futures), 4818.62 (down) (index)
  • S&P 500 Futures:
  • 2{-2} Minute, 10/13/2022, 3577.75 (up)

Learning and other resources. Elliott wave analysis provides context, not prophecy. As the 20th century semanticist Alfred Korzybski put it in his book Science and Sanity (1933), “The map is not the territory … The only usefulness of a map depends on similarity of structure between the empirical world and the map.” And I would add, in the ever-changing markets, we can judge that similarity of structure only after the fact.

See the menu page Analytical Methods for a rundown on where to go for information on Elliott wave analysis.

By Tim Bovee, Portland, Oregon, July 18, 2023

Disclaimer

Tim Bovee, Private Trader tracks the analysis and trades of a private trader for his own accounts. Nothing in this blog constitutes a recommendation to buy or sell stocks, options or any other financial instrument. The only purpose of this blog is to provide education and entertainment.

No trader is ever 100 percent successful in his or her trades. Trading in the stock and option markets is risky and uncertain. Each trader must make trading decisions for his or her own account, and take responsibility for the consequences.

License
Creative Commons License

All content on Tim Bovee, Private Trader by Timothy K. Bovee is licensed under a Creative Commons Attribution-ShareAlike 4.0 International License.

Based on a work at www.timbovee.com.
Trader’s Notebook

Trading rule update. Over the weekend I updated my rule set for trading long options and posted a discussion of the changes.

3:30 p.m. New York time

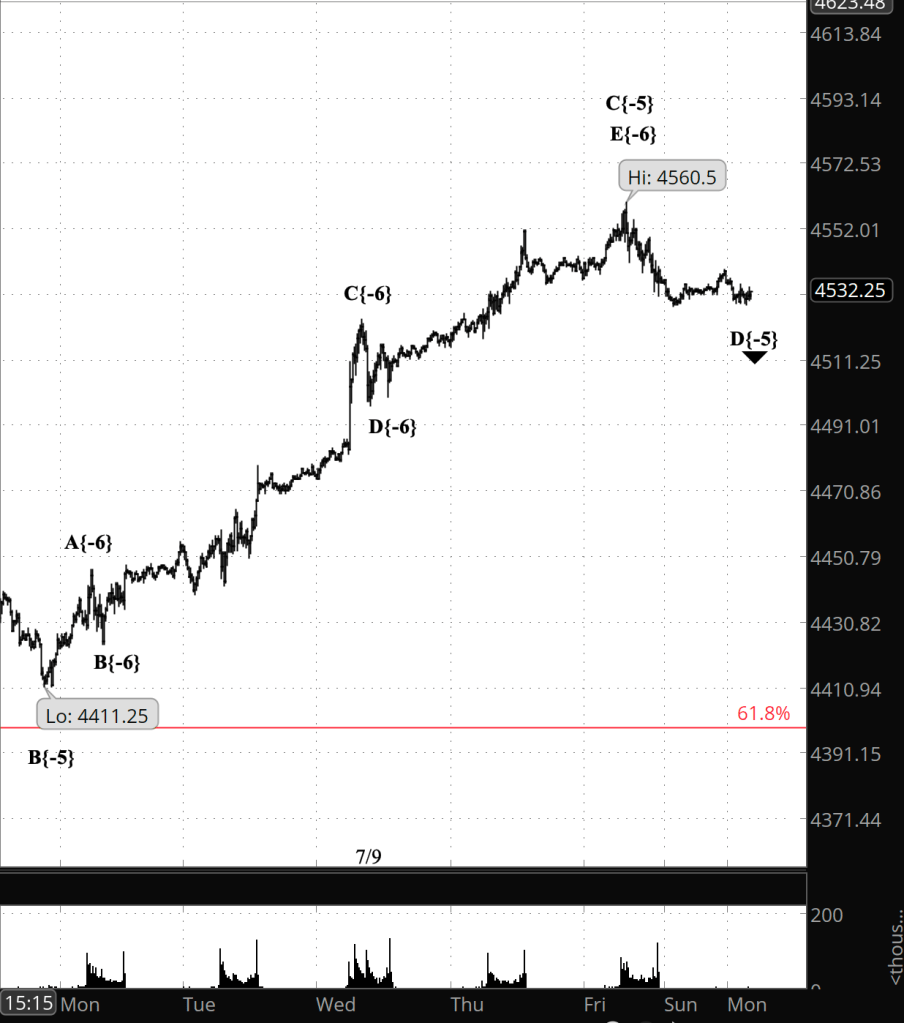
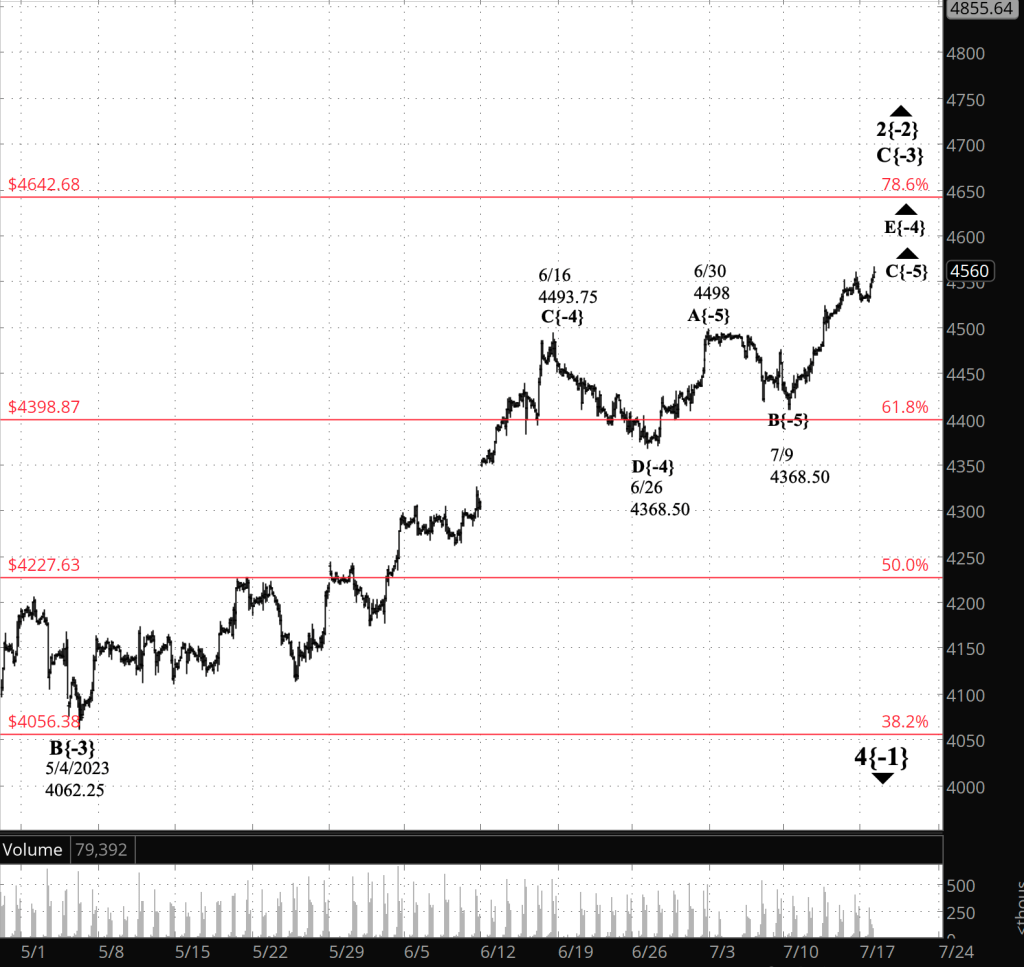
Half an hour before the closing bell. The S&P 500 futures rose above 4560.50, invalidating this morning’s principle analysis and validating the alternative: Wave E{-4}, is still in its middle wave, rising wave C{-5}.

I’ve updated the lower chart, which gives a view of the whole final wave of the present corrective pattern, wave C{-3}.

9:35 a.m. New York time

What’s happening now? The S&P 500 E-mini futures rose after trading resumed overnight, reaching 4539.25 and then falling into the 4520s.

What does it mean? The upward compound correction that began in October is nearing the end of its second corrective pattern, which will be followed either by a connecting wave and a third corrective pattern, or by a powerful downtrend following the end of the correction.

In the terminology used to mark the chart, the upward correction is wave 2{-2}. It is in its final leg, wave C{-3}, which is in its final subwave, E{-4}.

Wave E{-4} will have five subwaves and is in its fourth, wave D{-5}., which will be followed by a final push upward that will end the pattern.

Following is a close-up chart showing the subwaves of wave C{-5}

[S&P 500 E-mini futures at 8:59 a.m., 15-minute bars, with volume]

The neighborhood of the 78.6% Fibonacci retracement level — the topmost red line Fibonacci ladder — would be a typical ending point for the final subwave, E{-5}. No guarantees — Fibonacci reversals are tendencies, not certainties

Reading the chart. Price movements — waves – – in Elliott wave analysis are labeled with numbers within trending waves and letters with corrective waves. The subscripts — numbers in curly brackets — designate the wave’s degree, which, in Elliott wave analysis, means the relative position of a wave within the larger and smaller structures that make up the chart. R.N. Elliott, who in the 1930s developed the form of analysis that bears his name, viewed the chart as a complex structure of smaller waves nested within larger waves, which in turn are nested within still larger waves. In mathematics it’s called a fractal structure, where at every scale the pattern is similar to the others.

What are the alternatives? It’s possible that the decline from Friday’s peak is a subwave within an ongoing wave C{-5}. I consider it to be the less likely interpretation.

[S&P 500 E-mini futures at 3:31 p.m., 2-hour bars, with volume]

What does Elliott wave theory say? Here are the waves that underly the analysis.

Principal analysis:

  • An upward correction, a Zigzag, wave 2{-2}, began on October 13, 2022 and is underway.
  • The upward correction, wave 2{-2}, is taking a compound form, which can contain up to three corrective patterns.
  • The correction is in its second corrective pattern, which is in wave C{-3}, its final wave.
  • The end of the present wave C{-3} could also be the end of the wave 2{-2} correction if the compound structure contains two subwaves.
  • Or the present corrective pattern could be followed by a declining connector, wave X{-3}, and then a third corrective pattern.
  • Wave C{-3} will have five subwaves and is at wave E{-4}, the final subwave.
  • Wave E{-4} is in its fourth of five subwaves, wave D{-5}.
  • Wave 2{-2}, when complete, will be followed by a powerful downtrend, wave 3{-2}.
  • Under the rules of Elliott wave analysis, wave 2{-2} cannot move beyond the beginning of wave 1{-2}, which was the January 4, 2022 peak at 4953.25

Alternative analysis:

  • Wave E{-4} is in its third of five subwaves, wave C{-5}, which will be followed by a declining wave D{-5} and then an upward push to completion

We Are Here.

These are the waves currently in progress under my principal analysis. Each line on the list shows the wave number, with the subscript in curly brackets, the traditional degree name, the starting date, the starting price of the S&P 500 E-mini futures, and the direction of the wave.

  • S&P 500 Index:
  • 5{+3} Supercycle, 7/8/1932, 4.40 (up)
  • 5{+2} Cycle, 12/9/1974, 60.96 (up)
  • 5{+1} Primary, 3/6/2009, 666.79 (up)
  • 5{0} Intermediate, 12/26/2018, 2346.58 (up)
  • S&P 500 Futures and index:
  • 4{-1} Minor, 1/4/2022, 4953.25 (down) (futures), 4818.62 (down) (index)
  • S&P 500 Futures:
  • 2{-2} Minute, 10/13/2022, 3577.75 (up)

Learning and other resources. Elliott wave analysis provides context, not prophecy. As the 20th century semanticist Alfred Korzybski put it in his book Science and Sanity (1933), “The map is not the territory … The only usefulness of a map depends on similarity of structure between the empirical world and the map.” And I would add, in the ever-changing markets, we can judge that similarity of structure only after the fact.

See the menu page Analytical Methods for a rundown on where to go for information on Elliott wave analysis.

By Tim Bovee, Portland, Oregon, July 17, 2023

Disclaimer

Tim Bovee, Private Trader tracks the analysis and trades of a private trader for his own accounts. Nothing in this blog constitutes a recommendation to buy or sell stocks, options or any other financial instrument. The only purpose of this blog is to provide education and entertainment.

No trader is ever 100 percent successful in his or her trades. Trading in the stock and option markets is risky and uncertain. Each trader must make trading decisions for his or her own account, and take responsibility for the consequences.

License
Creative Commons License

All content on Tim Bovee, Private Trader by Timothy K. Bovee is licensed under a Creative Commons Attribution-ShareAlike 4.0 International License.

Based on a work at www.timbovee.com.
Trading Rules: Long Options

As long-time readers know, I’m a rule-based trader. I don’t put money at risk unless I have rules for constructing, rules for when to enter a position, and rules for when to exit. Back when I was new to trading, I kept losing money. I finally figured out that it was because I trading emotionally, based on hopes and fears.

Hope and fear, I concluded, are obstacles to be overcome if I hope to be a successful trader. My rule-based system is the best tool I’ve found to erase emotion from my trading decisions.

My present rule sets are in the Trading Rules pulldown on the menu bar at the top of each post. Today, for the first time in a few years, i’ve made a change, updating my rules for trading long options.

An options trader must make a fundamental choice before considering a trade: Long or short. Buy the options and sell them upon exit, or sell them and buy them back upon exit.

Each type has its pluses and minuses.

Short options: On the plus side, short options avoid time decay, wherein a position loses value with the passage of time. However, they require a high implied volatility rate, which can make it hard to find good trades. On the downside, short options, like any short trade, require that the trade have sufficient funds in the account — margin — to buy back the position in case it is unprofitable. And they tend to have a greater risk than the reward, a major downside for me. These positions are managed 20 days after entry.

Long options. On the plus side, there’s no margin requirement and no volatility rate restrictions. On the downside, time decay is a problem. In my revised rules, I’ve managed that by buy options that are far out of the money and that a far from expiration. And best of all, the reward is greater than the risk. These positions are managed 10 days after entry, and I may change that.

As always, I’ve found, trading goes best when I use a variety of strategies. I anticipate bringing this revised strategy into the mix as the market’s long-running upward correction ends and a downtrend begins.

Here are the revised rules:

Long Options

  • Upon receipt of a buy signal, a long call or long put position should be entered no fewer than 70 days prior to the position’s last day of trading.
    • The closer to the last day of trading an option is, the cheaper the option’s price will be.
  • The option traded should be out of the money with a strike price as close possible to 70% of the current market price.
  • The option must be sold upon receipt of an exit signal or upon reaching the goal set upon entry into the position.
  • A position must be managed no fewer than 40 days prior to the contract’s last day of trading.
    • Management consists of exiting the trade, whether it produces a profit or a loss.
    • If the stock is expected to continue to moving in a profitable direction for the option, then the position can be reestablished with a later expiration date.

By Tim Bovee, Portland, Oregon, July 16, 2023

Disclaimer

Tim Bovee, Private Trader tracks the analysis and trades of a private trader for his own accounts. Nothing in this blog constitutes a recommendation to buy or sell stocks, options or any other financial instrument. The only purpose of this blog is to provide education and entertainment.

No trader is ever 100 percent successful in his or her trades. Trading in the stock and option markets is risky and uncertain. Each trader must make trading decisions for his or her own account, and take responsibility for the consequences.

License
Creative Commons License

All content on Tim Bovee, Private Trader by Timothy K. Bovee is licensed under a Creative Commons Attribution-ShareAlike 4.0 International License.

Based on a work at www.timbovee.com.
Trader’s Notebook

3:30 p.m. New York time

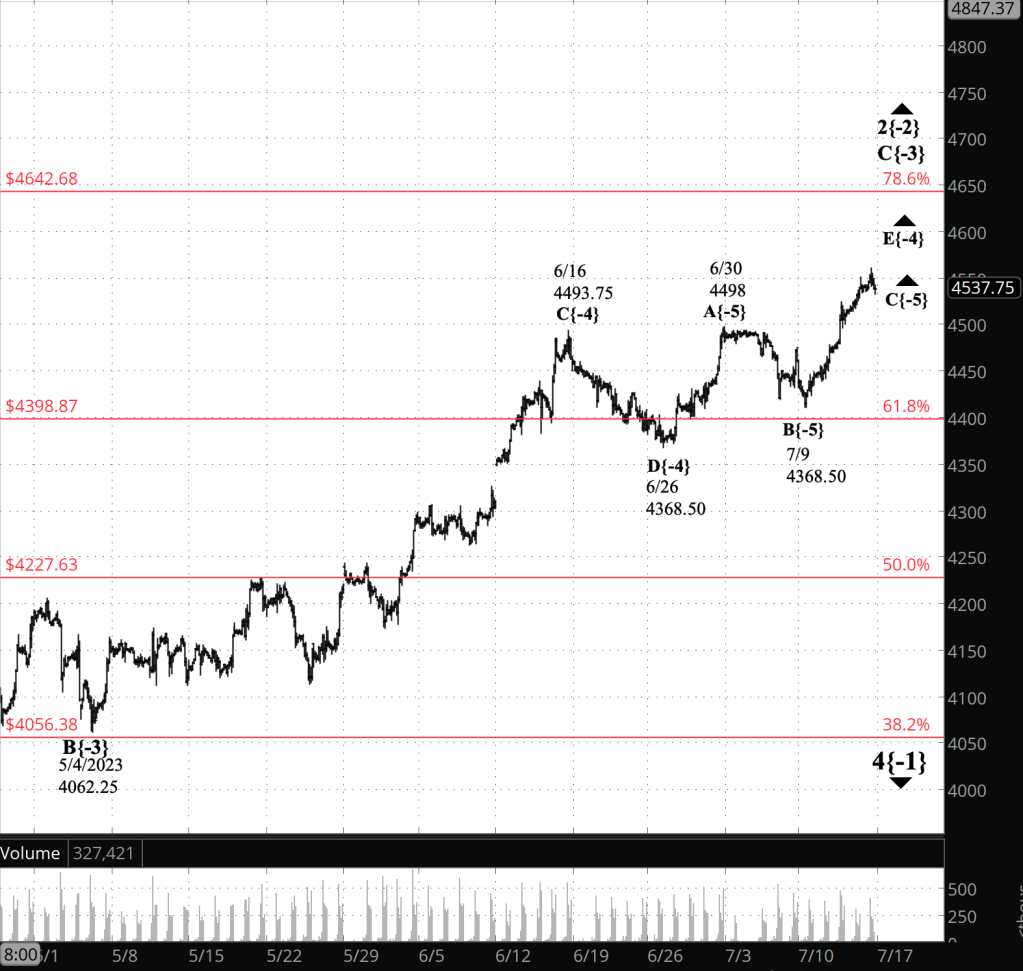
Half an hour before the closing bell. The S&P 500 futures fell into the 4530s during the session. No change in this morning’s analysis. Chart updated.

9:35 a.m. New York time

What’s happening now? The S&P 500 E-mini futures rose overnight, so far reaching the 4550s.

What does it mean? The second corrective pattern within a rising compound correction that began last October continues and is in its final phases. It will be followed either by a third and final corrective pattern as the correction continues or by a powerful downtrend that will carry the price below the correction’s starting price, 3502, and most likely significantly below that level.

What are the alternatives? None at the present. I’m quite certain that ambiguities will develop over the days and weeks to come.

[S&P 500 E-mini futures at 3:30 p.m., 2-hour bars, with volume]

What does Elliott wave theory say? Here are the waves that underly the analysis.

  • An upward correction, a Zigzag, wave 2{-2}, began on October 13, 2022 and is underway.
  • The upward correction, wave 2{-2}, is taking a compound form, which can contain up to three corrective patterns.
  • The correction is in its second corrective pattern, which is in wave C{-3}, its final wave.
  • The end of the present wave C{-3} could also be the end of the wave 2{-2} correction if the compound structure contains two subwaves.
  • Or the present corrective pattern could be followed by a declining connector, wave X{-3}, and then a third corrective pattern.
  • Wave C{-3} will have five subwaves and is at wave E{-4}, the final subwave.
  • Wave E{-4} is in its third of five subwaves, wave C{-5}.
  • Wave 2{-2}, when complete, will be followed by a powerful downtrend, wave 3{-2}.
  • Under the rules of Elliott wave analysis, wave 2{-2} cannot move beyond the beginning of wave 1{-2}, which was the January 4, 2022 peak at 4953.25

We Are Here.

These are the waves currently in progress under my principal analysis. Each line on the list shows the wave number, with the subscript in curly brackets, the traditional degree name, the starting date, the starting price of the S&P 500 E-mini futures, and the direction of the wave.

  • S&P 500 Index:
  • 5{+3} Supercycle, 7/8/1932, 4.40 (up)
  • 5{+2} Cycle, 12/9/1974, 60.96 (up)
  • 5{+1} Primary, 3/6/2009, 666.79 (up)
  • 5{0} Intermediate, 12/26/2018, 2346.58 (up)
  • S&P 500 Futures and index:
  • 4{-1} Minor, 1/4/2022, 4953.25 (down) (futures), 4818.62 (down) (index)
  • S&P 500 Futures:
  • 2{-2} Minute, 10/13/2022, 3577.75 (up)

Reading the chart. Price movements — waves – – in Elliott wave analysis are labeled with numbers within trending waves and letters with corrective waves. The subscripts — numbers in curly brackets — designate the wave’s degree, which, in Elliott wave analysis, means the relative position of a wave within the larger and smaller structures that make up the chart. R.N. Elliott, who in the 1930s developed the form of analysis that bears his name, viewed the chart as a complex structure of smaller waves nested within larger waves, which in turn are nested within still larger waves. In mathematics it’s called a fractal structure, where at every scale the pattern is similar to the others.

Learning and other resources. Elliott wave analysis provides context, not prophecy. As the 20th century semanticist Alfred Korzybski put it in his book Science and Sanity (1933), “The map is not the territory … The only usefulness of a map depends on similarity of structure between the empirical world and the map.” And I would add, in the ever-changing markets, we can judge that similarity of structure only after the fact.

See the menu page Analytical Methods for a rundown on where to go for information on Elliott wave analysis.

By Tim Bovee, Portland, Oregon, July 14, 2023

Disclaimer

Tim Bovee, Private Trader tracks the analysis and trades of a private trader for his own accounts. Nothing in this blog constitutes a recommendation to buy or sell stocks, options or any other financial instrument. The only purpose of this blog is to provide education and entertainment.

No trader is ever 100 percent successful in his or her trades. Trading in the stock and option markets is risky and uncertain. Each trader must make trading decisions for his or her own account, and take responsibility for the consequences.

License
Creative Commons License

All content on Tim Bovee, Private Trader by Timothy K. Bovee is licensed under a Creative Commons Attribution-ShareAlike 4.0 International License.

Based on a work at www.timbovee.com.
Trader’s Notebook

3:30 p.m. New York time

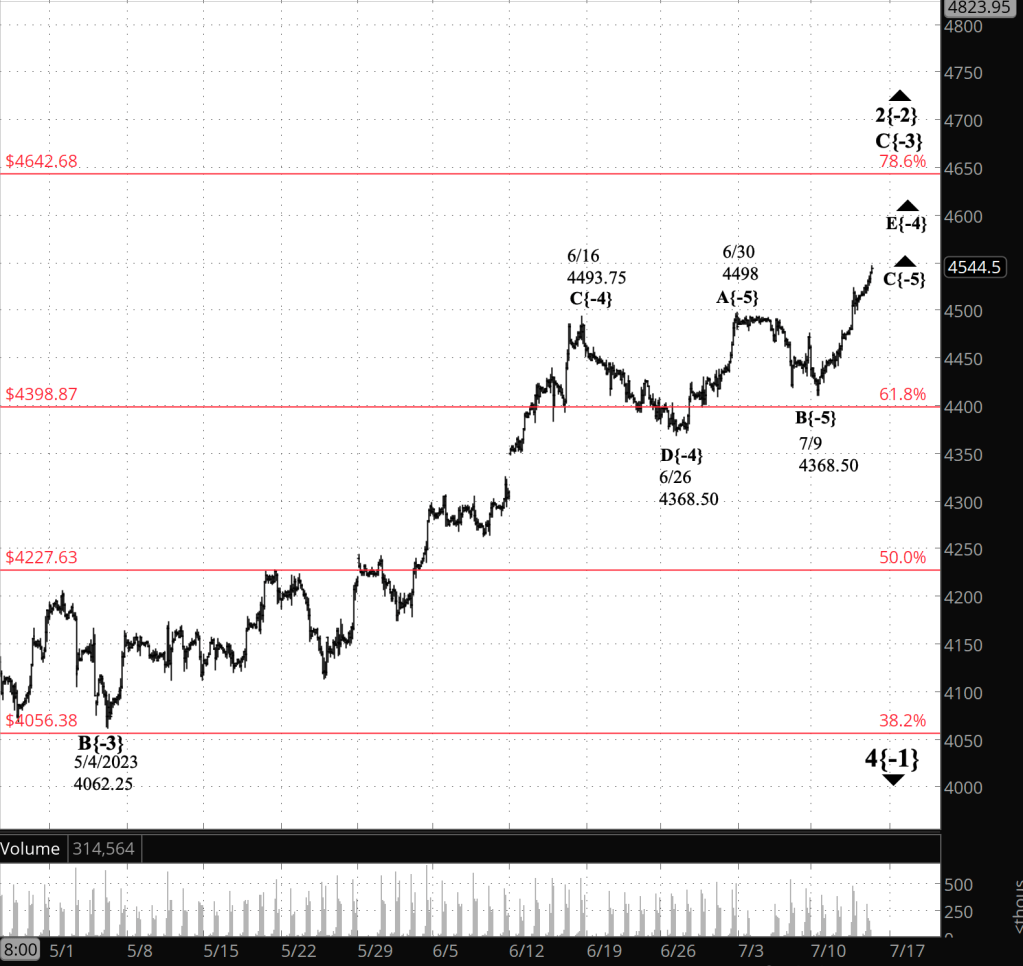
Half an hour before the closing bell. The S&P 500 futures continued to rise during the session, reaching into the 4540s. No change in the analysis. I’ve updated the chart.

9:35 a.m. New York time

What’s happening now? The S&P 500 E-mini futures rose overnight, from just below 4510 into the 4520s.

What does it mean? The wave in play all week has been the third of five subwaves within the larger final wave within the last leg of the second corrective pattern within the upward correction that began nine months ago today.

That’s a complex structure of waves within waves, so let’s pick it apart. Each wave is numbered, with its degree indicated by a subscript in curly brackets. The smaller the degree number, the further down the hierarchy of waves that specific degree is.

The upward correction, wave 2{-2}, has taken a compound form and is nearing the end of its second corrective pattern.

That second pattern is in its rising third wave, C{-3}, which will be its last.

The rising third wave will have five subwaves and is now in the last subwave, rising wave E{-4}.

And that last wave is in its third of five subwaves, rising wave C{-5}.

So it’s the {-5} degree that’s in place. Wave C{-5} will be followed by declining wave D{-5} and then a final push to the upside with wave E{-5}.

The end of wave E{-5} will also be the end of three levels of increasingly larger waves: E{-4}, C{-3} and the corrective pattern within wave 2{-2}.

It might also be the end of the correction itself, but not necessarily. A compound correction can contain two or three corrective patterns.

If this correction is limited to two patterns, then the end of wave E{-5} will also be the end of the correction, and a powerful downtrend, wave 3{-2}, will begin.

If the correction moves on to a third corrective pattern, then the correction will continue for awhile longer. How much longer? The first pattern took 112 days to reach completion — a bit less than four months. The still incomplete second pattern so far has run for 123 days — a bit more than four months. So it’s possible, although not guaranteed, that a third pattern could carry the correction into winter.

There is an upper limit on how high the upward correction can rise. It is the starting point of the preceding first wave, 1{-2}, which began on January 4, 2022 from 4953.25. A move above that level would invalidate the present analysis and require a re-analysis.

What are the alternatives? None at the present. I’m quite certain that ambiguities will develop over the days and weeks to come.

[S&P 500 E-mini futures at 3:30 p.m., 2-hour bars, with volume]

What does Elliott wave theory say? Here are the waves that underly the analysis.

  • An upward correction, a Zigzag, wave 2{-2}, began on October 13, 2022 and is underway.
  • The upward correction, wave 2{-2}, is taking a compound form, which can contain up to three corrective patterns.
  • The correction is in its second corrective pattern, which is in wave C{-3}, its final wave.
  • The end of the present wave C{-3} could also be the end of the wave 2{-2} correction if the compound structure contains two subwaves.
  • Or the present corrective pattern could be followed by a declining connector, wave X{-3}, and then a third corrective pattern.
  • Wave C{-3} will have five subwaves and is at wave E{-4}, the final subwave.
  • Wave E{-4} is in its third of five subwaves, wave C{-5}.
  • Wave 2{-2}, when complete, will be followed by a powerful downtrend, wave 3{-2}.
  • Under the rules of Elliott wave analysis, wave 2{-2} cannot move beyond the beginning of wave 1{-2}, which was the January 4, 2022 peak at 4953.25

We Are Here.

These are the waves currently in progress under my principal analysis. Each line on the list shows the wave number, with the subscript in curly brackets, the traditional degree name, the starting date, the starting price of the S&P 500 E-mini futures, and the direction of the wave.

  • S&P 500 Index:
  • 5{+3} Supercycle, 7/8/1932, 4.40 (up)
  • 5{+2} Cycle, 12/9/1974, 60.96 (up)
  • 5{+1} Primary, 3/6/2009, 666.79 (up)
  • 5{0} Intermediate, 12/26/2018, 2346.58 (up)
  • S&P 500 Futures and index:
  • 4{-1} Minor, 1/4/2022, 4953.25 (down) (futures), 4818.62 (down) (index)
  • S&P 500 Futures:
  • 2{-2} Minute, 10/13/2022, 3577.75 (up)

Reading the chart. Price movements — waves – – in Elliott wave analysis are labeled with numbers within trending waves and letters with corrective waves. The subscripts — numbers in curly brackets — designate the wave’s degree, which, in Elliott wave analysis, means the relative position of a wave within the larger and smaller structures that make up the chart. R.N. Elliott, who in the 1930s developed the form of analysis that bears his name, viewed the chart as a complex structure of smaller waves nested within larger waves, which in turn are nested within still larger waves. In mathematics it’s called a fractal structure, where at every scale the pattern is similar to the others.

Learning and other resources. Elliott wave analysis provides context, not prophecy. As the 20th century semanticist Alfred Korzybski put it in his book Science and Sanity (1933), “The map is not the territory … The only usefulness of a map depends on similarity of structure between the empirical world and the map.” And I would add, in the ever-changing markets, we can judge that similarity of structure only after the fact.

See the menu page Analytical Methods for a rundown on where to go for information on Elliott wave analysis.

By Tim Bovee, Portland, Oregon, July 13, 2023

Disclaimer

Tim Bovee, Private Trader tracks the analysis and trades of a private trader for his own accounts. Nothing in this blog constitutes a recommendation to buy or sell stocks, options or any other financial instrument. The only purpose of this blog is to provide education and entertainment.

No trader is ever 100 percent successful in his or her trades. Trading in the stock and option markets is risky and uncertain. Each trader must make trading decisions for his or her own account, and take responsibility for the consequences.

License
Creative Commons License

All content on Tim Bovee, Private Trader by Timothy K. Bovee is licensed under a Creative Commons Attribution-ShareAlike 4.0 International License.

Based on a work at www.timbovee.com.
Trader’s Notebook

3:30 p.m. New York time

Half an hour before the closing bell. The S&P 500 futures has continued to rise during the session, reaching into the 4520s. No change in the analysis. I’ve updated the chart.

9:35 a.m. New York time

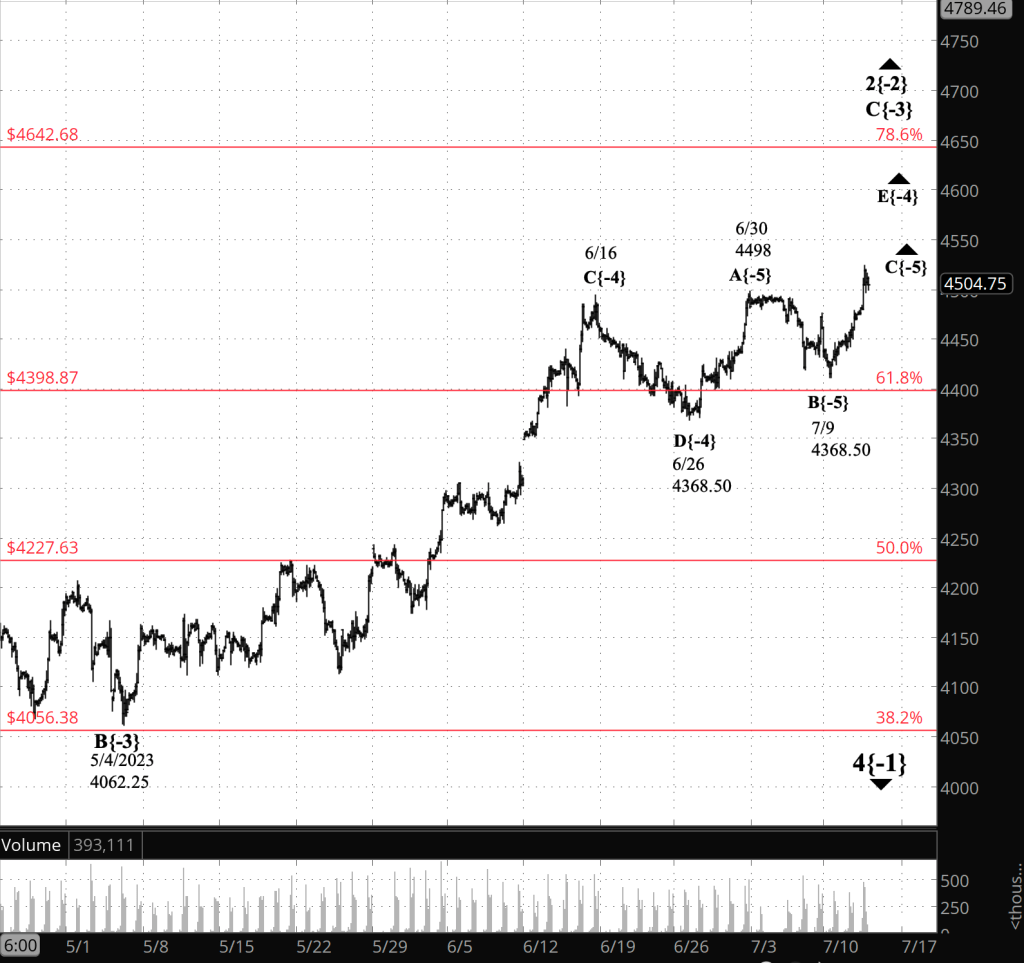
What’s happening now? The S&P 500 E-mini futures rose in a single minute from the 4480s to above 4500 after the latest inflation statistics were announced, and continued to rise, reaching a high of 4516.25 minutes into the session.

What does it mean? That high for the overnight session is also a new high for the second corrective pattern within the ongoing upward compound correction that began on October 13, 2022, and in, is a new high for the entire correction.

The correction, wave 2{-2}, is in its last leg, wave C{-3}, and one degree lower, wave E{-4}. The new high confirms that one degree lower still, the third of five subwaves, wave C{-5}, is also undersway.

Rising wave C{-5} will be followed by a falling wave, D{-5}, and then a final upward push, E{-5}. When that final upward push is complete, it will also be the end of the second corrective pattern within the compound correction.

At that point, there are two possible futures: Either the compound correction adds a third and corrective pattern, or the present second pattern is the end of the correction.

Under the three-patterns scenario, the present corrective pattern will be followed by a shallow downward connecting wave, and then another corrective pattern. Under the two-patterns scenario, the upward correction ends and a powerful downtrend, wave 3{-2} begins.

I’m not betting on either outcome. It’s simply impossible to know which will occur.

The chart shows the final leg of the second corrective pattern, wave C{-3} and its subwaves, with the Fibonacci retracement ladder overlaid, in red. The price has stayed between the 61.8% retracement and the 78.6% retracement of the preceding first wave, wave 1{-2} since late June.

What are the alternatives? There are none at the present. I’m quite certain that ambiguities will develop over the days and weeks to come.

[S&P 500 E-mini futures at 9:35 a.m., 2-hour bars, with volume]

What does Elliott wave theory say? Here are the waves that underly the analysis.

Principal Analysis:

  • An upward correction, a Zigzag, wave 2{-2}, began on October 13, 2022 and is underway.
  • The upward correction, wave 2{-2}, is taking a compound form, which can contain up to three corrective patterns.
  • The correction is in its second corrective pattern, which is in wave C{-3}, its final wave.
  • The end of the present wave C{-3} could also be the end of the wave 2{-2} correction if the compound structure contains two subwaves.
  • Or the present corrective pattern could be followed by a declining connector, wave X{-3}, and then a third corrective pattern.
  • Wave C{-3} will have five subwaves and is at wave E{-4}, the final subwave.
  • Wave E{-4} is in its third of five subwaves, wave C{-5}.
  • Wave 2{-2}, when complete, will be followed by a powerful downtrend, wave 3{-2}.
  • Under the rules of Elliott wave analysis, wave 2{-2} cannot move beyond the beginning of wave 1{-2}, which was the January 4, 2022 peak at 4953.25

We Are Here.

These are the waves currently in progress under my principal analysis. Each line on the list shows the wave number, with the subscript in curly brackets, the traditional degree name, the starting date, the starting price of the S&P 500 E-mini futures, and the direction of the wave.

  • S&P 500 Index:
  • 5{+3} Supercycle, 7/8/1932, 4.40 (up)
  • 5{+2} Cycle, 12/9/1974, 60.96 (up)
  • 5{+1} Primary, 3/6/2009, 666.79 (up)
  • 5{0} Intermediate, 12/26/2018, 2346.58 (up)
  • S&P 500 Futures and index:
  • 4{-1} Minor, 1/4/2022, 4953.25 (down) (futures), 4818.62 (down) (index)
  • S&P 500 Futures:
  • 2{-2} Minute, 10/13/2022, 3577.75 (up)

Reading the chart. Price movements — waves – – in Elliott wave analysis are labeled with numbers within trending waves and letters with corrective waves. The subscripts — numbers in curly brackets — designate the wave’s degree, which, in Elliott wave analysis, means the relative position of a wave within the larger and smaller structures that make up the chart. R.N. Elliott, who in the 1930s developed the form of analysis that bears his name, viewed the chart as a complex structure of smaller waves nested within larger waves, which in turn are nested within still larger waves. In mathematics it’s called a fractal structure, where at every scale the pattern is similar to the others.

Learning and other resources. Elliott wave analysis provides context, not prophecy. As the 20th century semanticist Alfred Korzybski put it in his book Science and Sanity (1933), “The map is not the territory … The only usefulness of a map depends on similarity of structure between the empirical world and the map.” And I would add, in the ever-changing markets, we can judge that similarity of structure only after the fact.

See the menu page Analytical Methods for a rundown on where to go for information on Elliott wave analysis.

By Tim Bovee, Portland, Oregon, July 12, 2023

Disclaimer

Tim Bovee, Private Trader tracks the analysis and trades of a private trader for his own accounts. Nothing in this blog constitutes a recommendation to buy or sell stocks, options or any other financial instrument. The only purpose of this blog is to provide education and entertainment.

No trader is ever 100 percent successful in his or her trades. Trading in the stock and option markets is risky and uncertain. Each trader must make trading decisions for his or her own account, and take responsibility for the consequences.

License
Creative Commons License

All content on Tim Bovee, Private Trader by Timothy K. Bovee is licensed under a Creative Commons Attribution-ShareAlike 4.0 International License.

Based on a work at www.timbovee.com.
Trader’s Notebook

3:30 p.m. New York time

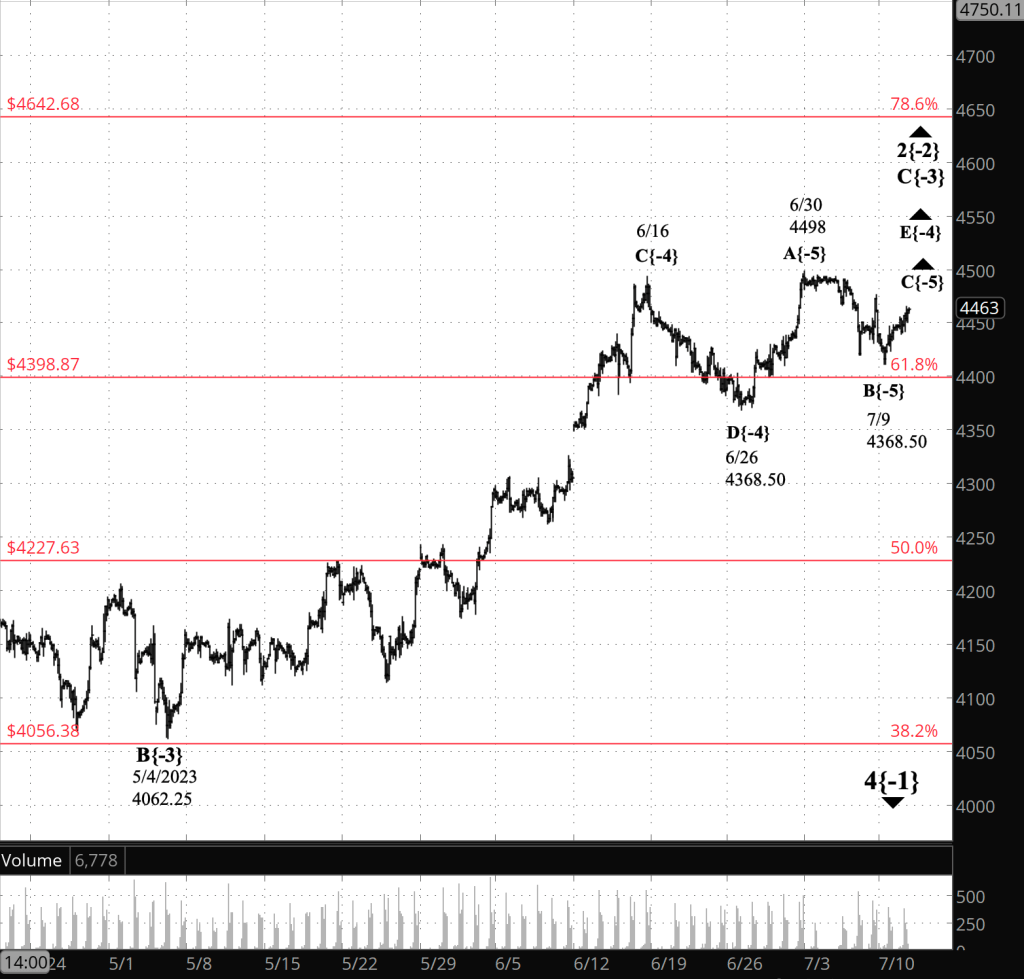
Half an hour before the closing bell. The S&P 500 traded narrowly during the session, from the 4440s to the 4460s on the futures. This morning’s analysis is unchanged. I’ve updated the chart.

9:35 a.m. New York time

What’s happening now? The S&P 500 E-mini futures traded from the 4430s to the 4450s overnight.

What does it mean? The second corrective pattern within an upward compound correction that began last October, wave 2{-2}, continues and is in its last leg, wave C{-3}. Internally, the final leg of the correction is in its last subwave, wave E{-4}, which in turn appears to be in its third of five subwaves, wave C{-5}.

What are the alternatives? Wave E{-4} may still be in its second, downward subwave, wave B{-5}. It’s hard to tell for sure. It depends entire upon whether the rise that began on July 9 is a new rising wave at the {-5} degree, as the principal analysis would have it, or a subwave of the {-6} degree within wave B{-5}, as this alternative analysis assumes.

Reading the chart. I’ve enlarged the chart to show the final subwave, C{-3}, which began on May 4, within the second corrective pattern of the compound correction, 2{-2}. This chart gives a more detailed view of how far along corrective pattern’s end game has progressed. See yesterday’s Trader’s Notebook for a broader view showing all of the second corrective pattern. I’ve overlaid the chart with the Fibonacci retracement ladder, in red, showing retracement of the prior, downtrending wave 1{-2}. The rise that began on July 9 came very close to being a bounce off of the 61.8% Fibonacci retracement level, a common reversal point.

Price movements — waves – – in Elliott wave analysis are labeled with numbers within trending waves and letters with corrective waves. The subscripts — numbers in curly brackets — designate the wave’s degree, which, in Elliott wave analysis, means the relative position of a wave within the larger and smaller structures that make up the chart. R.N. Elliott, who in the 1930s developed the form of analysis that bears his name, viewed the chart as a complex structure of smaller waves nested within larger waves, which in turn are nested within still larger waves. In mathematics it’s called a fractal structure, where at every scale the pattern is similar to the others.

[S&P 500 E-mini futures at 3:30 p.m., 2-hour bars, with volume]

What does Elliott wave theory say? Here are the waves that underly the analyses.

Principal Analysis:

  • An upward correction, a Zigzag, wave 2{-2}, began on October 13, 2022 and is underway.
  • The upward correction, wave 2{-2}, is taking a compound form, which can contain up to three corrective patterns.
  • The correction is in its second corrective pattern, which is in wave C{-3}, its final wave.
  • The end of the present wave C{-3} could also be the end of the wave 2{-2} correction if the compound structure contains two subwaves.
  • Or the present corrective pattern could be followed by a declining connector, wave X{-3}, and then a third corrective pattern.
  • Wave C{-3} will have five subwaves and is at wave E{-4}, the final subwave.
  • Wave E{-4} is in its third of five subwaves, wave C{-5}. Tentatively, See the Alternative analysis, below.
  • Wave 2{-2}, when complete, will be followed by a powerful downtrend, wave 3{-2}.
  • Under the rules of Elliott wave analysis, wave 2{-2} cannot move beyond the beginning of wave 1{-2}, which was the January 4, 2022 peak at 4953.25.

Alternative analysis:

  • Wave E{-4} continues to trace its second of five subwaves, wave B{-5}, which is in its third and final subwave, wave C{-6}.

We Are Here.

These are the waves currently in progress under my principal analysis. Each line on the list shows the wave number, with the subscript in curly brackets, the traditional degree name, the starting date, the starting price of the S&P 500 E-mini futures, and the direction of the wave.

  • S&P 500 Index:
  • 5{+3} Supercycle, 7/8/1932, 4.40 (up)
  • 5{+2} Cycle, 12/9/1974, 60.96 (up)
  • 5{+1} Primary, 3/6/2009, 666.79 (up)
  • 5{0} Intermediate, 12/26/2018, 2346.58 (up)
  • S&P 500 Futures and index:
  • 4{-1} Minor, 1/4/2022, 4953.25 (down) (futures), 4818.62 (down) (index)
  • S&P 500 Futures:
  • 2{-2} Minute, 10/13/2022, 3577.75 (up)

Learning and other resources. Elliott wave analysis provides context, not prophecy. As the 20th century semanticist Alfred Korzybski put it in his book Science and Sanity (1933), “The map is not the territory … The only usefulness of a map depends on similarity of structure between the empirical world and the map.” And I would add, in the ever-changing markets, we can judge that similarity of structure only after the fact.

See the menu page Analytical Methods for a rundown on where to go for information on Elliott wave analysis.

By Tim Bovee, Portland, Oregon, July 11, 2023

Disclaimer

Tim Bovee, Private Trader tracks the analysis and trades of a private trader for his own accounts. Nothing in this blog constitutes a recommendation to buy or sell stocks, options or any other financial instrument. The only purpose of this blog is to provide education and entertainment.

No trader is ever 100 percent successful in his or her trades. Trading in the stock and option markets is risky and uncertain. Each trader must make trading decisions for his or her own account, and take responsibility for the consequences.

License
Creative Commons License

All content on Tim Bovee, Private Trader by Timothy K. Bovee is licensed under a Creative Commons Attribution-ShareAlike 4.0 International License.

Based on a work at www.timbovee.com.