Trader’s Notebook

12:30 p.m. New York time

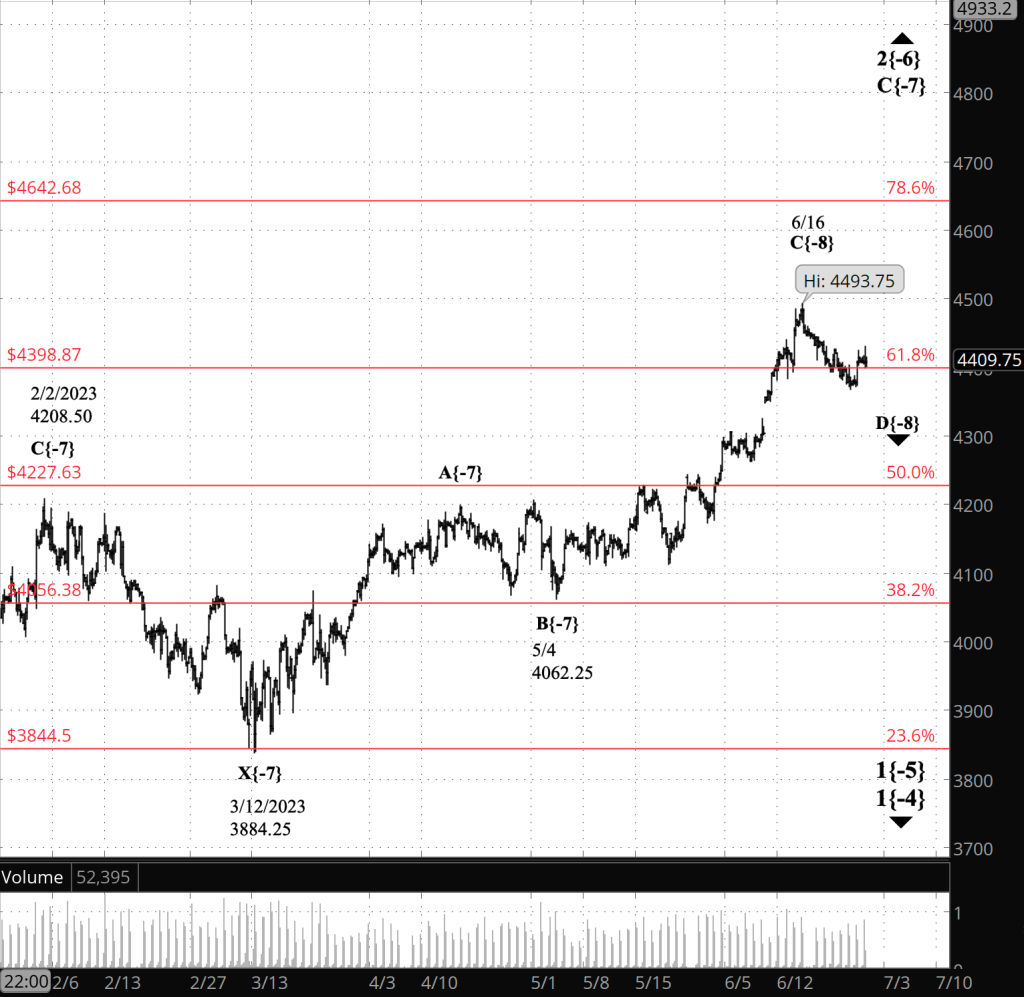
Half an hour before the closing bell. The S&P 500 futures traded in a range during the session, from the 4420s to the 4440s. This morning’s analysis remains unchanged. I’ve updated the chart.

9:40 a.m. New York time

What’s happening now? The S&P 500 E-mini futures peaked early after trading resumed overnight, at 4440, declined to 4410.25, and then rose at the opening bell, exceeding the overnight high.

What does it mean? No change in the analysis since Monday. The upward compound correction that began on October 13, 2022 is still underway and is nearing the end of the second corrective pattern. A third pattern may follow, or the second pattern may, when complete, be the end of the upward correction and the start of a powerful downtrend.

A major revision in the wave labeling. Over the weekend, as promised, I explored the question of my wave degree labeling. For some time the alternatives list has included the possibility that the degrees might be labeled as being smaller than they should be. The uncertainty of the degree applied to the upward correction and all other waves — larger and smaller — since a major downtrend began on January 4, 2022.

My conclusion, after two days work, was that the degrees were indeed lower than they should be, by four degrees. I posted a Trader’s Notebook on Sunday, July 9, titled “Trader’s Notebook: New Wave Degrees”. It describes the problem of degree setting, which is a major ambiguity endemic to Elliott wave analysis, the evidence that has led me to make the change, and what the change would look like on the chart. The post included two charts: One showing the present upward correction in its entirely, and the other showing the parent structure, an expanding Diagonal Triangle that began in December 2018.

The chart below uses the new degree levels. For a chart showing the old degrees of:

Under the new system, all degree labels since January 4 have been made larger by four degrees. The upward correction is now wave 2{-2}; before, it was wave 2{-6}. The same change has been made to all of its subwaves: The final leg of the second corrective pattern is wave C{-3}, which is in its final subwave, wave E{-4}.

A final caution: Nothing about wave degrees is set in stone, and events on the chart could at some date require a further change≥

[S&P 500 E-mini futures at 12:30 p.m., 230-minute bars, with volume]

What does Elliott wave theory say? Here are the waves that underly the analysis.

  • An upward correction, a Zigzag, wave 2{-2}, began on October 13, 2022 and is underway.
  • The upward correction, wave 2{-2}, is taking a compound form, which can contain up to three corrective patterns.
  • The correction is in its second corrective pattern, which is in wave C{-3}, its final wave.
  • The end of the present wave C{-3} could also be the end of the wave 2{-2} correction if the compound structure contains two subwaves.
  • Or the present corrective pattern could be followed by a declining connector, wave X{-3}, and then a third corrective pattern.
  • Wave C{-3} will have five subwaves and is in wave E{-4}, the final subwave.
  • Wave E{-4} will also have five subwaves.
  • Wave 2{-2}, when complete, will be followed by a powerful downtrend, wave 3{-2}.
  • Under the rules of Elliott wave analysis, wave 2{-2} cannot move beyond the beginning of wave 1{-2}, which was the January 4, 2022 peak at 4953.25.

We Are Here.

These are the waves currently in progress under my principal analysis. Each line on the list shows the wave number, with the subscript in curly brackets, the traditional degree name, the starting date, the starting price of the S&P 500 E-mini futures, and the direction of the wave.

  • S&P 500 Index:
  • 5{+3} Supercycle, 7/8/1932, 4.40 (up)
  • 5{+2} Cycle, 12/9/1974, 60.96 (up)
  • 5{+1} Primary, 3/6/2009, 666.79 (up)
  • 5{0} Intermediate, 12/26/2018, 2346.58 (up)
  • S&P 500 Futures and index:
  • 4{-1} Minor, 1/4/2022, 4953.25 (down) (futures), 4818.62 (down) (index)
  • S&P 500 Futures:
  • 2{-2} Minute, 10/13/2022, 3577.75 (up)

Reading the chart. Price movements — waves – – in Elliott wave analysis are labeled with numbers within trending waves and letters with corrective waves. The subscripts — numbers in curly brackets — designate the wave’s degree, which, in Elliott wave analysis, means the relative position of a wave within the larger and smaller structures that make up the chart. R.N. Elliott, who in the 1930s developed the form of analysis that bears his name, viewed the chart as a complex structure of smaller waves nested within larger waves, which in turn are nested within still larger waves. In mathematics it’s called a fractal structure, where at every scale the pattern is similar to the others.

Learning and other resources. Elliott wave analysis provides context, not prophecy. As the 20th century semanticist Alfred Korzybski put it in his book Science and Sanity (1933), “The map is not the territory … The only usefulness of a map depends on similarity of structure between the empirical world and the map.” And I would add, in the ever-changing markets, we can judge that similarity of structure only after the fact.

See the menu page Analytical Methods for a rundown on where to go for information on Elliott wave analysis.

By Tim Bovee, Portland, Oregon, July 10, 2023

Disclaimer

Tim Bovee, Private Trader tracks the analysis and trades of a private trader for his own accounts. Nothing in this blog constitutes a recommendation to buy or sell stocks, options or any other financial instrument. The only purpose of this blog is to provide education and entertainment.

No trader is ever 100 percent successful in his or her trades. Trading in the stock and option markets is risky and uncertain. Each trader must make trading decisions for his or her own account, and take responsibility for the consequences.

License
Creative Commons License

All content on Tim Bovee, Private Trader by Timothy K. Bovee is licensed under a Creative Commons Attribution-ShareAlike 4.0 International License.

Based on a work at www.timbovee.com.
Trader’s Notebook: New Wave Degrees

A Revision of the S&P 500 Wave Degrees: Wave 2{-6} Changed to Wave 2{-2}

The present wave 2 upward correction on the S&P 500 index and futures charts has been with us since October 13, 2022. And as the wave’s lifespan has extended, it has become increasingly clear my labeling of the subwaves considers them to be further down the complex wave structure than they have turned out to be. 

Every analysis I post contains a quote from the 20th century semanticist Alfred Korzybski. In his book Science and Sanity, published 90 years ago in 1933, he wrote “The map is not the territory … The only usefulness of a map depends on similarity of structure between the empirical world and the map.” 

And in every post I add, “… in the ever-changing markets, we can judge that similarity of structure only after the fact.”

After considering the evidence, I’ve concluded that the degree given to the wave 2 correction no longer matches the reality on the chart. The map no longer matches the territory, and when that happens, what do the explorers do? They redraw the map.

This essay describes the process by which I reached my conclusion and how I’ve redrawn the map.

Elliott Wave Theory is a technique for recognizing patterns in waves, the price movements of markets over time. 

Pattern recognition, as it turns out, is something the human brain is good at. Back in the days when our ancestors lived in small bands gathering wild plants and hunting wild animals for food, those pattern recognition skills enabled them to find the beneficial and avoid the dangerous as they spent their days navigating a very large landscape.

Applying numbers to those patterns, however, really didn’t do much to help our nomadic ancestors put food on the table.

In my four decades of working with Elliott Wave Theory, I’ve been helped and hindered by  those same strengths and weaknesses over and over again.

A wave on the chart has two aspects: One is its position in the pattern. The other is the relative size of the pattern compared to the larger and smaller structures that make up its chart. That relative size is the wave’s degree.

It only takes a glance at a chart to know that it is more than the simple ups and downs that are the focus of stock market news stories. The chart is a complex structure of smaller waves nested within larger waves, which in turn are nested within still larger waves. In mathematics it’s called a fractal structure, where at every scale the pattern is similar to the others.

When R.N. Elliott developed Elliott Wave Theory in the 1930s, he combined the two aspects of the wave in a single name, anticipating that traders using his method would quickly learn that an Intermediate wave pattern is contained within a Primary wave, or that a SuperCycle wave is home to an entire Cycle wave trend.

For my analysis, I choose to make the two aspects explicit. I use the wave number, followed by a numerical subscript, in curly brackets, showing the degree relative to the Intermediate degree, which is degree {0}.. For example, a long middle wave is clearly wave 3, and its parent wave has been identified as being of the Intermediate degree, so I label that middle wave 3{-1}, meaning it is one degree below the {0} parent wave.

By the time a trend has reached wave 3 its degree is fairly clear. But what about wave 1, in its first tentative weeks? It has no context within its pattern. Is wave 1 a child of the parent wave? Or a grandchild? Or a great-great-grandchild? There’s no way to know for sure.

There are two approaches to the problem.

The first approach  is to consistently label the subwave one degree lower than the parent wave. If that turns out to not match the reality of the chart, it can always be moved one degree lower. How does the trader know when the degree labeling is too large? Elliott said the wave degrees are proportional: An Intermediate degree {0} wave is similar to others the same size. But proportionate, I’ve found, contains a lot of variety. No doubt because of that variety, Elliott didn’t estimate the duration of each degree’s waves. Clearly, he concluded that it’s a subjective judgment call.

The second approach is to put some distance between the parent wave and the subwave, assuming that the wave in its early stages is several degrees removed from the parent wave. If degree labeling  proves to be too small, it can always be raised to a higher degree. 

For the second approach, unlike with the first approach, Elliott wave analysis provides a clear signal when a pattern’s degree is too small. If the 2nd wave a pattern moves beyond the starting point of the 1st wave, then the analysis is no longer valid –the map no longer matches the territory and must be redrawn. Usually the reanalysis takes the form of switching the labeling to a larger degree.

I tend to favor the second approach because it is associated with a clear signal when a reanalysis is needed. Long-time readers will recall that this has happened several times as our present long-running correction has progressed.

Even if there is no clear signal, the need for proportionality is still important. And that is what has happened to the present correction.

In the following discussion, I’ve used the dates from the S&P 500 E-mini futures chart, which I analyze daily. The dates from the S&P 500 index might vary by a day or so.

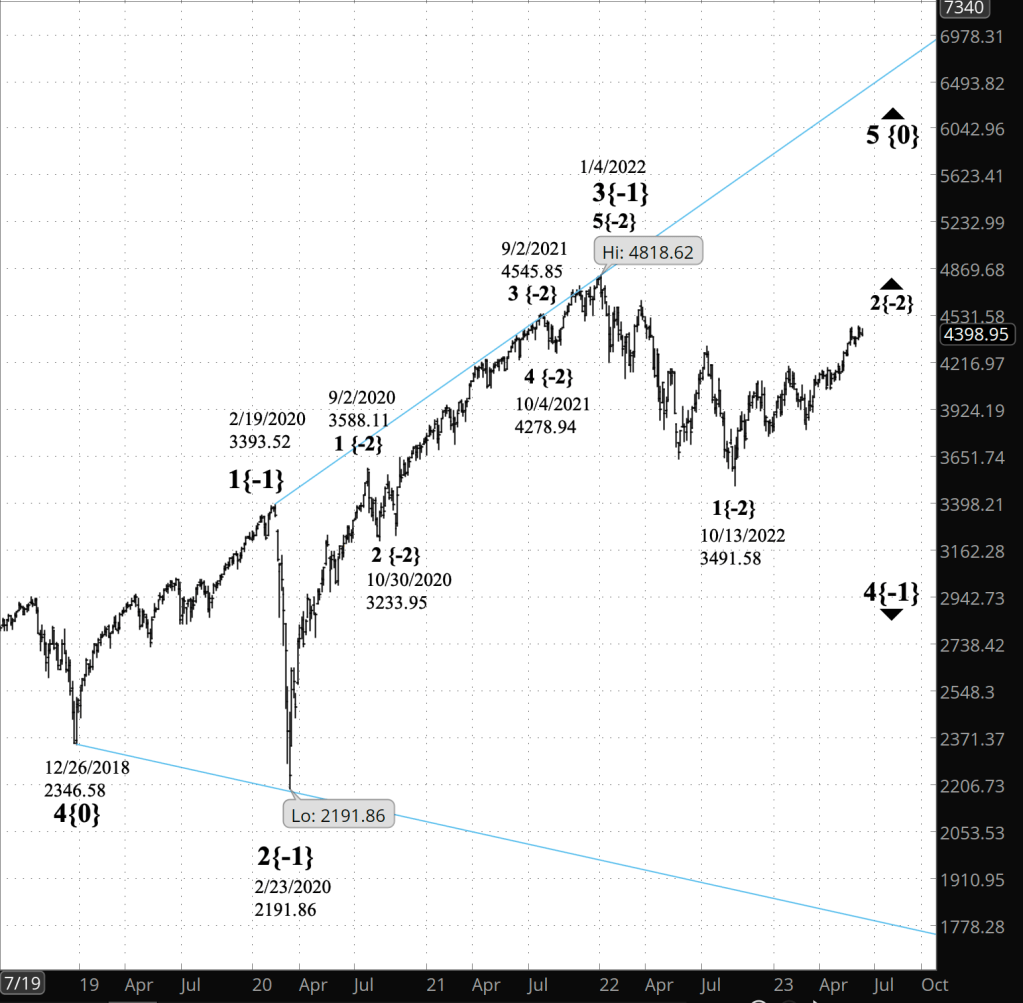
The present correction is wave 2{-6}, at what Elliott called the Minuscule degree. It is a subwave of wave 4{-1}, a downtrend that  began on January 4, 2022 and which is  in turn is a subwave of wave 5{0}, an expanding Diagonal Triangle that began in December 2018.

Within wave 4{-1}, wave 1{-6} had a duration of 0.8 years. The following wave  2{-6} has been underway for 0.7 years. Both 1st and 2nd waves tend to be on the short short side, as they set up for the longer-lasting 3rd wave to come.

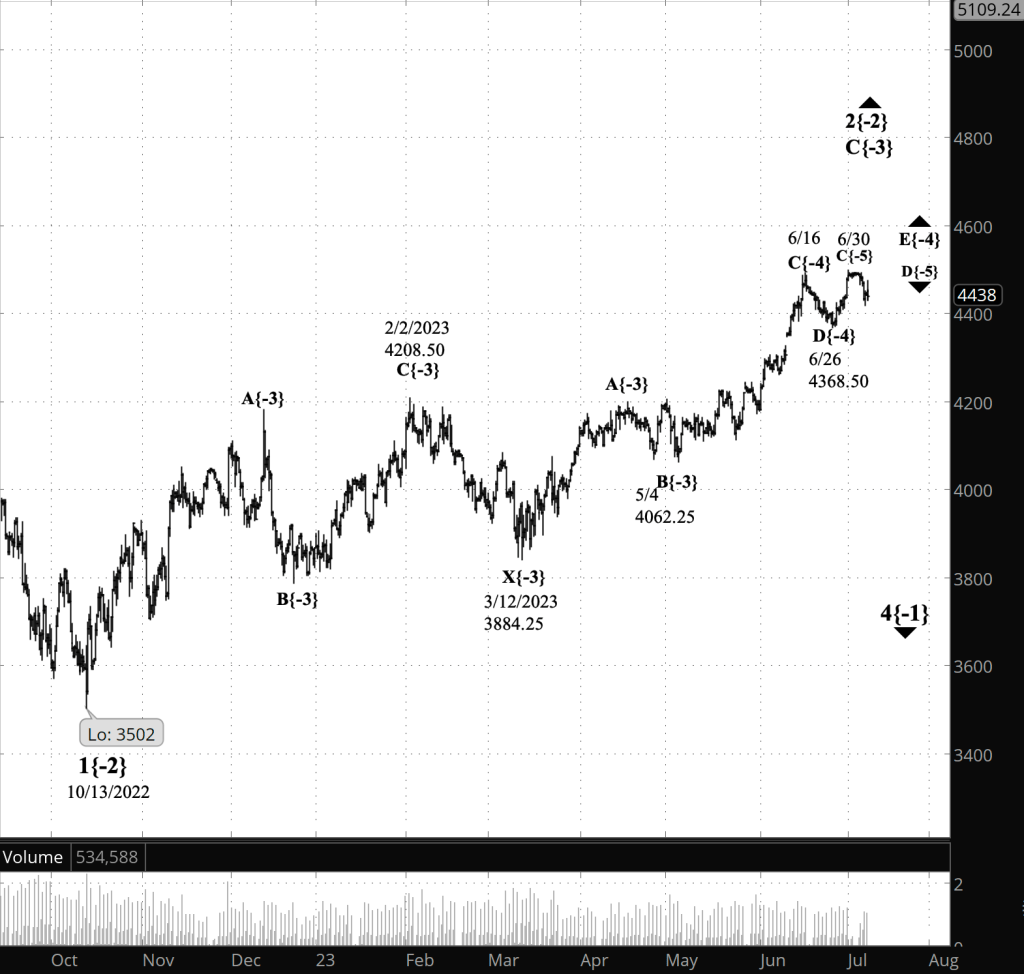
By comparison, the corresponding subwaves within wave 3(-1}, the preceding uptrend, were 0.5 years for wave 1{-2} and 0.2 years for the following correction, wave 2{-2}. That’s shorter than the distances of the waves of the {-6} degree under my present analysis, but not by much. That suggests to me that raising the degree of subwaves of wave 4{-1} would bring the analysis more in line with the reality of the chart.

So, beginning Monday, wave 2{-6} becomes wave 2{-2}, with all of its subwave degrees also raised up four levels. Here’s a close-up chart of the S&P 500 futures showing the upward correction that began on October 13, 2022:

[S&P 500 E-mini futures, 7/7/2023 close , 9-hour bars, with volume]

And here’s a longer view showing the entirety of the Expanding Diagonal Triangle that began on December 26, 2018.

[S&P 500 index, 7/7/2023 close , 3-day bars]

We Are Here.

These are the waves currently in progress under my principal analysis. Each line on the list shows the wave number, with the subscript in curly brackets, the traditional degree name, the starting date, the starting price of the S&P 500 E-mini futures, and the direction of the wave.

  • S&P 500 Index:
  • 5{+3} Supercycle, 7/8/1932, 4.40 (up)
  • 5{+2} Cycle, 12/9/1974, 60.96 (up)
  • 5{+1} Primary, 3/6/2009, 666.79 (up)
  • 5{0} Intermediate, 12/26/2018, 2346.58 (up)
  • S&P 500 Futures and index:
  • 4{-1} Minor, 1/4/2022, 4953.25 (down) (futures), 4818.62 (down) (index)
  • S&P 500 Futures:
  • 2{-2} Minute, 10/13/2022, 3577.75 (up)

Learning and other resources. Elliott wave analysis provides context, not prophecy. As the 20th century semanticist Alfred Korzybski put it in his book Science and Sanity (1933), “The map is not the territory … The only usefulness of a map depends on similarity of structure between the empirical world and the map.” And I would add, in the ever-changing markets, we can judge that similarity of structure only after the fact.

See the menu page Analytical Methods for a rundown on where to go for information on Elliott wave analysis.

By Tim Bovee, Portland, Oregon, July 9, 2023

Disclaimer

Tim Bovee, Private Trader tracks the analysis and trades of a private trader for his own accounts. Nothing in this blog constitutes a recommendation to buy or sell stocks, options or any other financial instrument. The only purpose of this blog is to provide education and entertainment.

No trader is ever 100 percent successful in his or her trades. Trading in the stock and option markets is risky and uncertain. Each trader must make trading decisions for his or her own account, and take responsibility for the consequences.

License
Creative Commons License

All content on Tim Bovee, Private Trader by Timothy K. Bovee is licensed under a Creative Commons Attribution-ShareAlike 4.0 International License.

Based on a work at www.timbovee.com.
Trader’s Notebook

3:30 p.m. New York time

Half an hour before the closing bell. The S&P 500 futures rose during the session, into the 4470s, and then pulled back. A push into the 4480s would persuade that wave E{-8}, the final wave of the corrective pattern at that degree, has begun (see the “What does it mean?” section, below). Meanwhile, this morning’s analysis is unchanged. I’ve updated the chart.

9:35 a.m. New York time

What’s happening now? The S&P 500 E-mini futures fluctuated in the 4440s and 4430s overnight until the U.S. employment figures were released an hour before the opening bell. The price whipsawed up to the 4450s and down to the 4430s, remaining within the bounds that had defined the price movement since yesterday’s session closed.

What does it mean? The upward compound correction, wave 2{-6}, that began in October is now in its second corrective pattern. That pattern is in its last leg, wave 3{-7}, which is in its final segment, wave E{-8}. The question is how far along that final segment has advanced, and nothing that happened in overnight trading provides an answer.

The final segment will have five subwaves. The fourth subwave, wave D{-9}, began on June 30, and can be counted as having completed three wave internally, meaning that it has reached its end point. As always with real-time Elliott wave analysis, there is ambiguity in the count, and I’m waiting for some upward movement with clarity to confirm that wave D{-9} has in fact ended and wave E{-9} has begun. I haven’t seen that clarity yet.

Wave E{-9} can be expected to exceed the wave C{-9} peak of 4493.75, attained on June 16, and may move significantly above that level. However, under the rules of Elliott Wave Theory, it will remain below 4953.75, the starting point on January 4, 2022, of wave 1{-6}, the downtrending wave that preceded the upward correction.

One reasonable expectation for an endpoint to wave E{-9} would be the next Fibonacci retracement level, at 4642.68, which is a 78.6% retracement of the preceding first save. The steps on the Fibonacci ladder, shown on the chart in red, are often reversal points, but not always. Also, the reversals often happen in the area of a retraxement level, not precisely at the level.

Wave E{-9}, when complete, will also be the end of the second corrective pattern in wave 2{-6}. Compound corrections can have up to three corrective patterns. The second corrective patten either will be followed by a powerful decline back to the starting point of the upward correction and likely much lower, or will have shallow declining wave that will link the second corrective pattern to a third corrective pattern.

What are the alternatives? In the July 6 Trader’s Notebook, I discussed evidence suggesting that placing the 2nd wave correction in the {-6} degree was disproportionately small compared to earlier waves. I’ll be working on the problem over the weekend and will post a decision on any degree changes by Monday, July 10.

[S&P 500 E-mini futures at 3:30 p.m., 230-minute bars, with volume]

Reading the chart. Price movements — waves – – in Elliott wave analysis are labeled with numbers within trending waves and letters with corrective waves. The subscripts — numbers in curly brackets — designate the wave’s degree, which, in Elliott wave analysis, means the relative position of a wave within the larger and smaller structures that make up the chart. R.N. Elliott, who in the 1930s developed the form of analysis that bears his name, viewed the chart as a complex structure of smaller waves nested within larger waves, which in turn are nested within still larger waves. In mathematics it’s called a fractal structure, where at every scale the pattern is similar to the others.

What does Elliott wave theory say? Here are the waves that underly the analysis.

  • An upward correction, a Zigzag, wave 2{-6}, began on October 13, 2022 and is underway.
  • The upward correction, wave 2{-6}, is taking a compound form, which can contain up to three corrective patterns.
  • The correction is in its second corrective pattern, which is in wave C{-7}, its final wave.
  • The end of the present wave C{-7} could also be the end of the wave 2{-6} correction if the compound structure contains two subwaves.
  • Or the present corrective pattern could be followed by a declining connector, wave X{-7}, and then a third corrective pattern.
  • Wave C{-7} will have five subwaves and is in wave E{-8}, the final subwave.
  • Wave E{-8} will also have five subwaves and is in wave D{-9}, the fourth of the set.
  • Wave 2{-6}, when complete, will be followed by a powerful downtrend, wave 3{-6}.
  • Under the rules of Elliott wave analysis, wave 2{-6} cannot move beyond the beginning of wave 1{-6}, which was the January 4, 2022 peak at 4953.25. (I’ve adjusted the January 4 peak.)

We Are Here.

These are the waves currently in progress under my principal analysis. Each line on the list shows the wave number, with the subscript in curly brackets, the traditional degree name, the starting date, the starting price of the S&P 500 E-mini futures, and the direction of the wave.

  • S&P 500 Index:
  • 5{+3} Supercycle, 7/8/1932, 4.40 (up)
  • 5{+2} Cycle, 12/9/1974, 60.96 (up)
  • 5{+1} Primary, 3/6/2009, 666.79 (up)
  • 5{0} Intermediate, 12/26/2018, 2346.58 (up)
  • S&P 500 Futures and index:
  • 4{-1} Minor, 1/4/2022, 4953.25 (down) (futures), 4818.62 (down) (index)
  • S&P 500 Futures:
  • 1{-2} Minute, 1/4/2022, 4953.25 (down)
  • 1{-3} Minuette, 1/4/2022, 4953.25 (down)
  • 1{-4} Subminuette, 1/4/2022, 4953.25 (down)
  • 1{-5} Micro, 1/4/2022, 4953.25 (down)
  • 2{-6} Minuscule, 10/13/2022, 3577.75 (up)

Learning and other resources. Elliott wave analysis provides context, not prophecy. As the 20th century semanticist Alfred Korzybski put it in his book Science and Sanity (1933), “The map is not the territory … The only usefulness of a map depends on similarity of structure between the empirical world and the map.” And I would add, in the ever-changing markets, we can judge that similarity of structure only after the fact.

See the menu page Analytical Methods for a rundown on where to go for information on Elliott wave analysis.

By Tim Bovee, Portland, Oregon, July 7, 2023

Disclaimer

Tim Bovee, Private Trader tracks the analysis and trades of a private trader for his own accounts. Nothing in this blog constitutes a recommendation to buy or sell stocks, options or any other financial instrument. The only purpose of this blog is to provide education and entertainment.

No trader is ever 100 percent successful in his or her trades. Trading in the stock and option markets is risky and uncertain. Each trader must make trading decisions for his or her own account, and take responsibility for the consequences.

License
Creative Commons License

All content on Tim Bovee, Private Trader by Timothy K. Bovee is licensed under a Creative Commons Attribution-ShareAlike 4.0 International License.

Based on a work at www.timbovee.com.
Trader’s Notebook

3:30 p.m. New York time

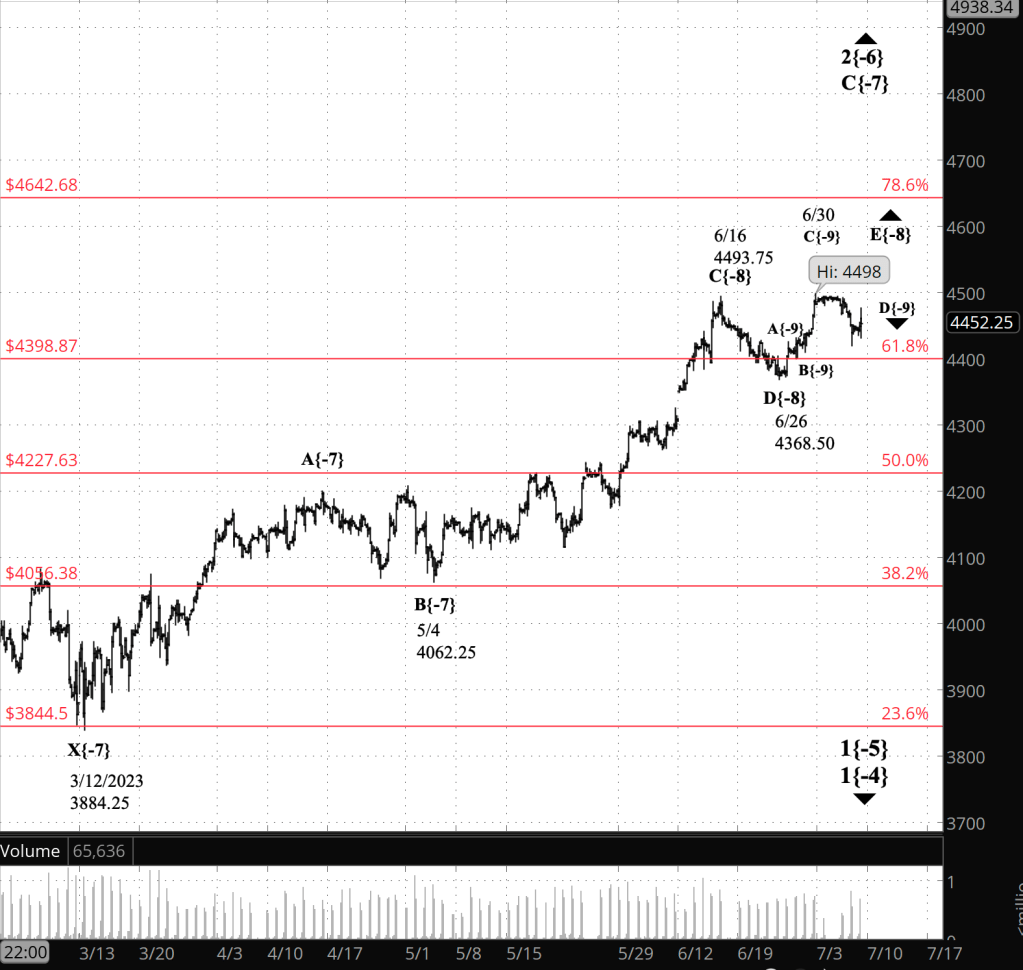
Half an hour before the closing bell. The S&P 500 futures fell during the session, from the 4480s to a low of 4419.50. It then reversed, reaching back into the 4450s. The smallest wave I’m tracking, wave D{-9}, is the next to the last wave within the fifth wave, E{-8}, of the last wave, C{-7}, within the second corrective pattern within the long-running upward correction, wave 2{-6}.

Wave D{-9} will have three subwaves, and by my count, the session low is the end of the third subwave, wave C{-10}. If that’s the case, wave D{-9} has ended and wave E{-9} is underway. However, it’s also possible that the rise following the session low is a subwave of wave D{-9}, which still has a bit more downside left.

Here’s a close-up chart showing the pattern.

[S&P 500 E-mini futures at 3:15 p.m., 20-minute bars]

For now, I’m leaving the analysis as it was this morning: Wave D{-9} is still underway. I’ll revisit the issue in tomorrow morning’s post, after seeing what the overnight trading and early session trading looks like. I’ve updated this morning’s chart, below.

9:35 a.m. New York time

What’s happening now? The S&P 500 E-mini futures declined overnight, beginning in the 4470s and reaching the 4435 shortly after the opening bell.

What does it mean? The upward compound correction that began on October 13, 2022 continues to work through the end game of its second corrective pattern.

The second corrective patten, when complete, will either be followed by a powerful decline back to the starting point of the upward correction and likely much lower, or will have shallow declining wave that will link the second corrective pattern to a third corrective pattern. A compound correction can have no more than three corrective patterns.

What are the alternatives? There is some ambiguity as to the relative degree of the correction — a not unusual situation. I’ve marked it as {-6} — Minuscule Degree in traditional Elliott wave terminology — but it could be larger. (See the “Reading the chart” section, below, for an explanation of how I designate wave degrees on the chart.)

How much larger? To get an idea of what’s “normal” in wave duration, I turned to the S&P 500 index chart and tracked the waves within the uptrend that has been underway since December 2018.

The present top wave of the movement is wave 5{0}, a downtrend that has so far lasted 4.5 years. The preceding 3rd wave, wave 3{0}, lasted about 3.8 years. The other waves are far shorter.

That makes a good case for my degree labeling to be far smaller than chart would imply. On the other hand, there is lot of variety in size and duration among waves of the same degree. So it’s a complex problem, and figuring it out will be a project for the weekend, and I’ll report back on Monday.

Reading the chart. Price movements — waves – – in Elliott wave analysis are labeled with numbers within trending waves and letters with corrective waves. The subscripts — numbers in curly brackets — designate the wave’s degree, which, in Elliott wave analysis, means the relative position of a wave within the larger and smaller structures that make up the chart. R.N. Elliott, who in the 1930s developed the form of analysis that bears his name, viewed the chart as a complex structure of smaller waves nested within larger waves, which in turn are nested within still larger waves. In mathematics it’s called a fractal structure, where at every scale the pattern is similar to the others.

[S&P 500 E-mini futures at 3:30 p.m., 4-hour bars, with volume]

What does Elliott wave theory say? Here are the waves that underly the analysis.

  • An upward correction, a Zigzag, wave 2{-6}, began on October 13, 2022 and is underway.
  • The upward correction, wave 2{-6}, is taking a compound form, which can contain up to three corrective patterns.
  • The correction is in its second corrective pattern, which is in wave C{-7}, its final wave.
  • The end of the present wave C{-7} could also be the end of the wave 2{-6} correction if the compound structure contains two subwaves.
  • Or the present corrective pattern could be followed by a declining connector, wave X{-7}, and then a third corrective pattern.
  • Wave C{-7} will have five subwaves and is in wave E{-8}, the final subwave.
  • Wave E{-8} will also have five subwaves and is in wave D{-9}, the fourth of the set.
  • Wave 2{-6}, when complete, will be followed by a powerful downtrend, wave 3{-6}.
  • Under the rules of Elliott wave analysis, wave 2{-6} cannot move beyond the beginning of wave 1{-6}, which was the January 4, 2022 peak at 4953.25. (I’ve adjusted the January 4 peak.)

We Are Here.

These are the waves currently in progress under my principal analysis. Each line on the list shows the wave number, with the subscript in curly brackets, the traditional degree name, the starting date, the starting price of the S&P 500 E-mini futures, and the direction of the wave.

  • S&P 500 Index:
  • 5{+3} Supercycle, 7/8/1932, 4.40 (up)
  • 5{+2} Cycle, 12/9/1974, 60.96 (up)
  • 5{+1} Primary, 3/6/2009, 666.79 (up)
  • 5{0} Intermediate, 12/26/2018, 2346.58 (up)
  • S&P 500 Futures and index:
  • 4{-1} Minor, 1/4/2022, 4953.25 (down) (futures), 4818.62 (down) (index)
  • S&P 500 Futures:
  • 1{-2} Minute, 1/4/2022, 4953.25 (down)
  • 1{-3} Minuette, 1/4/2022, 4953.25 (down)
  • 1{-4} Subminuette, 1/4/2022, 4953.25 (down)
  • 1{-5} Micro, 1/4/2022, 4953.25 (down)
  • 2{-6} Minuscule, 10/13/2022, 3577.75 (up)

Learning and other resources. Elliott wave analysis provides context, not prophecy. As the 20th century semanticist Alfred Korzybski put it in his book Science and Sanity (1933), “The map is not the territory … The only usefulness of a map depends on similarity of structure between the empirical world and the map.” And I would add, in the ever-changing markets, we can judge that similarity of structure only after the fact.

See the menu page Analytical Methods for a rundown on where to go for information on Elliott wave analysis.

By Tim Bovee, Portland, Oregon, July 6, 2023

Disclaimer

Tim Bovee, Private Trader tracks the analysis and trades of a private trader for his own accounts. Nothing in this blog constitutes a recommendation to buy or sell stocks, options or any other financial instrument. The only purpose of this blog is to provide education and entertainment.

No trader is ever 100 percent successful in his or her trades. Trading in the stock and option markets is risky and uncertain. Each trader must make trading decisions for his or her own account, and take responsibility for the consequences.

License
Creative Commons License

All content on Tim Bovee, Private Trader by Timothy K. Bovee is licensed under a Creative Commons Attribution-ShareAlike 4.0 International License.

Based on a work at www.timbovee.com.

Trader’s Notebook

9:35 a.m. New York time

Half an hour before the closing bell. The S&P 500 futures have remained within their overnight range during the session. No change in the analysis. I’ve updated the chart.

What’s happening now? The S&P 500 E-mini futures declined from the 4490s overnight, reaching into the 4460s as the opening bell approached.

What does it mean? The decline marks an additional step toward completion of the corrective pattern that began on March 12 within an upward compound correction that began on October 13, 2022.

When the corrective pattern is complete, there are two possibilities for the next step:

  • Either the second corrective pattern is the final pattern within the compound correction, and a powerful downtrend follows…
  • Or the compound correction produces a third and final corrective pattern, connected to a second pattern by a connector wave.

On the chart, the upward correction is labeled wave 2{-6}, and its second corrective pattern is in its final subwave, wave C{-7}, which is in its still smaller final subwave, wave E{-8}. Within wave E{-8}, the middle subwave, wave C{-9}, ended on June 30. It was followed by a subwave pattern and then today’s overnight decline, which are wave D{-9}, the next to the last subwave of wave E{-8}.

Waves of this {-9} degree set tend to last for only a few days. Wave C{-9}, the longest wave so far within the set, took two days to reach completion. If that pattern holds, then waves E{-8} and C{-7} can be expected to reach completion by next week.

The chart shows only the second corrective pattern, our primary interest at this point in the analysis.

What are the alternatives? There is some ambiguity as to the relative degree of the correction — a not unusual situation. I’ve marked it as {-6} — Minuscule Degree in traditional Elliott wave terminology — but it could be larger.

[S&P 500 E-mini futures at 3:30 p.m., 4-hour bars, with volume]

What does Elliott wave theory say? Here are the waves that underly the analysis.

  • An upward correction, a Zigzag, wave 2{-6}, began on October 13, 2022 and is underway.
  • The upward correction, wave 2{-6}, is taking a compound form, which can contain up to three corrective patterns.
  • The correction is in its second corrective pattern, which is in wave C{-7}, its final wave.
  • The end of the present wave C{-7} could also be the end of the wave 2{-6} correction if the compound structure contains two subwaves.
  • Or the present corrective pattern could be followed by a declining connector, wave X{-7}, and then a third corrective pattern.
  • Wave C{-7} will have five subwaves and is in wave E{-8}, the final subwave.
  • Wave E{-8} will also have five subwaves and is in wave D{-9}, the fourth of the set.
  • Wave 2{-6}, when complete, will be followed by a powerful downtrend, wave 3{-6}.
  • Under the rules of Elliott wave analysis, wave 2{-6} cannot move beyond the beginning of wave 1{-6}, which was the January 4, 2022 peak at 4953.25. (I’ve adjusted the January 4 peak.)

Reading the chart. Price movements — waves – – in Elliott wave analysis are labeled with numbers within trending waves and letters with corrective waves. The subscripts — numbers in curly brackets — designate the wave’s degree, which, in Elliott wave analysis, means the relative position of a wave within the larger and smaller structures that make up the chart. R.N. Elliott, who in the 1930s developed the form of analysis that bears his name, viewed the chart as a complex structure of smaller waves nested within larger waves, which in turn are nested within still larger waves. In mathematics it’s called a fractal structure, where at every scale the pattern is similar to the others.

We Are Here.

These are the waves currently in progress under my principal analysis. Each line on the list shows the wave number, with the subscript in curly brackets, the traditional degree name, the starting date, the starting price of the S&P 500 E-mini futures, and the direction of the wave.

  • S&P 500 Index:
  • 5{+3} Supercycle, 7/8/1932, 4.40 (up)
  • 5{+2} Cycle, 12/9/1974, 60.96 (up)
  • 5{+1} Primary, 3/6/2009, 666.79 (up)
  • 5{0} Intermediate, 12/26/2018, 2346.58 (up)
  • S&P 500 Futures and index:
  • 4{-1} Minor, 1/4/2022, 4953.25 (down) (futures), 4818.62 (down) (index)
  • S&P 500 Futures:
  • 1{-2} Minute, 1/4/2022, 4953.25 (down)
  • 1{-3} Minuette, 1/4/2022, 4953.25 (down)
  • 1{-4} Subminuette, 1/4/2022, 4953.25 (down)
  • 1{-5} Micro, 1/4/2022, 4953.25 (down)
  • 2{-6} Minuscule, 10/13/2022, 3577.75 (up)

Learning and other resources. Elliott wave analysis provides context, not prophecy. As the 20th century semanticist Alfred Korzybski put it in his book Science and Sanity (1933), “The map is not the territory … The only usefulness of a map depends on similarity of structure between the empirical world and the map.” And I would add, in the ever-changing markets, we can judge that similarity of structure only after the fact.

See the menu page Analytical Methods for a rundown on where to go for information on Elliott wave analysis.

By Tim Bovee, Portland, Oregon, July 5, 2023

Disclaimer

Tim Bovee, Private Trader tracks the analysis and trades of a private trader for his own accounts. Nothing in this blog constitutes a recommendation to buy or sell stocks, options or any other financial instrument. The only purpose of this blog is to provide education and entertainment.

No trader is ever 100 percent successful in his or her trades. Trading in the stock and option markets is risky and uncertain. Each trader must make trading decisions for his or her own account, and take responsibility for the consequences.

License
Creative Commons License

All content on Tim Bovee, Private Trader by Timothy K. Bovee is licensed under a Creative Commons Attribution-ShareAlike 4.0 International License.

Based on a work at www.timbovee.com.
Trader’s Notebook

9:35 a.m. New York time

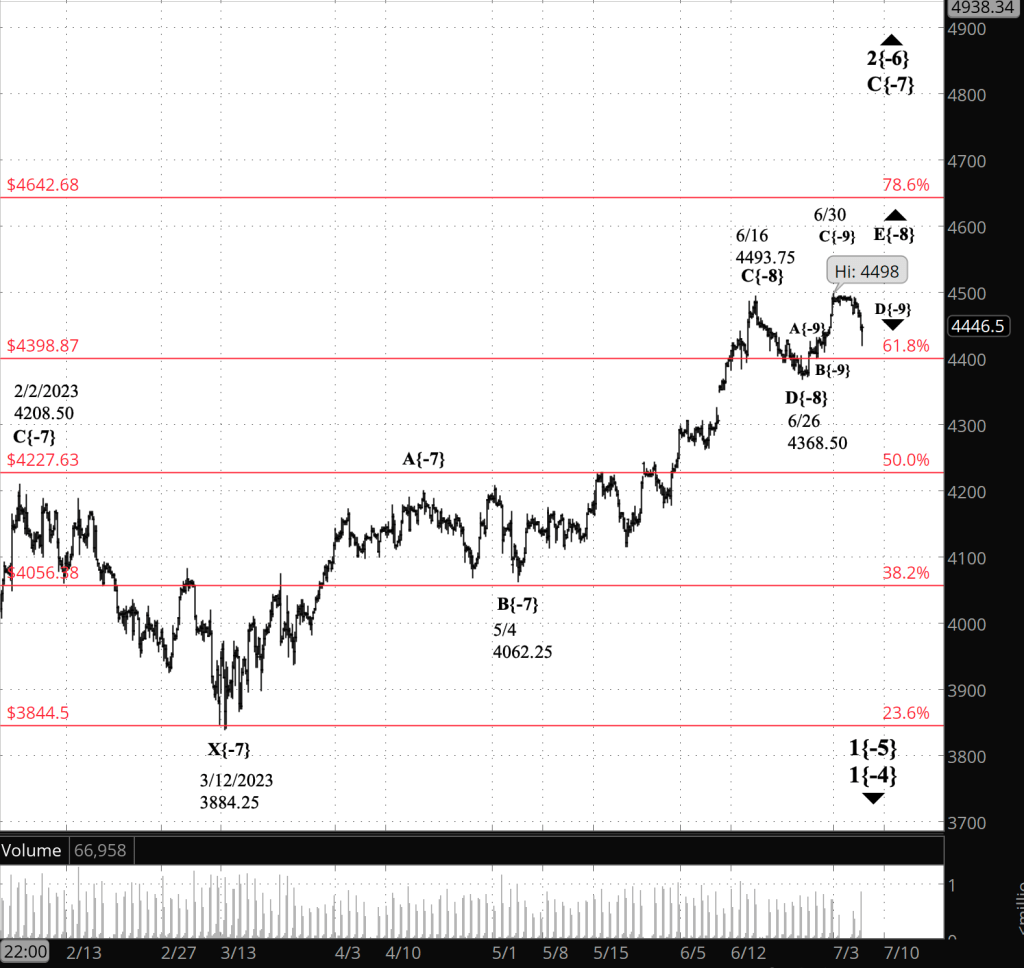
What’s happening now? The S&P 500 E-mini futures continued to trade in the 4490s and 4480s during a week that began with U.S. markets having a shortened session on Monday and staying closed today, Tuesday, for .the Independence Day holiday. Other global exchanges, such as London and Tokyo, were open for their regular sessions.

What does it mean? The only analysis possible is more of the same. An upward compounding correction, wave 2{-6} is in its second corrective pattern, and internally is in the final wave, rising wave E{-8}, within the last leg of the correction, rising wave C{-7}.

The end of wave E{-8} will also be the end of wave C{-7} and second corrective pattern.

Compound corrections can have as many as three waves, although many stop at two. There’s no way to know what this correction will do.

If the second corrective pattern marks the end of wave 2{-6}, then it will be followed by a powerful downtrending wave 3{-6}, which will carry the price below the start of the upward correction, 3502 on October 13, 2022, and, if it’s a typical 3rd wave, significantly lower.

If the correction will have a third corrective pattern, then there will be a downward separator wave, X{-7}, which will likely remain above the starting point of the correction.,

What are the alternatives? There is some ambiguity as to the relative degree of the correction — a not unusual situation. I’ve marked it as {-6} — Minuscule Degree in traditional Elliott wave terminology — but it could be larger.

Reading the chart. Price movements — waves – – in Elliott wave analysis are labeled with numbers within trending waves and letters with corrective waves. The subscripts — numbers in curly brackets — designate the wave’s degree, which, in Elliott wave analysis, means the relative position of a wave within the larger and smaller structures that make up the chart. R.N. Elliott, who in the 1930s developed the form of analysis that bears his name, viewed the chart as a complex structure of smaller waves nested within larger waves, which in turn are nested within still larger waves. In mathematics it’s called a fractal structure, where at every scale the pattern is similar to the others.

[S&P 500 E-mini futures at 9:35 a.m., 4-hour bars, with volume]

What does Elliott wave theory say? Here are the waves that underly the analysis.

  • An upward correction, a Zigzag, wave 2{-6}, began on October 13, 2022 and is underway.
  • The upward correction, wave 2{-6}, is taking a compound form, which can contain up to three corrective patterns.
  • The correction is in its second corrective pattern, which is in wave C{-7}, its final wave.
  • The end of the present wave C{-7} could also be the end of the wave 2{-6} correction if the compound structure contains two subwaves.
  • Or the present corrective pattern could be followed by a declining connector, wave X{-7}, and then a third corrective pattern.
  • Wave 2{-6}, when complete, will be followed by a powerful downtrend, wave 3{-6}.
  • Under the rules of Elliott wave analysis, wave 2{-6} cannot move beyond the beginning of wave 1{-6}, which was the January 4, 2022 peak at 4953.25. (I’ve adjusted the January 4 peak.)

We Are Here.

These are the waves currently in progress under my principal analysis. Each line on the list shows the wave number, with the subscript in curly brackets, the traditional degree name, the starting date, the starting price of the S&P 500 E-mini futures, and the direction of the wave.

  • S&P 500 Index:
  • 5{+3} Supercycle, 7/8/1932, 4.40 (up)
  • 5{+2} Cycle, 12/9/1974, 60.96 (up)
  • 5{+1} Primary, 3/6/2009, 666.79 (up)
  • 5{0} Intermediate, 12/26/2018, 2346.58 (up)
  • S&P 500 Futures and index:
  • 4{-1} Minor, 1/4/2022, 4953.25 (down) (futures), 4818.62 (down) (index)
  • S&P 500 Futures:
  • 1{-2} Minute, 1/4/2022, 4953.25 (down)
  • 1{-3} Minuette, 1/4/2022, 4953.25 (down)
  • 1{-4} Subminuette, 1/4/2022, 4953.25 (down)
  • 1{-5} Micro, 1/4/2022, 4953.25 (down)
  • 2{-6} Minuscule, 10/13/2022, 3577.75 (up)

Learning and other resources. Elliott wave analysis provides context, not prophecy. As the 20th century semanticist Alfred Korzybski put it in his book Science and Sanity (1933), “The map is not the territory … The only usefulness of a map depends on similarity of structure between the empirical world and the map.” And I would add, in the ever-changing markets, we can judge that similarity of structure only after the fact.

See the menu page Analytical Methods for a rundown on where to go for information on Elliott wave analysis.

By Tim Bovee, Portland, Oregon, July 4, 2023

Disclaimer

Tim Bovee, Private Trader tracks the analysis and trades of a private trader for his own accounts. Nothing in this blog constitutes a recommendation to buy or sell stocks, options or any other financial instrument. The only purpose of this blog is to provide education and entertainment.

No trader is ever 100 percent successful in his or her trades. Trading in the stock and option markets is risky and uncertain. Each trader must make trading decisions for his or her own account, and take responsibility for the consequences.

License
Creative Commons License

All content on Tim Bovee, Private Trader by Timothy K. Bovee is licensed under a Creative Commons Attribution-ShareAlike 4.0 International License.

Based on a work at www.timbovee.com.
Trader’s Notebook

U.S. markets schedule. Tomorrow, July 4, is a major holiday in the United States, celebrating its declaration of independence from the British Empire. U.S. markets will close early today, at 1 p.m. New York time, and will be closed tomorrow. The London and Tokyo markets traded today and will trade tomorrow. Today’s final update of Trader’s Notebook will be posted half an hour before the close, at 12:30 p.m. New York time.

12:30 p.m. New York time

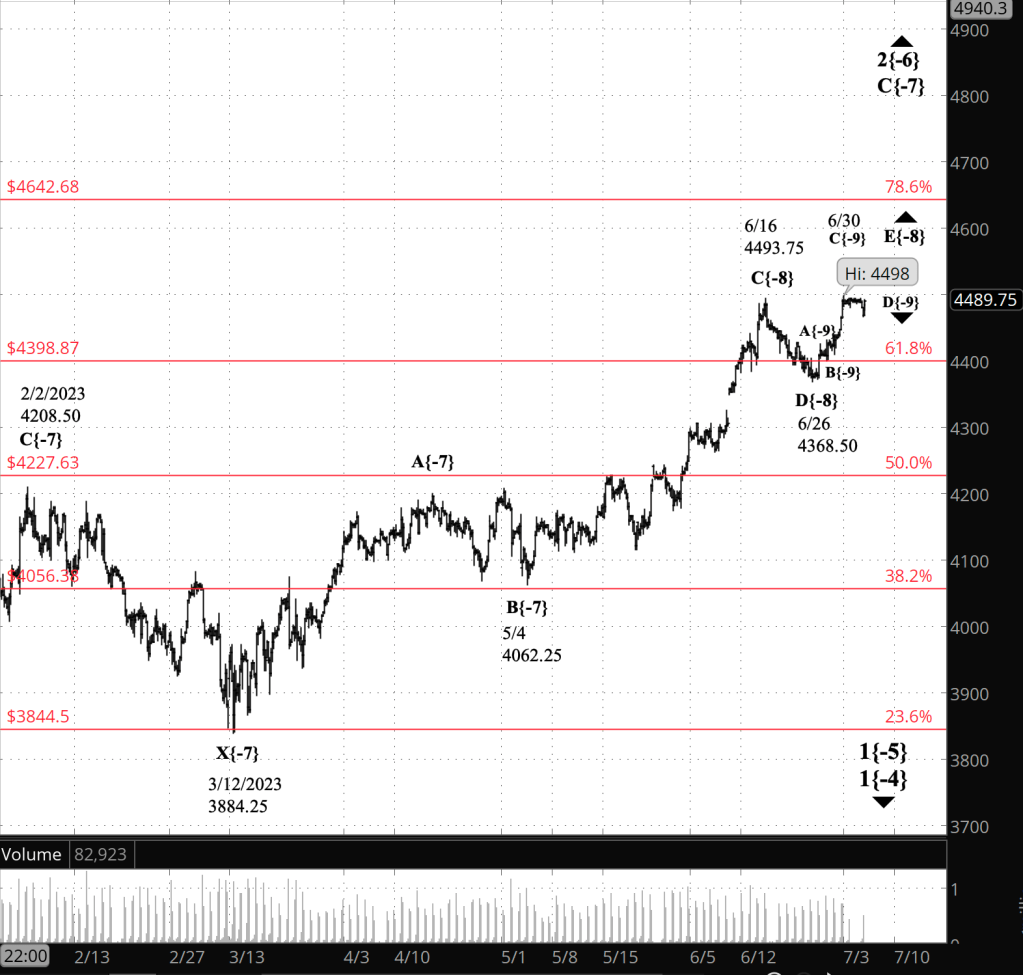
Half an hour before the closing bell. The S&P 500 futures has so far remained within the overnight range during the abbreviated session, rising from the 4470s back into the 4490s. No change in the analysis. I’ve updated the chart.

9:35 a.m. New York time

What’s happening now? The S&P 500 E-mini futures traded sideways overnight, peaked after 12 hours at 4493.25 and then quickly dropped, reaching into the 4470s as the opening bell sounded.

What does it mean? The question with which I closed the week on Friday remains unanswered: Is the rise that began on June 6 is the final subwave within the rising final wave of a corrective pattern, or is it an upward movement within the falling next-to-the-last subwave.

I’ve chosen to mark the chart with the scenario that the final subwave is underway as being the slightly more likely choice

In either case, the upward compound correction that began on October 13, 2022 continues and is in the last leg of its second corrective pattern. When the second pattern is complete, the price will either fall deeply in a downtrend, or will fall less dramatically in a linking wave that will be followed by a third corrective pattern, which when complete will be the end of the upward correction.

What are the alternatives? As is common, there is some ambiguity as to the relative degree of the correction. I’ve marked it as {-6} — Minuscule Degree in traditional Elliott wave terminology — but it could be larger.

[S&P 500 E-mini futures at 12:30 p.m., 4-hour bars, with volume]

What does Elliott wave theory say? Here are the waves that underly the analysis.

  • An upward correction, a Zigzag, wave 2{-6}, began on October 13, 2022 and is underway.
  • The upward correction, wave 2{-6}, is taking a compound form, which can contain up to three corrective patterns.
  • The correction is in its second corrective pattern, which is in wave C{-7}, its final wave.
  • The end of the present wave C{-7} could also be the end of the wave 2{-6} correction if the compound structure contains two subwaves.
  • Or the present corrective pattern could be followed by a declining connector, wave X{-7}, and then a third corrective pattern.
  • Wave 2{-6}, when complete, will be followed by a powerful downtrend, wave 3{-6}.
  • Under the rules of Elliott wave analysis, wave 2{-6} cannot move beyond the beginning of wave 1{-6}, which was the January 4, 2022 peak at 4953.25. (I’ve adjusted the January 4 peak.)

We Are Here.

These are the waves currently in progress under my principal analysis. Each line on the list shows the wave number, with the subscript in curly brackets, the traditional degree name, the starting date, the starting price of the S&P 500 E-mini futures, and the direction of the wave.

  • S&P 500 Index:
  • 5{+3} Supercycle, 7/8/1932, 4.40 (up)
  • 5{+2} Cycle, 12/9/1974, 60.96 (up)
  • 5{+1} Primary, 3/6/2009, 666.79 (up)
  • 5{0} Intermediate, 12/26/2018, 2346.58 (up)
  • S&P 500 Futures and index:
  • 4{-1} Minor, 1/4/2022, 4953.25 (down) (futures), 4818.62 (down) (index)
  • S&P 500 Futures:
  • 1{-2} Minute, 1/4/2022, 4953.25 (down)
  • 1{-3} Minuette, 1/4/2022, 4953.25 (down)
  • 1{-4} Subminuette, 1/4/2022, 4953.25 (down)
  • 1{-5} Micro, 1/4/2022, 4953.25 (down)
  • 2{-6} Minuscule, 10/13/2022, 3577.75 (up)

Learning and other resources. Elliott wave analysis provides context, not prophecy. As the 20th century semanticist Alfred Korzybski put it in his book Science and Sanity (1933), “The map is not the territory … The only usefulness of a map depends on similarity of structure between the empirical world and the map.” And I would add, in the ever-changing markets, we can judge that similarity of structure only after the fact.

See the menu page Analytical Methods for a rundown on where to go for information on Elliott wave analysis.

By Tim Bovee, Portland, Oregon, July 3, 2023

Disclaimer

Tim Bovee, Private Trader tracks the analysis and trades of a private trader for his own accounts. Nothing in this blog constitutes a recommendation to buy or sell stocks, options or any other financial instrument. The only purpose of this blog is to provide education and entertainment.

No trader is ever 100 percent successful in his or her trades. Trading in the stock and option markets is risky and uncertain. Each trader must make trading decisions for his or her own account, and take responsibility for the consequences.

License
Creative Commons License

All content on Tim Bovee, Private Trader by Timothy K. Bovee is licensed under a Creative Commons Attribution-ShareAlike 4.0 International License.

Based on a work at www.timbovee.com.
Trader’s Notebook

3:30 p.m. New York time

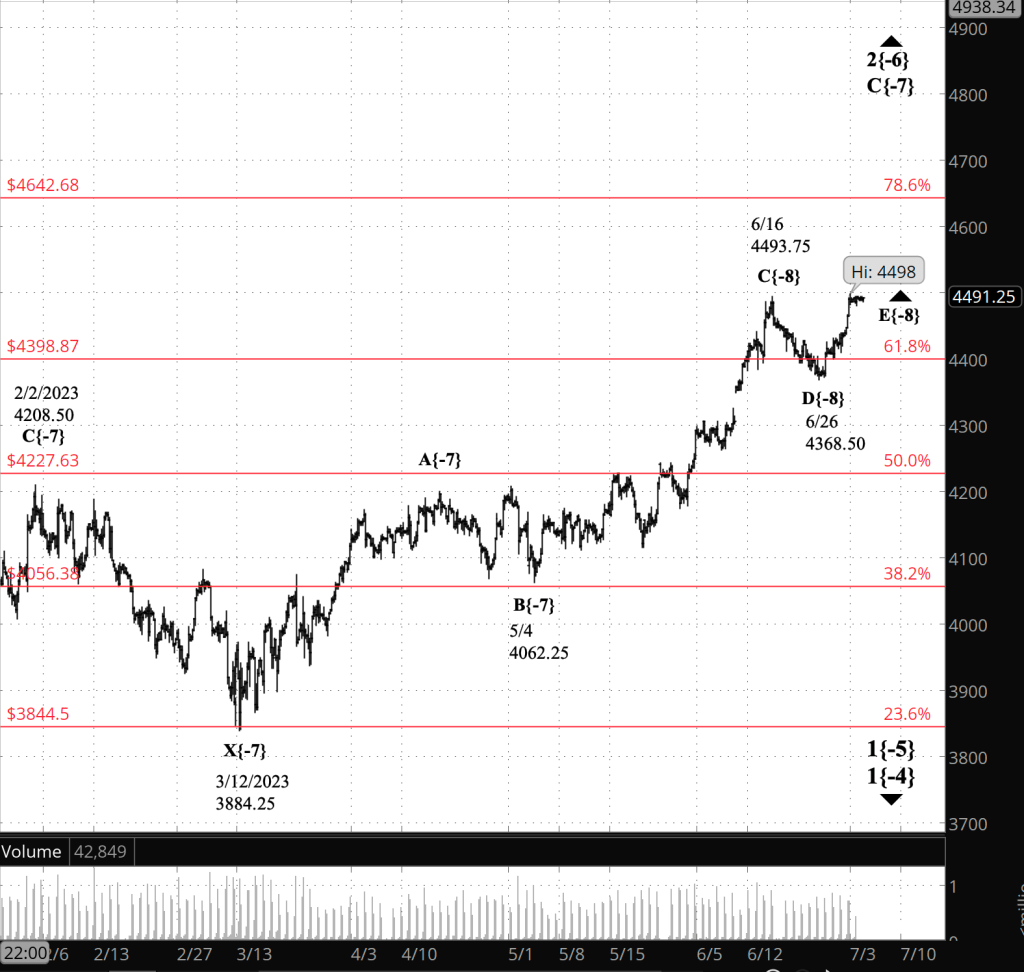
Half an hour before the closing bell. The S&P 500 continued to rise during the session, as the final subwave within the last leg of the compound correction’s second corrective pattern continued.

The final subwave is wave E{-8}. I expect it to contain five waves one degree smaller. When that fifth smaller wave is complete, the last leg, wave C{-7}, of the second corrective pattern will be complete.

The correction containing the patterns is wave 2{-6}. Under the rules of Elliott Wave Theory, a second wave cannot move beyond the starting point of the preceding 1st wave. Wave 1{-6} began on January 4, 2022 from 4808.25. That price is an absolute upper limit for wave 2{-6}. Any move higher will mean that the analysis doesn’t match the chart — the map doesn’t match the territory — and I’ll reanalyze the chart.

What happens next? Well, as is so often the case with market charts, it depends.

A compound correction can have two or three corrective patterns within it.

If this one has two, then the end of wave C{-7} will also be the end of the upward correction, wave 2{-6}. Downtrending wave 3{-6} will follow, and like all third waves, it will be powerful, will carry the price below the starting point of the wave 2{-6} correction, from 3508, and almost certainly well below that level. For optimistic traders whose positions are long, it will feel like the roller coaster has reached the fast downslope, whose end point can’t seen.

If the correction will contain three corrective patterns, then the present wave C{-7} will be followed a relatively shallow connector, wave X{-7}, which will remain above the correction’s starting point, 3508, and perhaps well above that level. When wave X{-7} is complete, a third corrective pattern will begin with yet another upward wave A{-7}.

There has been a lot written recently about the collapse of everything, most notably End Times by Peter Turchin. In its small way, this chart feels like the End Times for our long-running upward correction.

I’ve updated the upper chart, retaining this morning’s lower chart for comparison with the revised analysis.

2:15 p.m. New York time

The final subwave begins. I noted this a move above the upward correction’s prior peak, 44903.75, would mean that the final subwave within the last leg of the compound correction’s second corrective pattern has begun. The price this afternoon has moved to 4494.25 (so far), meaning that the final subwave is underway. In Elliott wave terminology, wave E{-8} within wave C{-7} within the correction, wave 2{-6}, has begun.

[S&P 500 E-mini futures at 3:30 p.m., 4-hour bars, with volume]

9:35 a.m. New York time

What’s happening now? The S&P 500 E-mini futures spiked up into the 4470s when the PCE inflation numbers were released, remaining below the high set so far by the present upward correction, 4493.75

What does it mean? In question as the week comes to a close is whether the rise that began on June 6 is the final subwave within the rising final wave of a corrective pattern, or is an upward movement within the falling next-to-the-last subwave. A move above the prior peak within the correction, 4493.75, would confirm the final-subwave scenario. A reversal and fall below 4368.50 would confirm the next-to-the-last subwave scenario.

In any case, when the final subwave is complete, it will also mark the end of the second corrective pattern within a compound correction that began on October 13, 2022. At that point, one of two possibilities will play out: Either the compound correction adds a third and final corrective pattern, or the upward correction ends and an energetic downtrend begins.

What are the alternatives? As is common, there is some ambiguity as to the relative degree of the correction. I’ve marked it as {-6} — Minuscule Degree in traditional Elliott wave terminology — but it could be larger.

The week ahead. Next Tuesday, July 4, is the Independence Day holiday in the United States. U.S. markets will be closed on the holiday and on Monday, July 3, they will close early, at 1 p.m. New York time. The London and Tokyo markets will trade on both days, and I’ll report on S&P 500 futures trading that occurs on those days.

[S&P 500 E-mini futures at 9:35 a.m., 4-hour bars, with volume]

[Chart outdated by this afternoon’s new price peak]

What does Elliott wave theory say? Here are the waves that underly the analysis.

  • An upward correction, a Zigzag, wave 2{-6}, began on October 13, 2022 and is underway.
  • The upward correction, wave 2{-6}, is taking a compound form, which can contain up to three corrective patterns.
  • The correction is in its second corrective pattern, which is in wave C{-7}, its final wave.
  • The end of the present wave C{-7} could also be the end of the wave 2{-6} correction if the compound structure contains two subwaves.
  • Or the present corrective pattern could be followed by a declining connector, wave X{-7}, and then a third corrective pattern.
  • Wave 2{-6}, when complete, will be followed by a powerful downtrend, wave 3{-6}.
  • Under the rules of Elliott wave analysis, wave 2{-6} cannot move beyond the beginning of wave 1{-6}, which was the January 4, 2022 peak at 4953.25. (I’ve adjusted the January 4 peak.)

Reading the chart. Price movements — waves – – in Elliott wave analysis are labeled with numbers within trending waves and letters with corrective waves. The subscripts — numbers in curly brackets — designate the wave’s degree, which, in Elliott wave analysis, means the relative position of a wave within the larger and smaller structures that make up the chart. R.N. Elliott, who in the 1930s developed the form of analysis that bears his name, viewed the chart as a complex structure of smaller waves nested within larger waves, which in turn are nested within still larger waves. In mathematics it’s called a fractal structure, where at every scale the pattern is similar to the others.

We Are Here.

These are the waves currently in progress under my principal analysis. Each line on the list shows the wave number, with the subscript in curly brackets, the traditional degree name, the starting date, the starting price of the S&P 500 E-mini futures, and the direction of the wave.

  • S&P 500 Index:
  • 5{+3} Supercycle, 7/8/1932, 4.40 (up)
  • 5{+2} Cycle, 12/9/1974, 60.96 (up)
  • 5{+1} Primary, 3/6/2009, 666.79 (up)
  • 5{0} Intermediate, 12/26/2018, 2346.58 (up)
  • S&P 500 Futures and index:
  • 4{-1} Minor, 1/4/2022, 4953.25 (down) (futures), 4818.62 (down) (index)
  • S&P 500 Futures:
  • 1{-2} Minute, 1/4/2022, 4953.25 (down)
  • 1{-3} Minuette, 1/4/2022, 4953.25 (down)
  • 1{-4} Subminuette, 1/4/2022, 4953.25 (down)
  • 1{-5} Micro, 1/4/2022, 4953.25 (down)
  • 2{-6} Minuscule, 10/13/2022, 3577.75 (up)

Learning and other resources. Elliott wave analysis provides context, not prophecy. As the 20th century semanticist Alfred Korzybski put it in his book Science and Sanity (1933), “The map is not the territory … The only usefulness of a map depends on similarity of structure between the empirical world and the map.” And I would add, in the ever-changing markets, we can judge that similarity of structure only after the fact.

See the menu page Analytical Methods for a rundown on where to go for information on Elliott wave analysis.

By Tim Bovee, Portland, Oregon, June 30, 2023

Disclaimer

Tim Bovee, Private Trader tracks the analysis and trades of a private trader for his own accounts. Nothing in this blog constitutes a recommendation to buy or sell stocks, options or any other financial instrument. The only purpose of this blog is to provide education and entertainment.

No trader is ever 100 percent successful in his or her trades. Trading in the stock and option markets is risky and uncertain. Each trader must make trading decisions for his or her own account, and take responsibility for the consequences.

License
Creative Commons License

All content on Tim Bovee, Private Trader by Timothy K. Bovee is licensed under a Creative Commons Attribution-ShareAlike 4.0 International License.

Based on a work at www.timbovee.com.
Trader’s Notebook

3:30 p.m. New York time

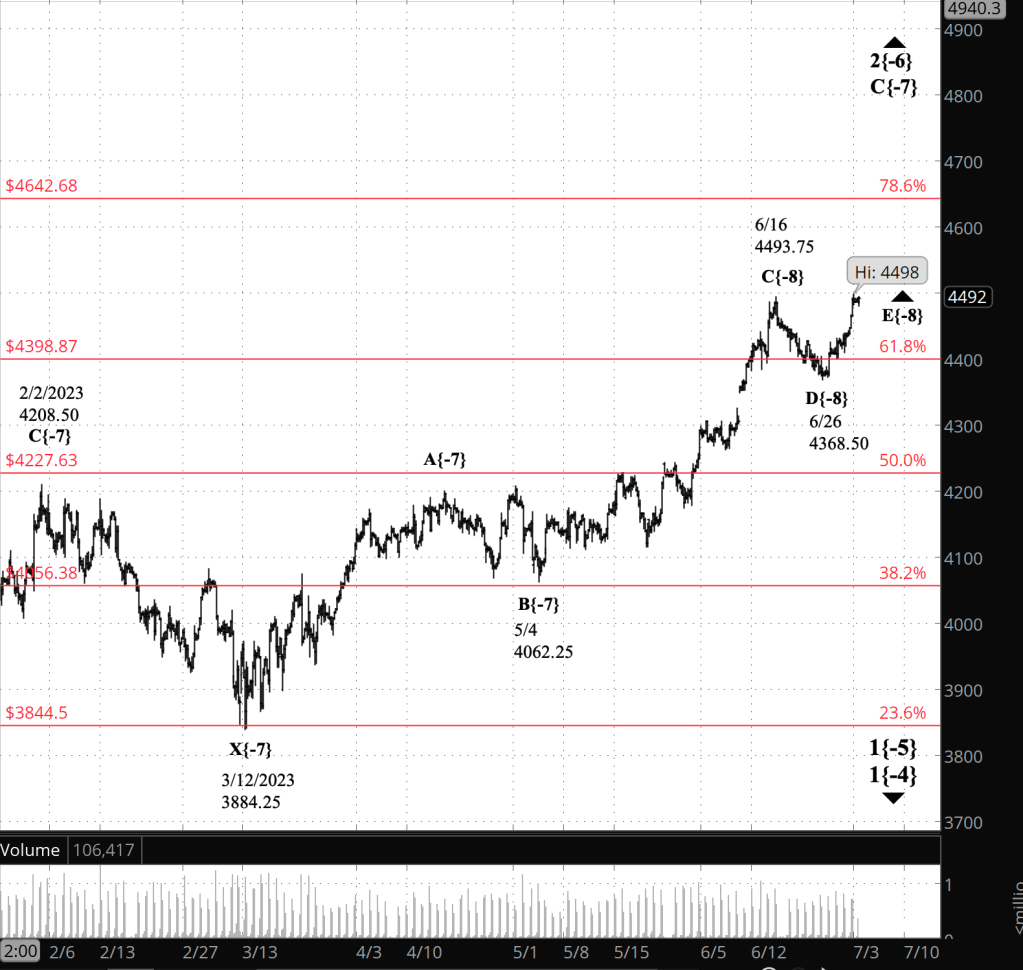
Half an hour before the closing bell. The S&P 500 futures kept to a narrow range during the session, going nowhere. No change in the analysis. I’ve updated the chart.

9:35 a.m. New York time

What’s happening now? The S&P 500 E-mini futures rose in overnight trading, reaching into the 4430s and then falling back below 4410 as the opening bell approached.

What does it mean? Given the complexity the structure at this point, I’m again using Elliott wave designations in this section to keep things clear.

The rise could be the beginning of the final subwave, wave E{-8}, within the final leg, wave C{-7}, of the second corrective pattern within a compound correction, wave 2{-6}, that began in October. From the form of the chart, it seems somewhat more likely to me that the rise is a subwave within declining wave D{-8}, the next-to-the-last subwave within the final leg of the upward correction. But, wave patterns don’t always present themselves with a great deal of clarity, so if the upward movement starts to show more energy, then I’ll be more likely to switch to the wave E{-8} scenario.

What are the alternatives? The ambiguity as to the relative degree of the correction continues. I’ve marked it as {-6} — Minuscule Degree in traditional Elliott wave terminology — but it could be larger.

Reading the chart. Price movements — waves – – in Elliott wave analysis are labeled with numbers within trending waves and letters with corrective waves. The subscripts — numbers in curly brackets — designate the wave’s degree, which, in Elliott wave analysis, means the relative position of a wave within the larger and smaller structures that make up the chart. R.N. Elliott, who in the 1930s developed the form of analysis that bears his name, viewed the chart as a complex structure of smaller waves nested within larger waves, which in turn are nested within still larger waves. In mathematics it’s called a fractal structure, where at every scale the pattern is similar to the others.

[S&P 500 E-mini futures at 3:30 p.m., 4-hour bars, with volume]

What does Elliott wave theory say? Here are the waves that underly the analysis.

  • An upward correction, a Zigzag, wave 2{-6}, began on October 13, 2022 and is underway.
  • The upward correction, wave 2{-6}, is taking a compound form, which can contain up to three corrective patterns.
  • The correction is in its second corrective pattern, which is in wave C{-7}, its final wave.
  • The end of the present wave C{-7} could also be the end of the wave 2{-6} correction if the compound structure contains two subwaves.
  • Or the present corrective pattern could be followed by a declining connector, wave X{-7}, and then a third corrective pattern.
  • Wave 2{-6}, when complete, will be followed by a powerful downtrend, wave 3{-6}.
  • Under the rules of Elliott wave analysis, wave 2{-6} cannot move beyond the beginning of wave 1{-6}, which was the January 4, 2022 peak at 4953.25. (I’ve adjusted the January 4 peak.)

We Are Here.

These are the waves currently in progress under my principal analysis. Each line on the list shows the wave number, with the subscript in curly brackets, the traditional degree name, the starting date, the starting price of the S&P 500 E-mini futures, and the direction of the wave.

  • S&P 500 Index:
  • 5{+3} Supercycle, 7/8/1932, 4.40 (up)
  • 5{+2} Cycle, 12/9/1974, 60.96 (up)
  • 5{+1} Primary, 3/6/2009, 666.79 (up)
  • 5{0} Intermediate, 12/26/2018, 2346.58 (up)
  • S&P 500 Futures and index:
  • 4{-1} Minor, 1/4/2022, 4953.25 (down) (futures), 4818.62 (down) (index)
  • S&P 500 Futures:
  • 1{-2} Minute, 1/4/2022, 4953.25 (down)
  • 1{-3} Minuette, 1/4/2022, 4953.25 (down)
  • 1{-4} Subminuette, 1/4/2022, 4953.25 (down)
  • 1{-5} Micro, 1/4/2022, 4953.25 (down)
  • 2{-6} Minuscule, 10/13/2022, 3577.75 (up)

Learning and other resources. Elliott wave analysis provides context, not prophecy. As the 20th century semanticist Alfred Korzybski put it in his book Science and Sanity (1933), “The map is not the territory … The only usefulness of a map depends on similarity of structure between the empirical world and the map.” And I would add, in the ever-changing markets, we can judge that similarity of structure only after the fact.

See the menu page Analytical Methods for a rundown on where to go for information on Elliott wave analysis.

By Tim Bovee, Portland, Oregon, June 29, 2023

Disclaimer

Tim Bovee, Private Trader tracks the analysis and trades of a private trader for his own accounts. Nothing in this blog constitutes a recommendation to buy or sell stocks, options or any other financial instrument. The only purpose of this blog is to provide education and entertainment.

No trader is ever 100 percent successful in his or her trades. Trading in the stock and option markets is risky and uncertain. Each trader must make trading decisions for his or her own account, and take responsibility for the consequences.

License
Creative Commons License

All content on Tim Bovee, Private Trader by Timothy K. Bovee is licensed under a Creative Commons Attribution-ShareAlike 4.0 International License.

Based on a work at www.timbovee.com.
Trader’s Notebook

3:30 p.m. New York time

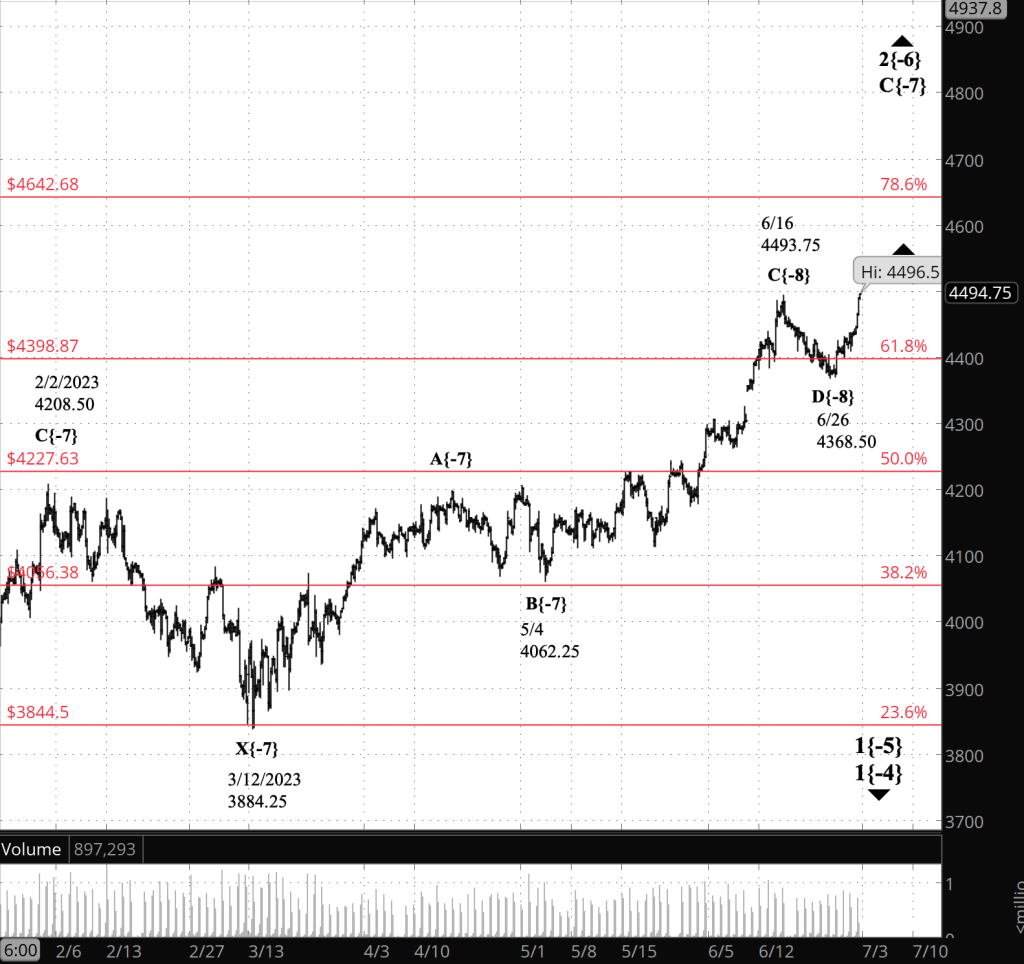
Half an hour before the closing bell. The S&P 500 futures hit a high in the 4430s during the session and then dropped back. No change in this morning’s analysis. I’ve updated the chart.

9:35 a.m. New York time

What’s happening now? The S&P 500 E-mini futures rose to the 4016.75 in overnight trading and then fell to 4401.25 at the opening bell, slightly above the 61.8% Fibonacci retracement level.

What does it mean? The analysis by necessity must deal with three levels of waves, and I’ve used the Elliott wave numbers for greater clarity.

The upward compound correction, wave 2{-6} that began last October is in the final leg, wave C{-7}, of its second corrective pattern, which internally is … ambiguous. In yesterday’s analysis I described two possibilities: Either Monday’s low, 4385.75, was the end of wave D{-8}, the next-to-the-last subwave within the final leg second corrective pattern and the final wave, E{-8}, has begun. Or that low was just a small drop within wave D{-8}.

The overnight go-nowhere chart does nothing to remove the ambiguity. Generally, I like to have some evidence before declaring one wave to be complete and the next to have begun. Lacking such evidence, I’m sticking with the scenario that began June 16: Wave D{-8} is underway.

What are the alternatives? Also unchanged. The ambiguity as to the relative degree of the correction continues. I’ve marked it as {-6} — Minuscule Degree in traditional Elliott wave terminology — but it could be larger.

[S&P 500 E-mini futures at 3:30 p.m., 4-hour bars, with volume]

What does Elliott wave theory say? Here are the waves that underly the analysis.

  • An upward correction, a Zigzag, wave 2{-6}, began on October 13, 2022 and is underway.
  • The upward correction, wave 2{-6}, is taking a compound form, which can contain up to three corrective patterns.
  • The correction is in its second corrective pattern, which is in wave C{-7}, its final wave.
  • The end of the present wave C{-7} could also be the end of the wave 2{-6} correction if the compound structure contains two subwaves.
  • Or the present corrective pattern could be followed by a declining connector, wave X{-7}, and then a third corrective pattern.
  • Wave 2{-6}, when complete, will be followed by a powerful downtrend, wave 3{-6}.
  • Under the rules of Elliott wave analysis, wave 2{-6} cannot move beyond the beginning of wave 1{-6}, which was the January 4, 2022 peak at 4953.25. (I’ve adjusted the January 4 peak.)

Reading the chart. Price movements — waves – – in Elliott wave analysis are labeled with numbers within trending waves and letters with corrective waves. The subscripts — numbers in curly brackets — designate the wave’s degree, which, in Elliott wave analysis, means the relative position of a wave within the larger and smaller structures that make up the chart. R.N. Elliott, who in the 1930s developed the form of analysis that bears his name, viewed the chart as a complex structure of smaller waves nested within larger waves, which in turn are nested within still larger waves. In mathematics it’s called a fractal structure, where at every scale the pattern is similar to the others.

We Are Here.

These are the waves currently in progress under my principal analysis. Each line on the list shows the wave number, with the subscript in curly brackets, the traditional degree name, the starting date, the starting price of the S&P 500 E-mini futures, and the direction of the wave.

  • S&P 500 Index:
  • 5{+3} Supercycle, 7/8/1932, 4.40 (up)
  • 5{+2} Cycle, 12/9/1974, 60.96 (up)
  • 5{+1} Primary, 3/6/2009, 666.79 (up)
  • 5{0} Intermediate, 12/26/2018, 2346.58 (up)
  • S&P 500 Futures and index:
  • 4{-1} Minor, 1/4/2022, 4953.25 (down) (futures), 4818.62 (down) (index)
  • S&P 500 Futures:
  • 1{-2} Minute, 1/4/2022, 4953.25 (down)
  • 1{-3} Minuette, 1/4/2022, 4953.25 (down)
  • 1{-4} Subminuette, 1/4/2022, 4953.25 (down)
  • 1{-5} Micro, 1/4/2022, 4953.25 (down)
  • 2{-6} Minuscule, 10/13/2022, 3577.75 (up)

Learning and other resources. Elliott wave analysis provides context, not prophecy. As the 20th century semanticist Alfred Korzybski put it in his book Science and Sanity (1933), “The map is not the territory … The only usefulness of a map depends on similarity of structure between the empirical world and the map.” And I would add, in the ever-changing markets, we can judge that similarity of structure only after the fact.

See the menu page Analytical Methods for a rundown on where to go for information on Elliott wave analysis.

By Tim Bovee, Portland, Oregon, June 28, 2023

Disclaimer

Tim Bovee, Private Trader tracks the analysis and trades of a private trader for his own accounts. Nothing in this blog constitutes a recommendation to buy or sell stocks, options or any other financial instrument. The only purpose of this blog is to provide education and entertainment.

No trader is ever 100 percent successful in his or her trades. Trading in the stock and option markets is risky and uncertain. Each trader must make trading decisions for his or her own account, and take responsibility for the consequences.

License
Creative Commons License

All content on Tim Bovee, Private Trader by Timothy K. Bovee is licensed under a Creative Commons Attribution-ShareAlike 4.0 International License.

Based on a work at www.timbovee.com.