Trader’s Notebook

3:30 p.m. New York time

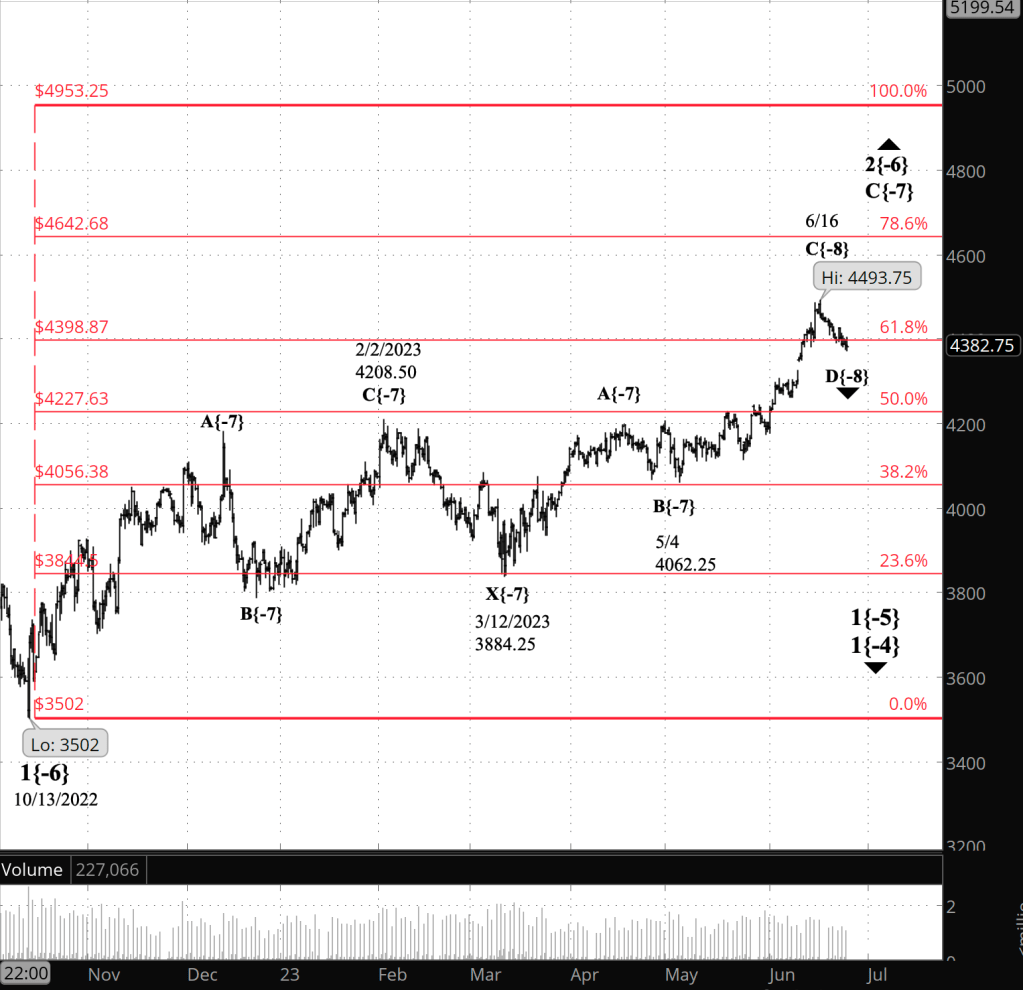
Half an hour before the closing bell. The S&P 500 futures rose into the 4420s during the session, once again breaking above the 61.8% Fibonacci retracement level. It’s possible that the reversal marks the end of the 4th subwave, wave D{-8}, within the final leg, wave C{-7}, of the corrective pattern that began on March 12, the second such pattern within an upward correction, wave 2{-6}, that began in mid-October. Or it could be a subwave within that 4th subwave.

I’m staying with this morning’s analysis which sees that 4th subwave as still being underway. A sufficient continuation of the rise, into the 4490s and higher, would be a sign that the 5th and final subwave has begun. I’ve updated the chart.

9:35 a.m. New York time

What’s happening now? The S&P 500 E-mini futures continued to fall overnight, reaching into the low 4370s and then pulling up sllightly

What does it mean? The final subwave within the second corrective pattern of a compound correction that began on October 13, 2022 continues and is now in the fourth of five subwaves. When corrective pattern is complete, it will be followed either by a declining connector wave and a third corrective pattern, or by a powerful downtrend, a sign that the upward correction has ended at the second corrective pattern.

What are the alternatives? As is common, there is some ambiguity as to the relative degree of the correction. I’ve marked it as {-6} — Minuscule Degree in traditional Elliott wave terminology — but it could be larger.

Reading the chart. I’ve focused the chart on the second corrective pattern within the upward correction, which is a 2nd wave. The Fibonacci retracement ladder, in red, shows the correction’s retracement of the preceding downtrending wave, a 1st wave.

Price movements — waves – – in Elliott wave analysis are labeled with numbers within trending waves and letters with corrective waves. The subscripts — numbers in curly brackets — designate the wave’s degree, which, in Elliott wave analysis, means the relative position of a wave within the larger and smaller structures that make up the chart. R.N. Elliott, who in the 1930s developed the form of analysis that bears his name, viewed the chart as a complex structure of smaller waves nested within larger waves, which in turn are nested within still larger waves. In mathematics it’s called a fractal structure, where at every scale the pattern is similar to the others.

[S&P 500 E-mini futures at 3:30 p.m., 4-hour bars, with volume]

What does Elliott wave theory say? Here are the waves that underly the analysis.

  • An upward correction, a Zigzag, wave 2{-6}, began on October 13, 2022 and is underway.
  • The upward correction, wave 2{-6}, is taking a compound form, which can contain up to three corrective patterns.
  • The correction is in its second corrective pattern, which is in wave C{-7}, its final wave.
  • The end of the present wave C{-7} could also be the end of the wave 2{-6} correction if the compound structure contains two subwaves.
  • Or the present corrective pattern could be followed by a declining connector, wave X{-7}, and then a third corrective pattern.
  • Wave 2{-6}, when complete, will be followed by a powerful downtrend, wave 3{-6}.
  • Under the rules of Elliott wave analysis, wave 2{-6} cannot move beyond the beginning of wave 1{-6}, which was the January 4, 2022 peak at 4953.25. (I’ve adjusted the January 4 peak.)

We Are Here.

These are the waves currently in progress under my principal analysis. Each line on the list shows the wave number, with the subscript in curly brackets, the traditional degree name, the starting date, the starting price of the S&P 500 E-mini futures, and the direction of the wave.

  • S&P 500 Index:
  • 5{+3} Supercycle, 7/8/1932, 4.40 (up)
  • 5{+2} Cycle, 12/9/1974, 60.96 (up)
  • 5{+1} Primary, 3/6/2009, 666.79 (up)
  • 5{0} Intermediate, 12/26/2018, 2346.58 (up)
  • S&P 500 Futures and index:
  • 4{-1} Minor, 1/4/2022, 4953.25 (down) (futures), 4818.62 (down) (index)
  • S&P 500 Futures:
  • 1{-2} Minute, 1/4/2022, 4953.25 (down)
  • 1{-3} Minuette, 1/4/2022, 4953.25 (down)
  • 1{-4} Subminuette, 1/4/2022, 4953.25 (down)
  • 1{-5} Micro, 1/4/2022, 4953.25 (down)
  • 2{-6} Minuscule, 10/13/2022, 3577.75 (up)

Learning and other resources. Elliott wave analysis provides context, not prophecy. As the 20th century semanticist Alfred Korzybski put it in his book Science and Sanity (1933), “The map is not the territory … The only usefulness of a map depends on similarity of structure between the empirical world and the map.” And I would add, in the ever-changing markets, we can judge that similarity of structure only after the fact.

See the menu page Analytical Methods for a rundown on where to go for information on Elliott wave analysis.

By Tim Bovee, Portland, Oregon, June 27, 2023

Disclaimer

Tim Bovee, Private Trader tracks the analysis and trades of a private trader for his own accounts. Nothing in this blog constitutes a recommendation to buy or sell stocks, options or any other financial instrument. The only purpose of this blog is to provide education and entertainment.

No trader is ever 100 percent successful in his or her trades. Trading in the stock and option markets is risky and uncertain. Each trader must make trading decisions for his or her own account, and take responsibility for the consequences.

License
Creative Commons License

All content on Tim Bovee, Private Trader by Timothy K. Bovee is licensed under a Creative Commons Attribution-ShareAlike 4.0 International License.

Based on a work at www.timbovee.com.
Trader’s Notebook

3:30 p.m. New York time

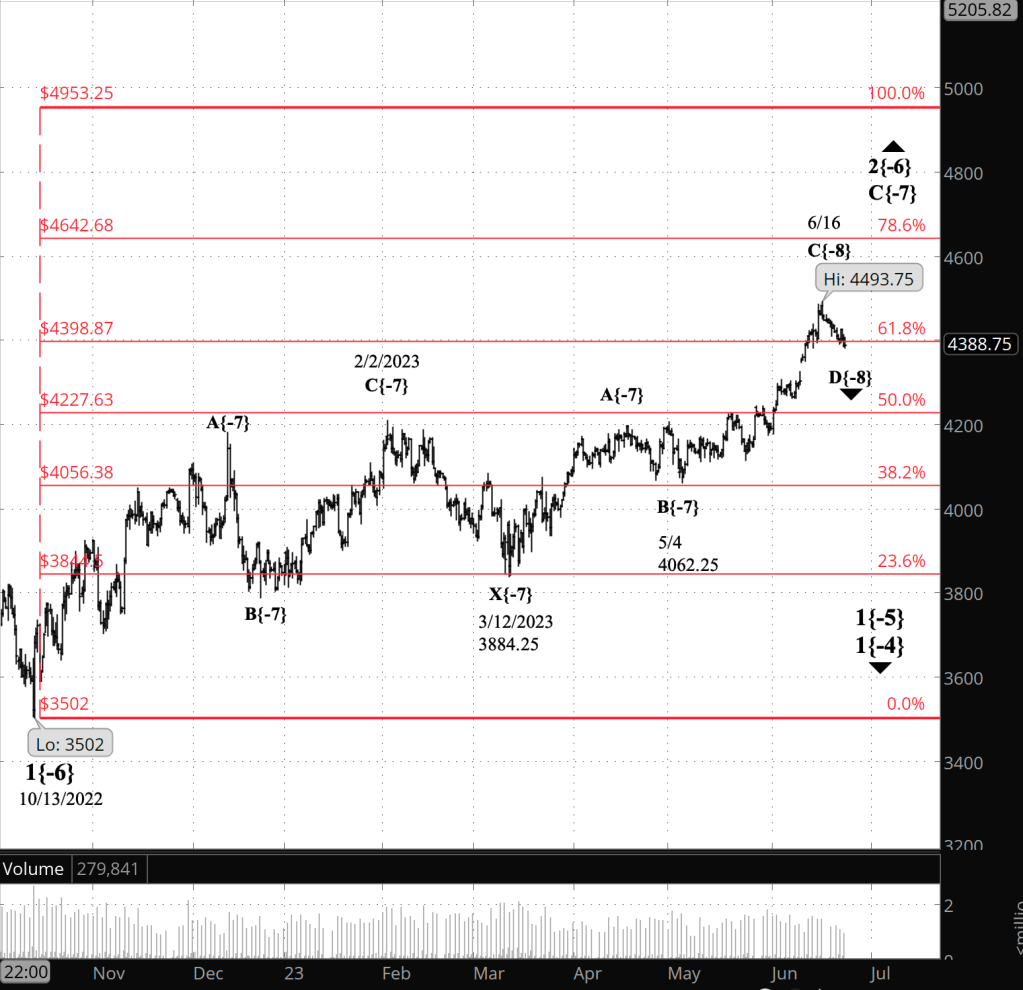
Half an hour before the closing bell. The S&P 500 futures rose to 4403 in the early hours of the session and then retreated back to the 4370s, trading in a narrow range thereafter, so far. No change in this morning’s analysis. I’ve updated the chart.

9:35 a.m. New York time

What’s happening now? The S&P 500 E-mini futures worked its way lower into the 4370s after trading resumed overnight,

What does it mean? The upward correction that began in mid-October continues and has taken a compound form. It is presently in the final wave of the second corrective pattern, which may be the final pattern. Or, possibly, there could be one more corrective pattern.

That final wave within the second pattern is in the fourth of five subwaves. When complete, that fourth subwave will be followed by a fifth and final wave that will most likely rise above the correction’s previous high, 4493.75, attained on June 16.

What happens after the second corrective pattern is complete? There will be a decline, that will fill one or the other of two very different roles in the Elliott wave structure.

If the compound correction will have two corrective patterns, then the end of the present pattern will also be the end do the correction, and the decline will be a powerful downtrend that will carry the price well below the correction’s starting point, 3502.

If the compound correction will have three corrective patterns, then the downward movement will be a connecting wave that will be followed by the third and final corrective pattern. The connecting wave will be relatively shallow — the first connecting wave within this correction covered only 324 points. The third corrective pattern, when complete, will also be the end of the compound correction, and the powerful downtrend will begin.

Timing: The first corrective pattern took about 3-1/2 months to complete. The second pattern has been underway for almost 3-1/2 months and still has further to go. The prior corrective pattern’s connector wave took a month and a half to complete. So a third corrective pattern, along with the connector wave, could possibly add five months to the lifespan of the correction, bringing it to the end of the year. If the present second corrective pattern completes the correction, then it could be over before autumn begins in the Northern Hemisphere.

However, some waves move fast, others move slow, and past time spans aren’t necessarily accurate indicators of future timespans.

What are the alternatives? I’ve labeled the correction as being of the {-6} degree. Degree labelling is notoriously prone to re-interpretation. It could turn out to be of a larger degree.

[S&P 500 E-mini futures at 3:30 p.m., 8-hour bars, with volume]

Reading the chart. Price movements — waves – – in Elliott wave analysis are labeled with numbers within trending waves and letters with corrective waves. The subscripts — numbers in curly brackets — designate the wave’s degree, which, in Elliott wave analysis, means the relative position of a wave within the larger and smaller structures that make up the chart. R.N. Elliott, who in the 1930s developed the form of analysis that bears his name, viewed the chart as a complex structure of smaller waves nested within larger waves, which in turn are nested within still larger waves. In mathematics it’s called a fractal structure, where at every scale the pattern is similar to the others.

What does Elliott wave theory say? Here are the waves that underly the analysis.

  • An upward correction, a Zigzag, wave 2{-6}, began on October 13, 2022 and is underway.
  • The upward correction, wave 2{-6}, is taking a compound form, which can contain up to three corrective patterns.
  • The correction is in its second corrective pattern, which is in wave C{-7}, its final wave.
  • The end of the present wave C{-7} could also be the end of the wave 2{-6} correction if the compound structure contains two subwaves.
  • Or the present corrective pattern could be followed by a declining connector, wave X{-7}, and then a third corrective pattern.
  • Wave 2{-6}, when complete, will be followed by a powerful downtrend, wave 3{-6}.
  • Under the rules of Elliott wave analysis, wave 2{-6} cannot move beyond the beginning of wave 1{-6}, which was the January 4, 2022 peak at 4953.25. (I’ve adjusted the January 4 peak.)

We Are Here.

These are the waves currently in progress under my principal analysis. Each line on the list shows the wave number, with the subscript in curly brackets, the traditional degree name, the starting date, the starting price of the S&P 500 E-mini futures, and the direction of the wave.

  • S&P 500 Index:
  • 5{+3} Supercycle, 7/8/1932, 4.40 (up)
  • 5{+2} Cycle, 12/9/1974, 60.96 (up)
  • 5{+1} Primary, 3/6/2009, 666.79 (up)
  • 5{0} Intermediate, 12/26/2018, 2346.58 (up)
  • S&P 500 Futures and index:
  • 4{-1} Minor, 1/4/2022, 4953.25 (down) (futures), 4818.62 (down) (index)
  • S&P 500 Futures:
  • 1{-2} Minute, 1/4/2022, 4953.25 (down)
  • 1{-3} Minuette, 1/4/2022, 4953.25 (down)
  • 1{-4} Subminuette, 1/4/2022, 4953.25 (down)
  • 1{-5} Micro, 1/4/2022, 4953.25 (down)
  • 2{-6} Minuscule, 10/13/2022, 3577.75 (up)

Learning and other resources. Elliott wave analysis provides context, not prophecy. As the 20th century semanticist Alfred Korzybski put it in his book Science and Sanity (1933), “The map is not the territory … The only usefulness of a map depends on similarity of structure between the empirical world and the map.” And I would add, in the ever-changing markets, we can judge that similarity of structure only after the fact.

See the menu page Analytical Methods for a rundown on where to go for information on Elliott wave analysis.

By Tim Bovee, Portland, Oregon, June 26, 2023

Disclaimer

Tim Bovee, Private Trader tracks the analysis and trades of a private trader for his own accounts. Nothing in this blog constitutes a recommendation to buy or sell stocks, options or any other financial instrument. The only purpose of this blog is to provide education and entertainment.

No trader is ever 100 percent successful in his or her trades. Trading in the stock and option markets is risky and uncertain. Each trader must make trading decisions for his or her own account, and take responsibility for the consequences.

License
Creative Commons License

All content on Tim Bovee, Private Trader by Timothy K. Bovee is licensed under a Creative Commons Attribution-ShareAlike 4.0 International License.

Based on a work at www.timbovee.com.
Trader’s Notebook

3:30 p.m. New York time

Half an hour before the closing bell. The S&P 500 fell in latter half of the session, reaching the low 4380s. This morning’s analysis is unchanged. I’ve updated the chart.

9:35 a.m. New York time

What’s happening now? The S&P 500 E-mini futures drifted back below the 61.8% Fibonacci retracement level in overnight trading, reaching into the 4380s.

What does it mean? The upward correction that began on October 13, 2022 continues and may be nearing its end. It is in the next-to-the-last subwave within the corrective pattern’s third and final wave.

The correction has formed a compound pattern and is nearing the end of its second corrective pattern, which will be followed by either the beginning of a powerful downtrend or a much shorter downward wave that will connect the second pattern with a third.

What are the alternatives? I’ve labeled the correction as being of the {-6} degree. It could be of a larger degree.

[S&P 500 E-mini futures at 3:30 p.m., 8-hour bars, with volume]

Reading the chart. Price movements — waves – – in Elliott wave analysis are labeled with numbers within trending waves and letters with corrective waves. The subscripts — numbers in curly brackets — designate the wave’s degree, which, in Elliott wave analysis, means the relative position of a wave within the larger and smaller structures that make up the chart. R.N. Elliott, who in the 1930s developed the form of analysis that bears his name, viewed the chart as a complex structure of smaller waves nested within larger waves, which in turn are nested within still larger waves. In mathematics it’s called a fractal structure, where at every scale the pattern is similar to the others.

What does Elliott wave theory say? Here are the waves that underly the analysis.

  • An upward correction, a Zigzag, wave 2{-6}, began on October 13, 2022 and is underway.
  • The upward correction, wave 2{-6}, is taking a compound form, which can contain up to three corrective patterns.
  • The correction is in its second corrective pattern, which is in wave C{-7}, its final wave.
  • The end of the present wave C{-7} could also be the end of the wave 2{-6} correction if the compound structure contains two subwaves.
  • Or the present corrective pattern could be followed by a declining connector, wave X{-7}, and then a third corrective pattern.
  • Wave 2{-6}, when complete, will be followed by a powerful downtrend, wave 3{-6}.
  • Under the rules of Elliott wave analysis, wave 2{-6} cannot move beyond the beginning of wave 1{-6}, which was the January 4, 2022 peak at 4953.25. (I’ve adjusted the January 4 peak.)

We Are Here.

These are the waves currently in progress under my principal analysis. Each line on the list shows the wave number, with the subscript in curly brackets, the traditional degree name, the starting date, the starting price of the S&P 500 E-mini futures, and the direction of the wave.

  • S&P 500 Index:
  • 5{+3} Supercycle, 7/8/1932, 4.40 (up)
  • 5{+2} Cycle, 12/9/1974, 60.96 (up)
  • 5{+1} Primary, 3/6/2009, 666.79 (up)
  • 5{0} Intermediate, 12/26/2018, 2346.58 (up)
  • S&P 500 Futures and index:
  • 4{-1} Minor, 1/4/2022, 4953.25 (down) (futures), 4818.62 (down) (index)
  • S&P 500 Futures:
  • 1{-2} Minute, 1/4/2022, 4953.25 (down)
  • 1{-3} Minuette, 1/4/2022, 4953.25 (down)
  • 1{-4} Subminuette, 1/4/2022, 4953.25 (down)
  • 1{-5} Micro, 1/4/2022, 4953.25 (down)
  • 2{-6} Minuscule, 10/13/2022, 3577.75 (up)

Learning and other resources. Elliott wave analysis provides context, not prophecy. As the 20th century semanticist Alfred Korzybski put it in his book Science and Sanity (1933), “The map is not the territory … The only usefulness of a map depends on similarity of structure between the empirical world and the map.” And I would add, in the ever-changing markets, we can judge that similarity of structure only after the fact.

See the menu page Analytical Methods for a rundown on where to go for information on Elliott wave analysis.

By Tim Bovee, Portland, Oregon, June 23, 2023

Disclaimer

Tim Bovee, Private Trader tracks the analysis and trades of a private trader for his own accounts. Nothing in this blog constitutes a recommendation to buy or sell stocks, options or any other financial instrument. The only purpose of this blog is to provide education and entertainment.

No trader is ever 100 percent successful in his or her trades. Trading in the stock and option markets is risky and uncertain. Each trader must make trading decisions for his or her own account, and take responsibility for the consequences.

License
Creative Commons License

All content on Tim Bovee, Private Trader by Timothy K. Bovee is licensed under a Creative Commons Attribution-ShareAlike 4.0 International License.

Based on a work at www.timbovee.com.

Trader’s Notebook

3:30 p.m. New York time

Half an hour before the closing bell. The S&P 500 futures, having fallen overnight, bounced during the session, reaching into the 4420s. The bounce wasn’t large enough to warrant changing this morning’s analysis, which sees the a small downward correction underway within the larger upward correction. I’ve updated the chart.

9:35 a.m. New York time

What’s happening now? The S&P 500 E-mini futures declined overnight to the 4390s, moving below the 61.8% Fibonacci retracement level for the first time since June 14. The high point in the rise that began in October was 4493.75, set on June 16.

What does it mean? The rise that began on October 13, 2022 is an upward correction. The 61.8% Fibonacci level is a common reversal point, or bounce point. If the price doesn’t bounce, then it’s an indicator that the trend may have changed.

If the price continues downward, then the likelihood increases that the June 16 peak ended a subwave in what may be the final wave of the correction, which is a 2nd wave. I’ve marked the chart to reflect this scenario.

I’ve also resolved the ambiguity in the correction analysis that has complicated the chart for a week. There were two alternatives, of equal likelihood: A simple correction in its first subwave (the A-wave scenario), and a compound correction in the final subwave of its second corrective pattern (the C-wave scenario).

After checking the time consumed by prior 2nd waves, I’ve settled on the compound correction C-wave scenario, and have marked the chart accordingly.

What are the alternatives? It’s possible that the peak so far isn’t the end of the final wave within the second corrective pattern. A rapid reversal to the upside will lend credence to this scenario.

A second alternative is that the degree assigned to the 2nd wave, wave 2{-6}, is too low. I’ll be looking at that issue over the weekend.

What happens next? A compound correction can contain three corrective patterns. The present second corrective pattern, when complete, could be the end of the correction and the beginning of a powerful 3rd wave downtrend. Or it could be that the correction will add a third corrective pattern, connected to the second pattern by a declining X wave that likely will remain above the start of the second pattern, 3884.25.

[S&P 500 E-mini futures at 3:30 p.m., 8-hour bars, with volume]

Reading the chart. Price movements — waves – – in Elliott wave analysis are labeled with numbers within trending waves and letters with corrective waves. The subscripts — numbers in curly brackets — designate the wave’s degree, which, in Elliott wave analysis, means the relative position of a wave within the larger and smaller structures that make up the chart. R.N. Elliott, who in the 1930s developed the form of analysis that bears his name, viewed the chart as a complex structure of smaller waves nested within larger waves, which in turn are nested within still larger waves. In mathematics it’s called a fractal structure, where at every scale the pattern is similar to the others.

What does Elliott wave theory say? Here are the waves that underly the analysis.

  • An upward correction, a Zigzag, wave 2{-6}, began on October 13, 2022 and is underway.
  • The upward correction, wave 2{-6}, is taking a compound form, which can contain up to three corrective patterns.
  • The correction is in its second corrective pattern, which is in wave C{-7}, its final wave.
  • The end of the present wave C{-7} could also be the end of the wave 2{-6} correction if the compound structure contains two subwaves.
  • Or the present corrective pattern could be followed by a declining connector, wave X{-7}, and then a third corrective pattern.
  • Wave 2{-6}, when complete, will be followed by a powerful downtrend, wave 3{-6}.
  • Under the rules of Elliott wave analysis, wave 2{-6} cannot move beyond the beginning of wave 1{-6}, which was the January 4, 2022 peak at 4953.25. (I’ve adjusted the January 4 peak.)

We Are Here.

These are the waves currently in progress under my principal analysis. Each line on the list shows the wave number, with the subscript in curly brackets, the traditional degree name, the starting date, the starting price of the S&P 500 E-mini futures, and the direction of the wave.

  • S&P 500 Index:
  • 5{+3} Supercycle, 7/8/1932, 4.40 (up)
  • 5{+2} Cycle, 12/9/1974, 60.96 (up)
  • 5{+1} Primary, 3/6/2009, 666.79 (up)
  • 5{0} Intermediate, 12/26/2018, 2346.58 (up)
  • S&P 500 Futures and index:
  • 4{-1} Minor, 1/4/2022, 4953.25 (down) (futures), 4818.62 (down) (index)
  • S&P 500 Futures:
  • 1{-2} Minute, 1/4/2022, 4953.25 (down)
  • 1{-3} Minuette, 1/4/2022, 4953.25 (down)
  • 1{-4} Subminuette, 1/4/2022, 4953.25 (down)
  • 1{-5} Micro, 1/4/2022, 4953.25 (down)
  • 2{-6} Minuscule, 10/13/2022, 3577.75 (up)

Learning and other resources. Elliott wave analysis provides context, not prophecy. As the 20th century semanticist Alfred Korzybski put it in his book Science and Sanity (1933), “The map is not the territory … The only usefulness of a map depends on similarity of structure between the empirical world and the map.” And I would add, in the ever-changing markets, we can judge that similarity of structure only after the fact.

See the menu page Analytical Methods for a rundown on where to go for information on Elliott wave analysis.

By Tim Bovee, Portland, Oregon, June 22, 2023

Disclaimer

Tim Bovee, Private Trader tracks the analysis and trades of a private trader for his own accounts. Nothing in this blog constitutes a recommendation to buy or sell stocks, options or any other financial instrument. The only purpose of this blog is to provide education and entertainment.

No trader is ever 100 percent successful in his or her trades. Trading in the stock and option markets is risky and uncertain. Each trader must make trading decisions for his or her own account, and take responsibility for the consequences.

License
Creative Commons License

All content on Tim Bovee, Private Trader by Timothy K. Bovee is licensed under a Creative Commons Attribution-ShareAlike 4.0 International License.

Based on a work at www.timbovee.com.

Trader’s Notebook

3:30 p.m. New York time

Half an hour before the closing bell. The S&P 500 futures has reached a low during the session of 4403.50, just a few dollars above the 61.8% Fibonacci retracement level, and then rose back into the 4430s. The indicator continues to go nowhere. This morning’s analysis stands unchanged. I’ve updated the chart.

9:35 a.m. New York time

What’s happening now? The S&P 500 E-mini futures fell overnight into the 4110s as an upward correction that began on October 13, 2022 continues.

What does it mean? The present rise began on May 4 from 4062.25. The S&P 500 has been limited to small movements since the recent correction peak, 4493.75, on June 16. The correction is a 2nd wave, and under the rules of Elliott wave analysis, the highest the correction’s price can rise is the starting point of the preceding 1st wave, 4953.25.

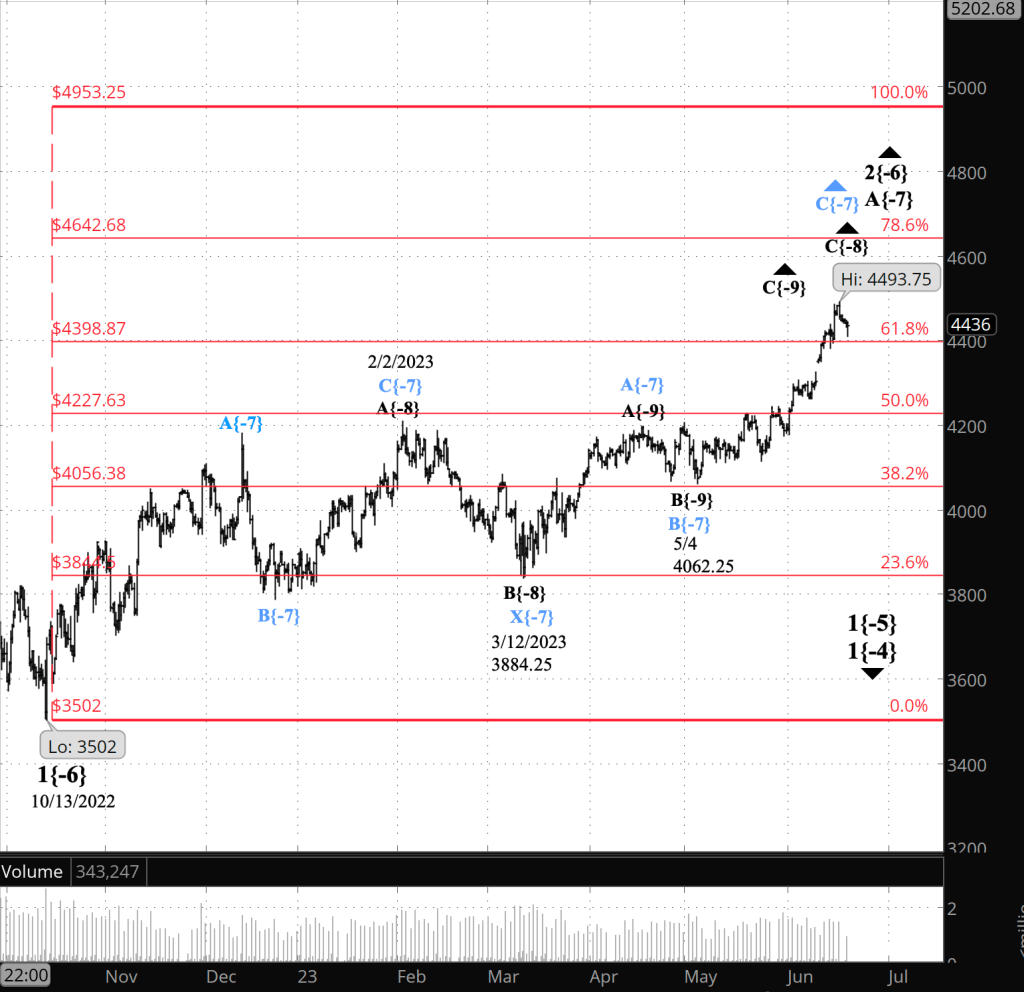
What are the choices? I’ve found two principal analyses of chart, both equally likely. One analysis is labeled on the chart in black and referred to as the Black Analysis. The other is labeled in blue and referred to as the Blue Analysis.

Black Analysis, A-wave scenario: The wave labels on the chart in black show a simple correction, with the first subwave, wave A{-7}, within the upward correction, wave 2{-6}, still underway and nearing its end.

Blue Analysis, C-wave scenario: The blue wave labels show the correction having taken a compound form. Compound corrections can contain up to three corrective patterns. The first pattern ended on February 2. The second pattern is now nearing completion. The end of the second pattern could be the end of the upward correction and the beginning of a powerful downtrend, or it could be followed by a relatively shallow declining connection wave, called an X-wave, and then a third corrective pattern.

[S&P 500 E-mini futures at 3:30 p.m., 8-hour bars, with volume]

Reading the chart. Price movements — waves – – in Elliott wave analysis are labeled with numbers within trending waves and letters with corrective waves. The subscripts — numbers in curly brackets — designate the wave’s degree, which, in Elliott wave analysis, means the relative position of a wave within the larger and smaller structures that make up the chart. R.N. Elliott, who in the 1930s developed the form of analysis that bears his name, viewed the chart as a complex structure of smaller waves nested within larger waves, which in turn are nested within still larger waves. In mathematics it’s called a fractal structure, where at every scale the pattern is similar to the others.

What does Elliott wave theory say? Here are the waves that underly the analyses.

Black Analysis, simple correction (black labeling on the chart):

  • An upward correction, a Zigzag, wave 2{-6}, began on October 13, 2022 and is underway.
  • The correction’s first subwave, wave A{-7}, is underway and will have five subwaves.
  • Wave A{-7} at present is in its 3rd subwave, wave C{-8}.
  • Wave C{-8} is in its 3rd subwave, wave C{-9}.
  • Wave 2{-6}, when complete, will be followed by a powerful downtrend, wave 3{-6}.
  • Under the rules of Elliott wave analysis, wave 2{-6} cannot move beyond the beginning of wave 1{-6}, which was the January 4, 2022 peak at 4953.25. (I’ve adjusted the January 4 peak.)

Blue Analysis, compound correction (blue labeling on the chart):

  • The upward correction, wave 2{-6}, is taking a compound form, which can contain up to three corrective patterns.
  • The correction is in its second corrective pattern, which is in wave C{-7}, its final wave.

Future Alternatives, an additional corrective pattern or the end of the correction?

  • In either scenario, wave C{-7}, when complete, will either be followed by a separator wave, X{-7}, and then an additional corrective pattern, or will be the end of the wave 2{-6} correction and will be followed by a powerful downtrend, wave 3{-6}.
  • Compound corrections can contain no more than three corrective patterns.

We Are Here.

These are the waves currently in progress under my principal analysis. Each line on the list shows the wave number, with the subscript in curly brackets, the traditional degree name, the starting date, the starting price of the S&P 500 E-mini futures, and the direction of the wave.

  • S&P 500 Index:
  • 5{+3} Supercycle, 7/8/1932, 4.40 (up)
  • 5{+2} Cycle, 12/9/1974, 60.96 (up)
  • 5{+1} Primary, 3/6/2009, 666.79 (up)
  • 5{0} Intermediate, 12/26/2018, 2346.58 (up)
  • S&P 500 Futures and index:
  • 4{-1} Minor, 1/4/2022, 4953.25 (down) (futures), 4818.62 (down) (index)
  • S&P 500 Futures:
  • 1{-2} Minute, 1/4/2022, 4953.25 (down)
  • 1{-3} Minuette, 1/4/2022, 4953.25 (down)
  • 1{-4} Subminuette, 1/4/2022, 4953.25 (down)
  • 1{-5} Micro, 1/4/2022, 4953.25 (down)
  • 2{-6} Minuscule, 10/13/2022, 3577.75 (up)

Learning and other resources. Elliott wave analysis provides context, not prophecy. As the 20th century semanticist Alfred Korzybski put it in his book Science and Sanity (1933), “The map is not the territory … The only usefulness of a map depends on similarity of structure between the empirical world and the map.” And I would add, in the ever-changing markets, we can judge that similarity of structure only after the fact.

See the menu page Analytical Methods for a rundown on where to go for information on Elliott wave analysis.

By Tim Bovee, Portland, Oregon, June 21, 2023

Disclaimer

Tim Bovee, Private Trader tracks the analysis and trades of a private trader for his own accounts. Nothing in this blog constitutes a recommendation to buy or sell stocks, options or any other financial instrument. The only purpose of this blog is to provide education and entertainment.

No trader is ever 100 percent successful in his or her trades. Trading in the stock and option markets is risky and uncertain. Each trader must make trading decisions for his or her own account, and take responsibility for the consequences.

License
Creative Commons License

All content on Tim Bovee, Private Trader by Timothy K. Bovee is licensed under a Creative Commons Attribution-ShareAlike 4.0 International License.

Based on a work at www.timbovee.com.
Trader’s Notebook

3:30 p.m. New York time

Half an hour before the closing bell. The S&P 500 futures fell during the session into the 4410s and then rose back into the 4430s. No change in this morning’s analysis. I’ve updated the chart.

9:35 a.m. New York time

What’s happening now? The S&P 500 E-mini futures traced a shallow decline overnight, from the 4450s to the 4430s.

What does it mean? The price remained below the upward correction’s high so far, 4493.75 and above the 61.8% Fibonacci retracement level, 4398.87. That lack of the progress over the weekend and in trading during Monday’s U.S. markets holiday left the ambiguities in place: My principal analysis has two interpretations of the chart, each of equal likelihood. One scenario has the upward correction that began October 13, 2022 nearing its end. The other has the correction nearing the end of its first subwave, with two more to go.

Which will eventually match the reality of the chart?

What are the choices? The two interpretations are as follows:

Alternative #1, A-wave scenario: The wave labels on the chart in black show a simple correction, with the first subwave, wave A{-7}, within the upward correction, wave 2{-6}, still underway and nearing its end.

Alternative #2, C-wave scenario: The blue wave labels show the correction having taken a compound form. Compound corrections can contain up to three corrective patterns. The first pattern ended on February 2. The second pattern is now nearing completion. The end of the second pattern could be the end of the upward correction and the beginning of a powerful downtrend, or it could be followed by a relatively shallow declining connection wave, called an X-wave, and then a third corrective pattern.

Reading the chart. Price movements — waves – – in Elliott wave analysis are labeled with numbers within trending waves and letters with corrective waves. The subscripts — numbers in curly brackets — designate the wave’s degree, which, in Elliott wave analysis, means the relative position of a wave within the larger and smaller structures that make up the chart. R.N. Elliott, who in the 1930s developed the form of analysis that bears his name, viewed the chart as a complex structure of smaller waves nested within larger waves, which in turn are nested within still larger waves. In mathematics it’s called a fractal structure, where at every scale the pattern is similar to the others.

[S&P 500 E-mini futures at 3:30 p.m., 8-hour bars, with volume]

What does Elliott wave theory say? Here are the waves that underly the analyses.

Principal analysis, simple correction (black labeling on the chart):

  • An upward correction, a Zigzag, wave 2{-6}, began on October 13, 2022 and is underway.
  • The correction’s first subwave, wave A{-7}, is underway and will have five subwaves.
  • Wave A{-7} at present is in its 3rd subwave, wave C{-8}.
  • Wave C{-8} is in its 3rd subwave, wave C{-9}.
  • Wave 2{-6}, when complete, will be followed by a powerful downtrend, wave 3{-6}.
  • Under the rules of Elliott wave analysis, wave 2{-6} cannot move beyond the beginning of wave 1{-6}, which was the January 4, 2022 peak at 4953.25. (I’ve adjusted the January 4 peak.)

Principal analysis, compound correction (blue labeling on the chart):

  • The upward correction, wave 2{-6}, is taking a compound form, which can contain up to three corrective patterns.
  • The correction is in its second corrective pattern, which is in wave C{-7}, its final wave.

Future Alternatives, an additional corrective pattern or the end of the correction?

  • In either scenario, wave C{-7}, when complete, will either be followed by a separator wave, X{-7}, and then an additional corrective pattern, or will be the end of the wave 2{-6} correction and will be followed by a powerful downtrend, wave 3{-6}.
  • Compound corrections can contain no more than three corrective patterns.

We Are Here.

These are the waves currently in progress under my principal analysis. Each line on the list shows the wave number, with the subscript in curly brackets, the traditional degree name, the starting date, the starting price of the S&P 500 E-mini futures, and the direction of the wave.

  • S&P 500 Index:
  • 5{+3} Supercycle, 7/8/1932, 4.40 (up)
  • 5{+2} Cycle, 12/9/1974, 60.96 (up)
  • 5{+1} Primary, 3/6/2009, 666.79 (up)
  • 5{0} Intermediate, 12/26/2018, 2346.58 (up)
  • S&P 500 Futures and index:
  • 4{-1} Minor, 1/4/2022, 4953.25 (down) (futures), 4818.62 (down) (index)
  • S&P 500 Futures:
  • 1{-2} Minute, 1/4/2022, 4953.25 (down)
  • 1{-3} Minuette, 1/4/2022, 4953.25 (down)
  • 1{-4} Subminuette, 1/4/2022, 4953.25 (down)
  • 1{-5} Micro, 1/4/2022, 4953.25 (down)
  • 2{-6} Minuscule, 10/13/2022, 3577.75 (up)

Learning and other resources. Elliott wave analysis provides context, not prophecy. As the 20th century semanticist Alfred Korzybski put it in his book Science and Sanity (1933), “The map is not the territory … The only usefulness of a map depends on similarity of structure between the empirical world and the map.” And I would add, in the ever-changing markets, we can judge that similarity of structure only after the fact.

See the menu page Analytical Methods for a rundown on where to go for information on Elliott wave analysis.

By Tim Bovee, Portland, Oregon, June 20, 2023

Disclaimer

Tim Bovee, Private Trader tracks the analysis and trades of a private trader for his own accounts. Nothing in this blog constitutes a recommendation to buy or sell stocks, options or any other financial instrument. The only purpose of this blog is to provide education and entertainment.

No trader is ever 100 percent successful in his or her trades. Trading in the stock and option markets is risky and uncertain. Each trader must make trading decisions for his or her own account, and take responsibility for the consequences.

License
Creative Commons License

All content on Tim Bovee, Private Trader by Timothy K. Bovee is licensed under a Creative Commons Attribution-ShareAlike 4.0 International License.

Based on a work at www.timbovee.com.

Trader’s Notebook

9:35 a.m. New York time

U.S. markets closed. Today is the Juneteenth holiday in the United States, celebrating the emancipation from slavery of Black Americans. U.S. markets will remain closed today. The S&P 500 futures were traded overnight, and the London and Tokyo stock exchanges conducted their regular sessions. Trading will resume on U.S. exchanges at 9:30 a.m. Tuesday New York time

What’s happening now? The S&P 500 E-mini futures gently declined from the 4460s to the 4440s, remaining below the June 16 peak in the ongoing upward correction, 4493.75, and also below the 78.6% Fibonacci retracement level, the next common reversal point in the rise.

What does it mean? The lack of movement in the price leaves unresolved the ambiguities I described in Friday’s Trader’s Notebook, and I refer the reader to that post for the details, both of the principal analysis and the alternatives.

The upward correction began on October 13, 2022 from 3502 and has dominated the U.S. markets ever since. The financial media has declared a new bull market to be underway, using a rather simplistic method that calls any rise of 20% or greater over two months or longer to be a bull market. In Elliott wave analysis, such is not the case. The upward correction, wave 2{-6} in Elliott wave terminology, is still underway.

The question is, how far along is the correction?

Briefly, there are two was of analyzing the Elliott waves that make up the chart, and I consider them to be of equal likelihood until additional evidence tips the analysis one way or the other. On the chart, the wave numbers are in black for one way of counting and in blue for the other way of counting. The black wave count scenario has the first subwave, wave A{-7}, within the correction nearing its end. The blue wave count presents a scenario in which the upward correction is nearing its end and is in its final subwave, wave C{-7}.

Reading the chart. Price movements — waves – – in Elliott wave analysis are labeled with numbers within trending waves and letters with corrective waves. The subscripts — numbers in curly brackets — designate the wave’s degree, which, in Elliott wave analysis, means the relative position of a wave within the larger and smaller structures that make up the chart. R.N. Elliott, who in the 1930s developed the form of analysis that bears his name, viewed the chart as a complex structure of smaller waves nested within larger waves, which in turn are nested within still larger waves. In mathematics it’s called a fractal structure, where at every scale the pattern is similar to the others.

[S&P 500 E-mini futures at 9:35 a.m., 8-hour bars, with volume]

What does Elliott wave theory say? Here are the waves that underly the analyses.

Principal analysis, simple correction (black labeling on the chart):

  • An upward correction, a Zigzag, wave 2{-6}, began on October 13, 2022 and is underway.
  • The correction’s first subwave, wave A{-7}, is underway and will have five subwaves.
  • Wave A{-7} at present is in its 3rd subwave, wave C{-8}.
  • Wave C{-8} is in its 3rd subwave, wave C{-9}.
  • Wave 2{-6}, when complete, will be followed by a powerful downtrend, wave 3{-6}.
  • Under the rules of Elliott wave analysis, wave 2{-6} cannot move beyond the beginning of wave 1{-6}, which was the January 4, 2022 peak at 4953.25. (I’ve adjusted the January 4 peak.)

Principal analysis, compound correction (blue labeling on the chart):

  • The upward correction, wave 2{-6}, is taking a compound form, which can contain up to three corrective patterns.
  • The correction is in its second corrective pattern, which is in wave C{-7}, its final wave.

Alternatives, a 3rd corrective pattern or the end of the correction?

  • Wave C{-7}, when complete, will be followed by either (#1) a separator wave, X{-7}, and then a third corrective pattern, or (#2) will be the end of the wave 2{-6} correction and will be followed by a powerful downtrend, wave 3{-6}.
  • Compound corrections can contain no more than three corrective patterns.

We Are Here.

These are the waves currently in progress under my principal analysis. Each line on the list shows the wave number, with the subscript in curly brackets, the traditional degree name, the starting date, the starting price of the S&P 500 E-mini futures, and the direction of the wave.

  • S&P 500 Index:
  • 5{+3} Supercycle, 7/8/1932, 4.40 (up)
  • 5{+2} Cycle, 12/9/1974, 60.96 (up)
  • 5{+1} Primary, 3/6/2009, 666.79 (up)
  • 5{0} Intermediate, 12/26/2018, 2346.58 (up)
  • S&P 500 Futures and index:
  • 4{-1} Minor, 1/4/2022, 4953.25 (down) (futures), 4818.62 (down) (index)
  • S&P 500 Futures:
  • 1{-2} Minute, 1/4/2022, 4953.25 (down)
  • 1{-3} Minuette, 1/4/2022, 4953.25 (down)
  • 1{-4} Subminuette, 1/4/2022, 4953.25 (down)
  • 1{-5} Micro, 1/4/2022, 4953.25 (down)
  • 2{-6} Minuscule, 10/13/2022, 3577.75 (up)

Learning and other resources. Elliott wave analysis provides context, not prophecy. As the 20th century semanticist Alfred Korzybski put it in his book Science and Sanity (1933), “The map is not the territory … The only usefulness of a map depends on similarity of structure between the empirical world and the map.” And I would add, in the ever-changing markets, we can judge that similarity of structure only after the fact.

See the menu page Analytical Methods for a rundown on where to go for information on Elliott wave analysis.

By Tim Bovee, Portland, Oregon, June 19, 2023

Disclaimer

Tim Bovee, Private Trader tracks the analysis and trades of a private trader for his own accounts. Nothing in this blog constitutes a recommendation to buy or sell stocks, options or any other financial instrument. The only purpose of this blog is to provide education and entertainment.

No trader is ever 100 percent successful in his or her trades. Trading in the stock and option markets is risky and uncertain. Each trader must make trading decisions for his or her own account, and take responsibility for the consequences.

License
Creative Commons License

All content on Tim Bovee, Private Trader by Timothy K. Bovee is licensed under a Creative Commons Attribution-ShareAlike 4.0 International License.

Based on a work at www.timbovee.com.
Trader’s Notebook

3:30 p.m. New York time

Half an hour before the closing bell. The S&P 500 futures gradually fell back into the 4450s, a small move compared to the prior day’s rapid rise. No change in this morning’s analysis. I’ve updated the chart.

9:35 a.m. New York time

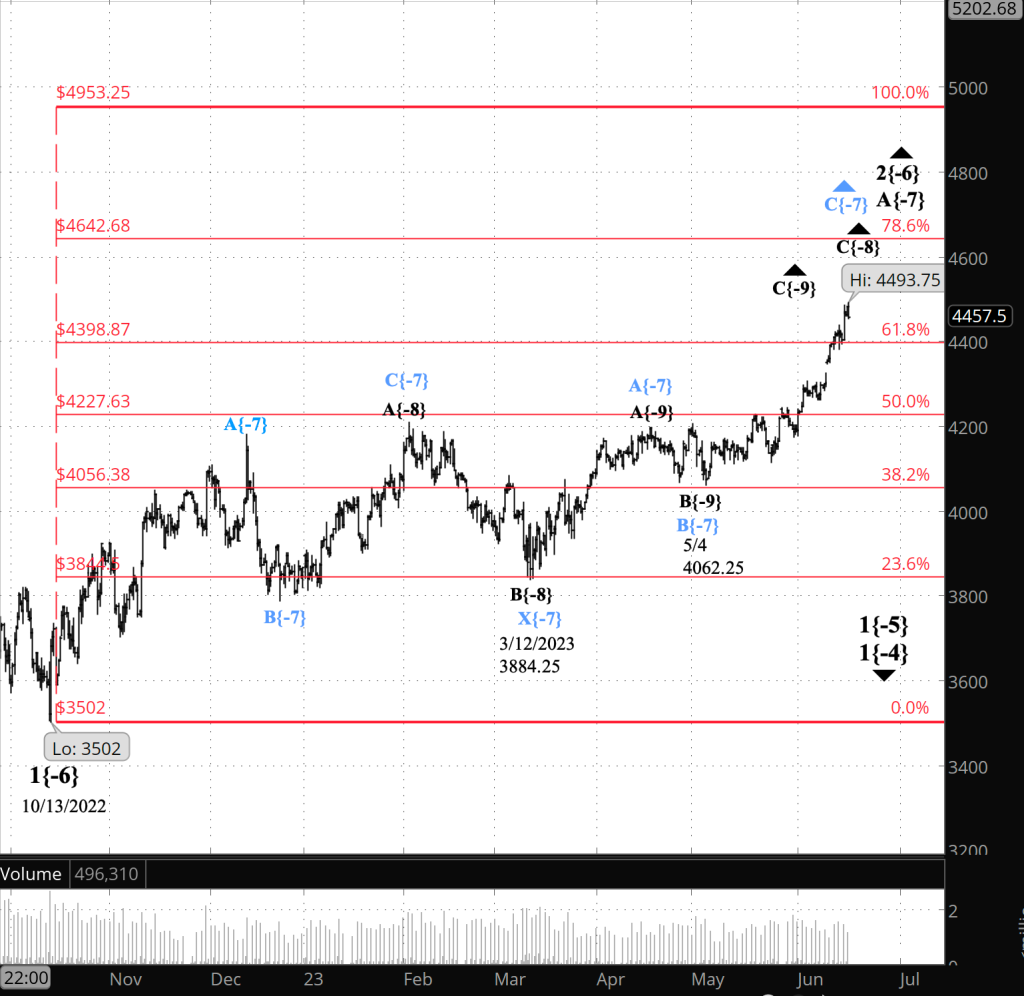
What’s happening now? The S&P 500 E-mini futures pushed higher overnight into the 4490s, while exceeding yesterday’s session high. The price is about halfway between two Fibonacci levels, the 61.8% retracement and the 78.6% retracement.

What does it mean? The present rise has been underway since May 4, within a much larger upward correction that began in October 2022. There are two ways of counting the waves within the correction, and the significance of the rise since May depends upon which method is used.

Corrections can take a simple form, with one corrective pattern a degree below the correction, or a compound form, with two or three corrective patterns.

Analyzing the correction as a simple form, the correction is nearing the end of its first subwave, to be followed by a decline and then a rise to new highs. Analyzing it as a compound form, the correction is nearing the end of its second corrective pattern and is approaching the end of that pattern.

There’s enough ambiguity in the chart that I consider the two possibilities equally likely. I’ve labeled the subwaves according to the simple correction scenario in black, and the subwaves according to the compound scenario in blue.

Breaking through the ambiguity. One component of Elliott wave theory is how a wave’s comparison in the time it takes to reach completion compared to other waves. The downtrending 1st wave preceding the present 2nd wave correction lasted a bit over 10 months. The present upward 2nd wave correction is now its 8th month. First waves in my experience have tended take a slightly longer time than 2nd waves, although not always. A longer time period for the correction suggests a compound form, a shorter time period, a simple form.

Take-away: The correction is likely almost over and has taken a compound form, since the A wave within the simple form has taken way to long a time to reach completion.

I’ll look into this aspect of the analysis further, but for now, I’m retailing the two wave counts as being equally probable.

What are the alternatives? Under the compound-correction scenario, any high could be the end of the present corrective pattern. The alternatives are either (#1) the high also marks the end of the correction, or (#2) a declining separator wave (X-wave) will be followed by a third corrective pattern.

[S&P 500 E-mini futures at 3:30 p\.m., 8-hour bars, with volume]

What does Elliott wave theory say? Here are the waves that underly the analyses.

Principal analysis, simple correction (black labeling on the chart):

  • An upward correction, a Zigzag, wave 2{-6}, began on October 13, 2022 and is underway.
  • The correction’s first subwave, wave A{-7}, is underway and will have five subwaves.
  • Wave A{-7} at present is in its 3rd subwave, wave C{-8}.
  • Wave C{-8} is in its 3rd subwave, wave C{-9}.
  • Wave 2{-6}, when complete, will be followed by a powerful downtrend, wave 3{-6}.
  • Under the rules of Elliott wave analysis, wave 2{-6} cannot move beyond the beginning of wave 1{-6}, which was the January 4, 2022 peak at 4953.25. (I’ve adjusted the January 4 peak.)

Principal analysis, compound correction (blue labeling on the chart):

  • The upward correction, wave 2{-6}, is taking a compound form, which can contain up to three corrective patterns.
  • The correction is in its second corrective pattern, which is in wave C{-7}, its final wave.

Alternatives, a 3rd corrective pattern or the end of the correction

  • Wave C{-7}, when complete, will be followed by either (#1) a separator wave, X{-7}, and then a third corrective pattern, or (#2) will be the end of the wave 2{-6} correction and will be followed by a powerful downtrend, wave 3{-6}.
  • Compound corrections can contain no more than three corrective patterns.

Reading the chart. Price movements — waves – – in Elliott wave analysis are labeled with numbers within trending waves and letters with corrective waves. The subscripts — numbers in curly brackets — designate the wave’s degree, which, in Elliott wave analysis, means the relative position of a wave within the larger and smaller structures that make up the chart. R.N. Elliott, who in the 1930s developed the form of analysis that bears his name, viewed the chart as a complex structure of smaller waves nested within larger waves, which in turn are nested within still larger waves. In mathematics it’s called a fractal structure, where at every scale the pattern is similar to the others.

We Are Here.

These are the waves currently in progress under my principal analysis. Each line on the list shows the wave number, with the subscript in curly brackets, the traditional degree name, the starting date, the starting price of the S&P 500 E-mini futures, and the direction of the wave.

  • S&P 500 Index:
  • 5{+3} Supercycle, 7/8/1932, 4.40 (up)
  • 5{+2} Cycle, 12/9/1974, 60.96 (up)
  • 5{+1} Primary, 3/6/2009, 666.79 (up)
  • 5{0} Intermediate, 12/26/2018, 2346.58 (up)
  • S&P 500 Futures and index:
  • 4{-1} Minor, 1/4/2022, 4953.25 (down) (futures), 4818.62 (down) (index)
  • S&P 500 Futures:
  • 1{-2} Minute, 1/4/2022, 4953.25 (down)
  • 1{-3} Minuette, 1/4/2022, 4953.25 (down)
  • 1{-4} Subminuette, 1/4/2022, 4953.25 (down)
  • 1{-5} Micro, 1/4/2022, 4953.25 (down)
  • 2{-6} Minuscule, 10/13/2022, 3577.75 (up)

Learning and other resources. Elliott wave analysis provides context, not prophecy. As the 20th century semanticist Alfred Korzybski put it in his book Science and Sanity (1933), “The map is not the territory … The only usefulness of a map depends on similarity of structure between the empirical world and the map.” And I would add, in the ever-changing markets, we can judge that similarity of structure only after the fact.

See the menu page Analytical Methods for a rundown on where to go for information on Elliott wave analysis.

By Tim Bovee, Portland, Oregon, June 16, 2023

Disclaimer

Tim Bovee, Private Trader tracks the analysis and trades of a private trader for his own accounts. Nothing in this blog constitutes a recommendation to buy or sell stocks, options or any other financial instrument. The only purpose of this blog is to provide education and entertainment.

No trader is ever 100 percent successful in his or her trades. Trading in the stock and option markets is risky and uncertain. Each trader must make trading decisions for his or her own account, and take responsibility for the consequences.

License
Creative Commons License

All content on Tim Bovee, Private Trader by Timothy K. Bovee is licensed under a Creative Commons Attribution-ShareAlike 4.0 International License.

Based on a work at www.timbovee.com.
Trader’s Notebook

3:30 p.m. New York time

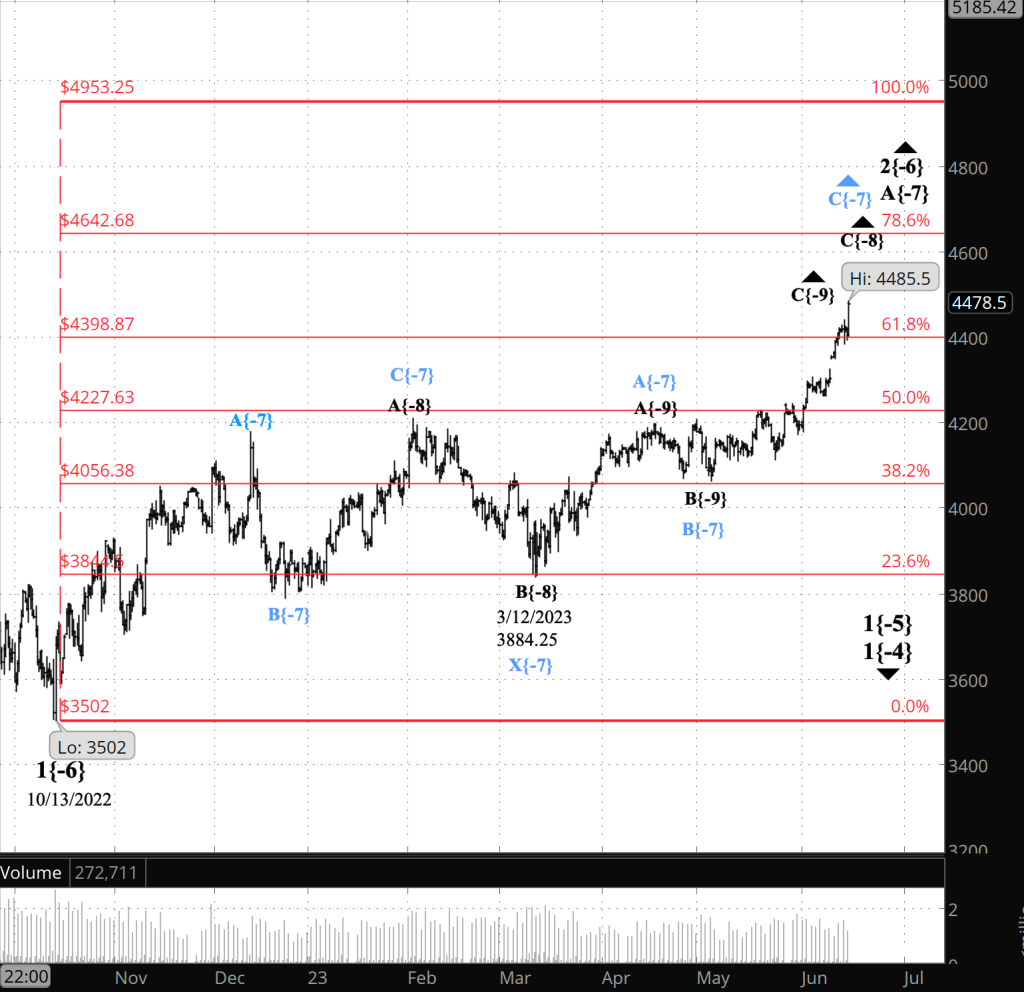
Half an hour before the closing bell. The S&P 500 futures rose rapidly throughout the session, from a low of 4393.75 an hour before the opening bell reaching into the 4480s as the closing bell approached.

No change in the analysis. I’ve updated the chart.

9:35 a.m. New York time

What’s happening now? The S&P 500 E-mini futures pulled back overnight, dipping below the 61.8% Fibonacci retracement level for the second day in a row. The 61.8% retracement neighborhood is a common pause and reversal point in the markets.

What does it mean? The upward correction that began on October 13, 2022 continues. Internally, there are two possible scenarios of equal probability.

  • The correction is in its 1st subwave, an A wave, which is nearing its end. The wave labels for this analysis are shown on the chart in black. Under this scenario, the wave is taking the from of a Zigzag, with five subwaves in the A wave.
  • The correction is in its final subwave, a C wave within the second corrective pattern of a compound correction, which is nearing sits end. The wave labels for this analysis are in blue.

At this point, there’s no way to choose between them. The A-wave scenario seems to be the clearer count, although the time it has taken seems overly long for an A wave of this degree. The C-wave scenario better matches the time frame and is almost a reasonable reading of the chart patterns as is the A-wave scenario.

The falling wave that follows the present rise will tell us which is the best match for the chart. Under the A-wave scenario, the falling wave, as a B wave, will have three subwaves. Under the C-wave scenario, the falling wave will be the 1st subwave of a powerful downtrend and will have five subwaves.

What are the alternatives? There are two.

Alternative #1, a third corrective pattern. Under the C-wave scenario, the compound correction could add a third corrective pattern, separated from the second pattern by an X-wave having three subwaves.

Alternative #2, a Flat, not a Zigzag. Under the A-wave scenario, it’s possible that the correction is taking the form of a Flat, with three subwaves within the A wave. If so, then the third subwave may have ended at the June 14 peak, 4439.50.

[S&P 500 E-mini futures at 3:30 p.m., 8-hour bars, with volume]

What does Elliott wave theory say? Here are the waves that underly the analyses.

Principal analysis, simple correction (black labeling on the chart):

  • An upward correction, a Zigzag, wave 2{-6}, began on October 13, 2022 and is underway.
  • The correction’s first subwave, wave A{-7}, is underway and will have five subwaves.
  • Wave A{-7} at present is in its 3rd subwave, wave C{-8}.
  • Wave C{-8} is in its 3rd subwave, wave C{-9}.
  • Wave 2{-6}, when complete, will be followed by a powerful downtrend, wave 3{-6}.
  • Under the rules of Elliott wave analysis, wave 2{-6} cannot move beyond the beginning of wave 1{-6}, which was the January 4, 2022 peak at 4953.25. (I’ve adjusted the January 4 peak.)

Principal analysis, compound correction (blue labeling on the chart):

  • The upward correction, wave 2{-6}, is taking a compound form, which can contain up to three corrective patterns.
  • The correction is in its second corrective pattern, which is in wave C{-7}, its final wave.
  • Wave C{-7}, when complete, will be followed by either a separator wave, X{-7}, and then a third corrective pattern, or will be the end of the wave 2{-6} correction and will be followed by a powerful downtrend, wave 3{-6}.

Alternative #1, compound correction, a third corrective pattern.

  • Under the scenario marked in blue on the chart, and within the correction, wave 2{-6}…
  • Wave C{-7} will be followed by a connecting wave, X{-7}, and then a third corrective pattern, most likely with three subwaves.
  • Compound corrections can have no more than three corrective patterns.

Alternative #2, , a Flat, not a Zigzag.

  • Under the scenario marked in black on the chart, and within the correction, wave 2{-6}…
  • The correction is taking the form of a Flat, and so wave A{-7} will have three subwaves.
  • The present subwave, wave A{-8}, will complete wave A[-7}.

We Are Here.

These are the waves currently in progress under my principal analysis. Each line on the list shows the wave number, with the subscript in curly brackets, the traditional degree name, the starting date, the starting price of the S&P 500 E-mini futures, and the direction of the wave.

  • S&P 500 Index:
  • 5{+3} Supercycle, 7/8/1932, 4.40 (up)
  • 5{+2} Cycle, 12/9/1974, 60.96 (up)
  • 5{+1} Primary, 3/6/2009, 666.79 (up)
  • 5{0} Intermediate, 12/26/2018, 2346.58 (up)
  • S&P 500 Futures and index:
  • 4{-1} Minor, 1/4/2022, 4953.25 (down) (futures), 4818.62 (down) (index)
  • S&P 500 Futures:
  • 1{-2} Minute, 1/4/2022, 4953.25 (down)
  • 1{-3} Minuette, 1/4/2022, 4953.25 (down)
  • 1{-4} Subminuette, 1/4/2022, 4953.25 (down)
  • 1{-5} Micro, 1/4/2022, 4953.25 (down)
  • 2{-6} Minuscule, 10/13/2022, 3577.75 (up)

Learning and other resources. Elliott wave analysis provides context, not prophecy. As the 20th century semanticist Alfred Korzybski put it in his book Science and Sanity (1933), “The map is not the territory … The only usefulness of a map depends on similarity of structure between the empirical world and the map.” And I would add, in the ever-changing markets, we can judge that similarity of structure only after the fact.

See the menu page Analytical Methods for a rundown on where to go for information on Elliott wave analysis.

By Tim Bovee, Portland, Oregon, June 15, 2023

Disclaimer

Tim Bovee, Private Trader tracks the analysis and trades of a private trader for his own accounts. Nothing in this blog constitutes a recommendation to buy or sell stocks, options or any other financial instrument. The only purpose of this blog is to provide education and entertainment.

No trader is ever 100 percent successful in his or her trades. Trading in the stock and option markets is risky and uncertain. Each trader must make trading decisions for his or her own account, and take responsibility for the consequences.

License
Creative Commons License

All content on Tim Bovee, Private Trader by Timothy K. Bovee is licensed under a Creative Commons Attribution-ShareAlike 4.0 International License.

Based on a work at www.timbovee.com.
Trader’s Notebook

3:30 p.m. New York time

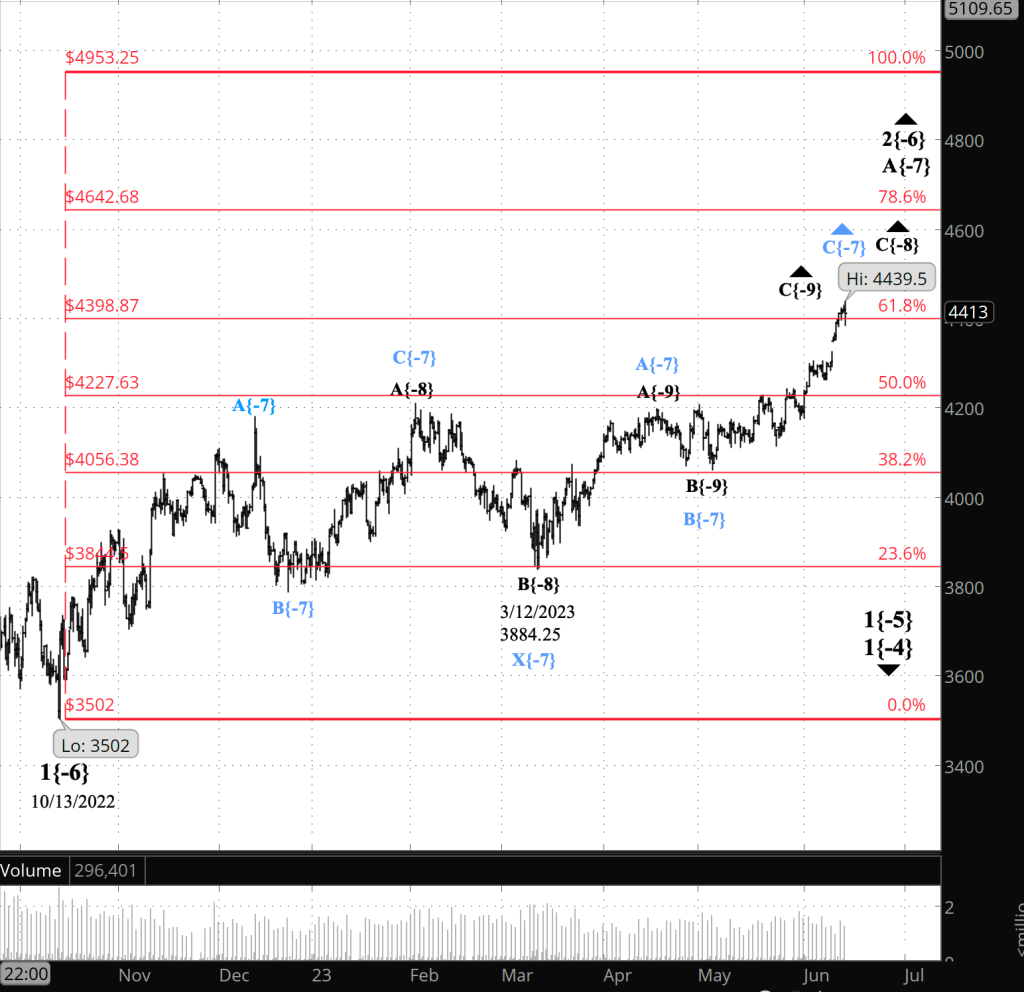
Half an hour before the closing bell. The S&P 500 peaked early in the session at 4439.50 and then dropped sharply to 4383.50 after the Federal Open Market Committee announced it had decided to hold rates steady this month. No change in the analysis. I’ve updated the chart.

9:35 a.m. New York time

What’s happening now? The S&P 500 E-mini futures rose to 4428 in overnight trading, above the 61.8% Fibonacci retracement level.

What does it mean? The upward correction that began on October 13, 2022 continues and is in its 1st subwave.

The upward limit of the correction, under the rules of Elliott wave theory, is 4953.25, the starting point of the downtrending wave that preceded the correction. The price has been adjusted slightly higher to eliminate a price mislabeling by the chart software.

What are the alternatives? It’s possible to see the correction as taking a compound form, containing two corrective patterns. I’ve placed the wave labels for this alternative on the chart in blue. A compound correction can have as many as three corrective patterns, each separated from its predecessor by an X wave.

If the alternative correction turns out to be the best match for the chart, then the upward correction is further along than the principal analysis would have it. The second corrective pattern is in its final subwave under this scenario, and that final subwave may be the end of the correction, or it may be followed by a third corrective pattern.

[S&P 500 E-mini futures at 3:30 p.m., 8-hour bars, with volume]

What does Elliott wave theory say? Here are the waves that underly the revised analyses.

Principal analysis, simple correction (black labeling on the chart):

  • An upward correction, wave 2{-6}, began on October 13, 2022 and is underway.
  • The correction’s first subwave, wave A{-7}, is underway and will have five subwaves.
  • Wave A{-7} at present is in its 3rd subwave, wave C{-8}.
  • Wave C{-8} is in its 3rd subwave, wave C{-9}.
  • Wave 2{-6}, when complete, will be followed by a powerful downtrend, wave 3{-6}.
  • Under the rules of Elliott wave analysis, wave 2{-6} cannot move beyond the beginning of wave 1{-6}, which was the January 4, 2022 peak at 4953.25. (I’ve adjusted the January 4 peak.)

Alternative analysis, compound correction (blue labeling on the chart):

  • The upward correction, wave 2{-6}, is taking a compound form, which can contain up to three corrective patterns.
  • The correction is in its second corrective pattern, which is in wave C{-7}, its final wave.
  • Wave C{-7}, when complete, will be followed by either a separator wave, X{-7}, and then a third corrective pattern, or will be the end of the wave 2{-6} correction and will be followed by a powerful downtrend, wave 3{-6}.

We Are Here.

These are the waves currently in progress under my principal analysis. Each line on the list shows the wave number, with the subscript in curly brackets, the traditional degree name, the starting date, the starting price of the S&P 500 E-mini futures, and the direction of the wave.

  • S&P 500 Index:
  • 5{+3} Supercycle, 7/8/1932, 4.40 (up)
  • 5{+2} Cycle, 12/9/1974, 60.96 (up)
  • 5{+1} Primary, 3/6/2009, 666.79 (up)
  • 5{0} Intermediate, 12/26/2018, 2346.58 (up)
  • S&P 500 Futures and index:
  • 4{-1} Minor, 1/4/2022, 4953.25 (down) (futures), 4818.62 (down) (index)
  • S&P 500 Futures:
  • 1{-2} Minute, 1/4/2022, 4953.25 (down)
  • 1{-3} Minuette, 1/4/2022, 4953.25 (down)
  • 1{-4} Subminuette, 1/4/2022, 4953.25 (down)
  • 1{-5} Micro, 1/4/2022, 4953.25 (down)
  • 2{-6} Minuscule, 10/13/2022, 3577.75 (up)

Learning and other resources. Elliott wave analysis provides context, not prophecy. As the 20th century semanticist Alfred Korzybski put it in his book Science and Sanity (1933), “The map is not the territory … The only usefulness of a map depends on similarity of structure between the empirical world and the map.” And I would add, in the ever-changing markets, we can judge that similarity of structure only after the fact.

See the menu page Analytical Methods for a rundown on where to go for information on Elliott wave analysis.

By Tim Bovee, Portland, Oregon, June 14, 2023

Disclaimer

Tim Bovee, Private Trader tracks the analysis and trades of a private trader for his own accounts. Nothing in this blog constitutes a recommendation to buy or sell stocks, options or any other financial instrument. The only purpose of this blog is to provide education and entertainment.

No trader is ever 100 percent successful in his or her trades. Trading in the stock and option markets is risky and uncertain. Each trader must make trading decisions for his or her own account, and take responsibility for the consequences.

License
Creative Commons License

All content on Tim Bovee, Private Trader by Timothy K. Bovee is licensed under a Creative Commons Attribution-ShareAlike 4.0 International License.

Based on a work at www.timbovee.com.