Trader’s Notebook

3:30 p.m. New York time

Half an hour before the closing bell. The S&P 500 futures reached a session high in the 4420s, continuing the rise that began overnight with the release of new inflation numbers. There’s no change in this morning’s analysis.

9:35 a.m. New York time

What’s happening now? The S&P 500 E-mini futures rose slightly overnight to slightly above 4400, whipsawed when the latest inflation numbers were released, and then continued to rise, reaching 4415.50 before the opening bell.

What does it mean? The rise since March 12, the third subwave of the first segment of the upward correction that began on October 13, has carried the price well above the 61.8% Fibonacci retracement level, a common reversal point, and about halfway to the next Fib level, 78.6%. (The waves’ labels on the chart, from smaller to larger, are C{-8} within A{-7} with the correction, wave 2{-6}).

I’ve overlaid the chart with the Fibonacci retracement ladder, in red.

Under the rules of Elliott wave theory, the 2nd wave upward correction cannot move above the starting point of the declining 1st wave that preceded it. The upper boundary is 4808.25, which gives the correction about 400 points within which it can rise.

What are the alternatives? At a glance it seems possible to count the subwaves of the correction differently, divided the rise from October into three waves one degree down from the corrective wave. However, this doesn’t work but it would have the middle subwave (B) moving above the starting point of initial subwave (A), and that breaks a rule of Elliott wave theory.

So at this point, I have no alternatives. They will develop, I’m quite certain, as the correction progresses.

[S&P 500 E-mini futures at 3:30 p.m., 800-minute bars, with volume]

What does Elliott wave theory say? Here are the waves that underly the revised analyses.

Principal analysis:

  • An upward correction, wave 2{-6}, began on October 13, 2022 and is underway.
  • The correction’s first subwave, wave A{-7}, is underway and will have five subwaves.
  • Wave A{-7} at present is in its 3rd subwave, wave C{-8}.
  • Wave C{-8} is in its 3rd subwave, wave C{-9}.
  • Wave 2{-6}, when complete, will be followed by a powerful downtrend, wave 3{-6}.
  • Under the rules of Elliott wave analysis, wave 2{-6} cannot move beyond the beginning of wave 1{-6}, which was the January 4, 2022 peak at 4808.25.

Reading the chart. Price movements — waves – – in Elliott wave analysis are labeled with numbers within trending waves and letters with corrective waves. The subscripts — numbers in curly brackets — designate the wave’s degree, which, in Elliott wave analysis, means the relative position of a wave within the larger and smaller structures that make up the chart. R.N. Elliott, who in the 1930s developed the form of analysis that bears his name, viewed the chart as a complex structure of smaller waves nested within larger waves, which in turn are nested within still larger waves. In mathematics it’s called a fractal structure, where at every scale the pattern is similar to the others.

We Are Here.

These are the waves currently in progress under my principal analysis. Each line on the list shows the wave number, with the subscript in curly brackets, the traditional degree name, the starting date, the starting price of the S&P 500 E-mini futures, and the direction of the wave.

  • S&P 500 Index:
  • 5{+3} Supercycle, 7/8/1932, 4.40 (up)
  • 5{+2} Cycle, 12/9/1974, 60.96 (up)
  • 5{+1} Primary, 3/6/2009, 666.79 (up)
  • 5{0} Intermediate, 12/26/2018, 2346.58 (up)
  • S&P 500 Futures and index:
  • 4{-1} Minor, 1/4/2022, 4808.25 (down) (futures), 4818.62 (down) (index)
  • S&P 500 Futures:
  • 1{-2} Minute, 1/4/2022, 4808.25 (down)
  • 1{-3} Minuette, 1/4/2022, 4808.25 (down)
  • 1{-4} Subminuette, 1/4/2022, 4808.25 (down)
  • 1{-5} Micro, 1/4/2022, 4808.25 (down)
  • 2{-6} Minuscule, 10/13/2022, 3577.75 (up)

Learning and other resources. Elliott wave analysis provides context, not prophecy. As the 20th century semanticist Alfred Korzybski put it in his book Science and Sanity (1933), “The map is not the territory … The only usefulness of a map depends on similarity of structure between the empirical world and the map.” And I would add, in the ever-changing markets, we can judge that similarity of structure only after the fact.

See the menu page Analytical Methods for a rundown on where to go for information on Elliott wave analysis.

By Tim Bovee, Portland, Oregon, June 13, 2023

Disclaimer

Tim Bovee, Private Trader tracks the analysis and trades of a private trader for his own accounts. Nothing in this blog constitutes a recommendation to buy or sell stocks, options or any other financial instrument. The only purpose of this blog is to provide education and entertainment.

No trader is ever 100 percent successful in his or her trades. Trading in the stock and option markets is risky and uncertain. Each trader must make trading decisions for his or her own account, and take responsibility for the consequences.

License
Creative Commons License

All content on Tim Bovee, Private Trader by Timothy K. Bovee is licensed under a Creative Commons Attribution-ShareAlike 4.0 International License.

Based on a work at www.timbovee.com.
Trader’s Notebook

3:30 p.m. New York time

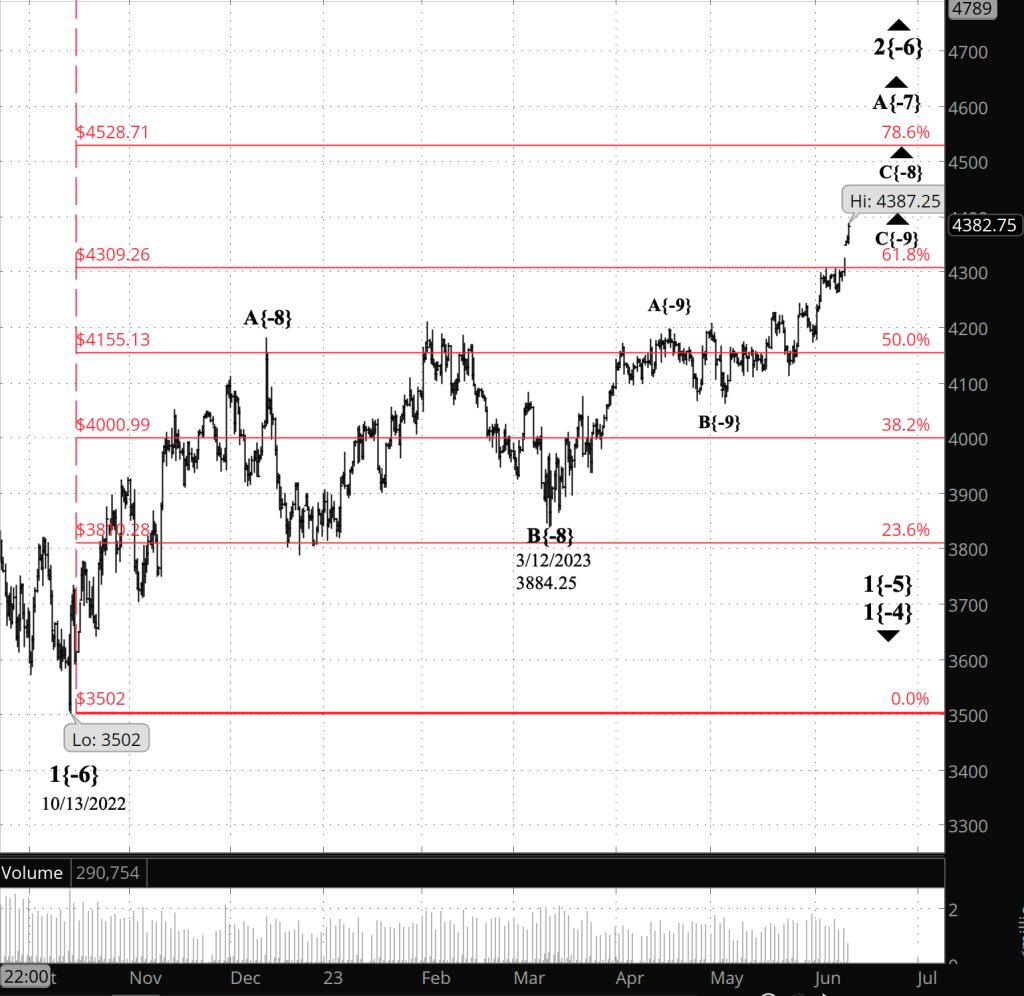
Half an hour before the closing bell. The S&P 500 futures rose slightly higher during the session, into the 4380s so far. The rise brought the 2nd wave upward correction to a 61.8% Fibonacci retracement of the downtrending 1st wave that preceded it. The neighborhood of 61.8% is in my experience a common ending point for a price movement. The preceding downtrend, wave 1{-6}, began on January 4, 2022 from 4808.25. The present upward correction, wave 2{-6}, began on October 13, 2022 from 3502.

There’s no change in the analysis. This morning’s chart labeled the price of the starting point of the upward correction incorrectly, and I’ve fixed that. I’ve also added a Fibonacci retracement ladder, in red, to the futures chart and have updated both charts to show the price movements during the session.

9:35 a.m. New York time

New to Elliott wave theory? The topic of today’s Trader’s Notebook requires extensive use of Elliott wave terminology. See the “Reading the chart” section, below, for guidance on how to read the jargon, both in the text and on the chart.

What’s happening now? The S&P 500 E-mini futures gapped up by 45 points when trading resumed overnight, and continued to rise, moving above the upper limit described in earlier analyses. The rise, a 2nd wave, has so far retraced 63% of the preceding decline, a 1st wave.

The map no longer fits the territory — the analysis no longer matches the chart — and so I’ve revised the analysis.

What does it mean? The new analysis moves everything up one degree. What had been wave 2{-7} has become wave 2{-6}, which began on October 13, 2022. The new parent wave is wave 1{-5}, which began on January 4, 2022.

The reanalysis sets new upper limits, based on a rule of Elliott wave theory that says a 2nd wave never reaches beyond the beginning of the preceding 1st wave.

The new upper limit is the beginning of wave 1{-6}. The wave 2{-6} upper limit of the S&P 500 futures was raised from the old limit, 4327.50, to the new one, 4808.25, and the S&P 500 index limit was raised from 4325.28 to 4818.62.

When wave 2{-6} is complete, it will be followed by a powerful downward correction, wave 3{-6}.

Reading the chart. I’m posting two charts today. The upper chart is of the S&P 500 index and shows the entirety of the decline from January 4, 2022, the beginning of a major downtrend that will be with us for some time to come. This chart gives context to the detailed chart below it, which shows the upward correction, now underway, that began on October 13, 2022. For a near-term view of the former analysis, see the futures chart posted last Friday, June 9. For a broader context, see the index chart posted on June 5.

Price movements — waves – – in Elliott wave analysis are labeled with numbers within trending waves and letters with corrective waves. The subscripts — numbers in curly brackets — designate the wave’s degree, which, in Elliott wave analysis, means the relative position of a wave within the larger and smaller structures that make up the chart. R.N. Elliott, who in the 1930s developed the form of analysis that bears his name, viewed the chart as a complex structure of smaller waves nested within larger waves, which in turn are nested within still larger waves. In mathematics it’s called a fractal structure, where at every scale the pattern is similar to the others.

What are the alternatives? When revisions of the analysis become necessary, it is almost always a question of the degree of a wave. Waves don’t come with introductory lapel buttons saying, “Hi! My degree is…” The way to determine a degree is to figure out what previous degree’s size the present wave seems to match. There’s a lot of ambiguity, and very little certainty. This revision took what had been labeled wave 2{-7} and moved it up a degree, to wave 2{-6}, and made the other adjustments required by that new analysis.

The same ambiguity that applied to the earlier analysis also applies to this one. I’ve taken a guess that the degree is {-6}. It could eventually turn out to be another degree.

[S&P 500 index at 3:30 p.m., 1-day bars, with volume]

[S&P 500 E-mini futures at 3:30 p.m., 8-hour bars, with volume]

What does Elliott wave theory say? Here are the waves that underly the revised analyses.

Principal analysis:

  • An upward correction, wave 2{-6}, began on October 13, 2022 and is underway.
  • The correction’s first subwave, wave A{-7}, is underway and will have five subwaves.
  • Wave A{-7} at present is in its 3rd subwave, wave C{-8}.
  • Wave 2{-6}, when complete, will be followed by a powerful downtrend, wave 3{-6}.

We Are Here.

These are the waves currently in progress under my principal analysis. Each line on the list shows the wave number, with the subscript in curly brackets, the traditional degree name, the starting date, the starting price of the S&P 500 E-mini futures, and the direction of the wave.

  • S&P 500 Index:
  • 5{+3} Supercycle, 7/8/1932, 4.40 (up)
  • 5{+2} Cycle, 12/9/1974, 60.96 (up)
  • 5{+1} Primary, 3/6/2009, 666.79 (up)
  • 5{0} Intermediate, 12/26/2018, 2346.58 (up)
  • S&P 500 Futures and index:
  • 4{-1} Minor, 1/4/2022, 4808.25 (down) (futures), 4818.62 (down) (index)
  • S&P 500 Futures:
  • 1{-2} Minute, 1/4/2022, 4808.25 (down)
  • 1{-3} Minuette, 1/4/2022, 4808.25 (down)
  • 1{-4} Subminuette, 1/4/2022, 4808.25 (down)
  • 1{-5} Micro, 1/4/2022, 4808.25 (down)
  • 2{-6} Minuscule, 10/13/2022, 3577.75 (up)

Learning and other resources. Elliott wave analysis provides context, not prophecy. As the 20th century semanticist Alfred Korzybski put it in his book Science and Sanity (1933), “The map is not the territory … The only usefulness of a map depends on similarity of structure between the empirical world and the map.” And I would add, in the ever-changing markets, we can judge that similarity of structure only after the fact.

See the menu page Analytical Methods for a rundown on where to go for information on Elliott wave analysis.

By Tim Bovee, Portland, Oregon, June 12, 2023

Disclaimer

Tim Bovee, Private Trader tracks the analysis and trades of a private trader for his own accounts. Nothing in this blog constitutes a recommendation to buy or sell stocks, options or any other financial instrument. The only purpose of this blog is to provide education and entertainment.

No trader is ever 100 percent successful in his or her trades. Trading in the stock and option markets is risky and uncertain. Each trader must make trading decisions for his or her own account, and take responsibility for the consequences.

License
Creative Commons License

All content on Tim Bovee, Private Trader by Timothy K. Bovee is licensed under a Creative Commons Attribution-ShareAlike 4.0 International License.

Based on a work at www.timbovee.com.
Trader’s Notebook

3:30 p.m. New York time

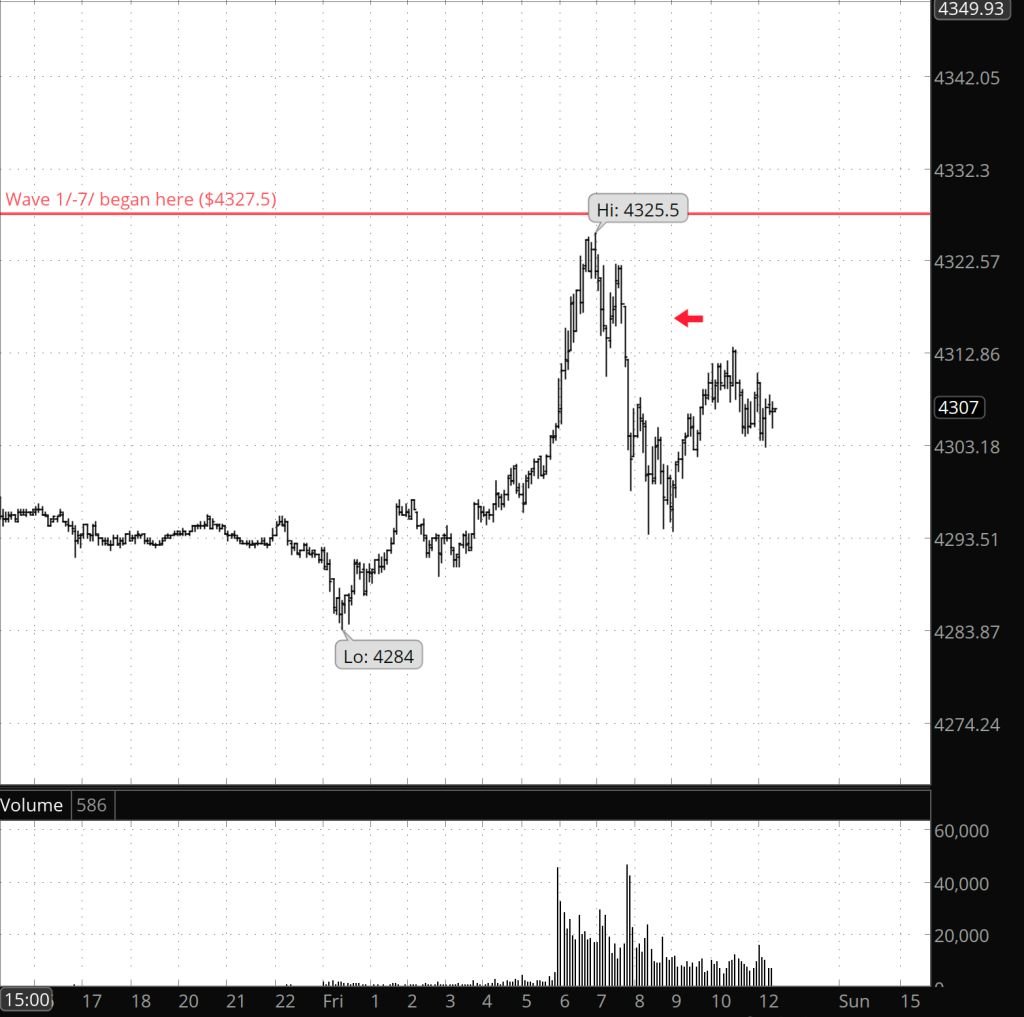
Half an hour before the closing bell. The upward correction that began on October 13, 2022 from 3577.75 may have ended today, at 4325.50 on the S&P 500 futures, two points below the maximum level for that 2nd wave correction under the rules of Elliott wave analysis.

However, two points isn’t nothing, and it is possible that there will be a final push that will move a bit past that high.

I’m leaning toward the scenario that sees the 2nd wave correction as complete, but I’m keeping the chart labeled according to this morning’s analysis, because it’s equally probable that the final push up alternative will play out. It’s a decision based on caution.

One argument in favor of today’s high being the correction’s end is the wave pattern that has followed the peak: A clear five waves down of small degree, the pattern seen in a trending wave, which implies that the parent wave a number of degrees larger is the 3rd wave downtrend following the correction.

The following chart of today’s price movements shows the pattern, pointed to by a red arrow.

[S&P 500 E-mini futures at 3:30 p.m., 5-minute bars, with volume]

9:35 a.m. New York time

What’s happening now? The S&P 500 E-mini futures rose overnight, traveling from the 4280s to, by the opening bell, 4310 and above.

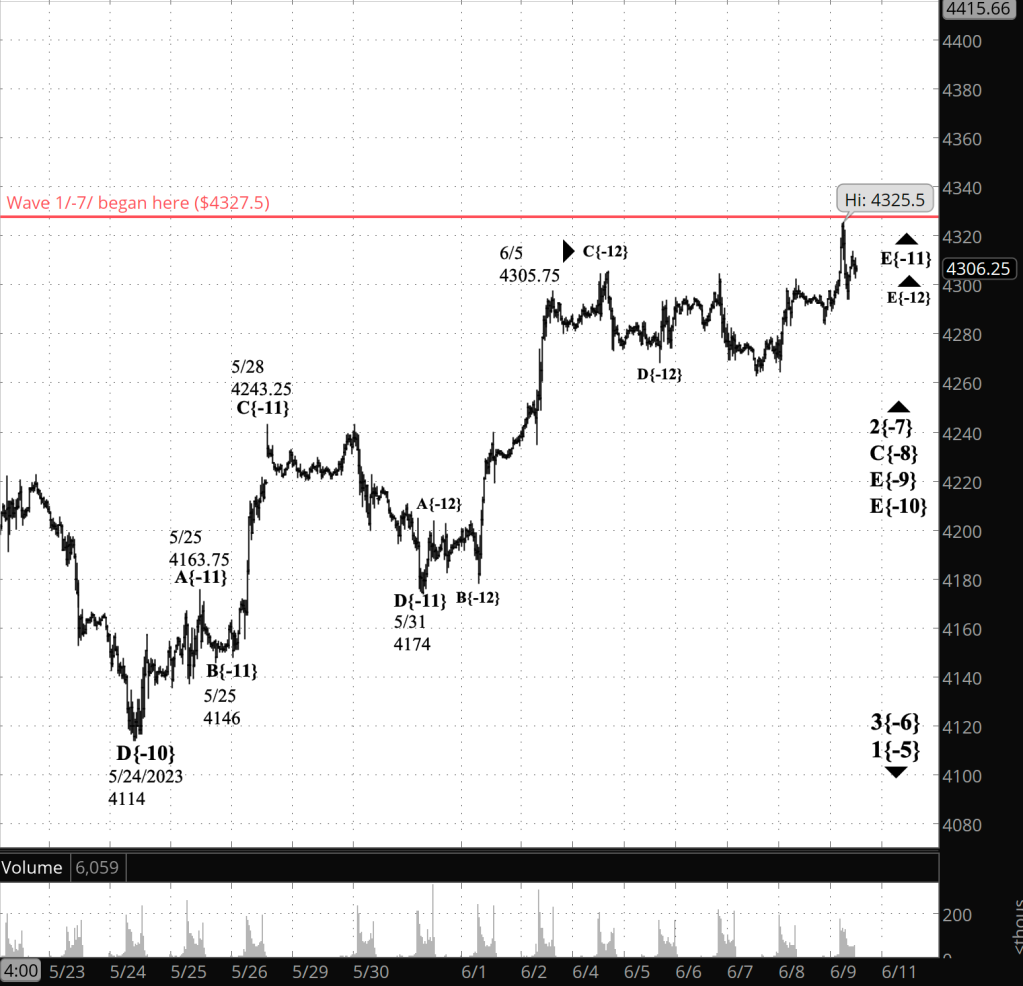
What does it mean? The price exceeded the prior high in the upward correction, 4305.75, set on June 6. The upward correction that began last fall continues and is very close to its end. At this point, every new high in the correction could be it’s end.

Under the rules of Elliott wave analysis, the correction, a 2nd wave, cannot exceed the starting price of the preceding 1st wave, 4327.50, shown on the chart as a horizontal red line. If the price does rise above that even, then the analysis will no longer match the reality of the chart, and I’ll do a reanalysis.

What is the alternative? The correction may form a compound structure. The end of the present corrective pattern won’t complete the correction. Instead, it will be followed by a declining connecting wave and then a second corrective pattern. Compound corrections can be formed from as many as three corrective patterns. If this alternative happens, it will delay the start of the downtrend.

[S&P 500 E-mini futures at 3:30 p.m., 30-minute bars, with volume]

What does Elliott wave theory say? Here are the waves that underly the analyses.

Principal analysis:

  • An upward correction, wave 2{-7}, began on October 13, 2022 and is underway.
  • The correction’s first subwave, wave A{-8}, had five subwaves, meaning the correction is taking the form of a Zigzag
  • Wave 2{-7} is in its final subwave wave, C{-8}, which began on March 13, 2023.
  • Wave C{-7} is in its final subwave, wave E{-9}.
  • Internally, wave E{-9} is in its final subwave, E{10}, which is also in its final subwave, E{-11}, which in turn is in its final subwave, E{-12}.
  • The end of wave E{-12} will cascade up the wave degrees, marking the end of waves E{-10}, E{-9}, C{-8} and of the correction, wave 2{-7}.
  • Downtrending wave 3{-7} will follow the end of the correction and will carry the price a significant distance below present levels.

Alternative analysis, compound correction:

  • The end of wave C{-8} may won’t be the end of the wave 2{-7} correction.
  • Wave 2{-7} will form a compound structure and wave C{-8} ends the first corrective pattern.
  • Wave C{-8} will be followed by a declining connector, wave X{-8}, and then by a second corrective pattern.

Reading the chart. Price movements — waves – – in Elliott wave analysis are labeled with numbers within trending waves and letters with corrective waves. The subscripts — numbers in curly brackets — designate the wave’s degree, which, in Elliott wave analysis, means the relative position of a wave within the larger and smaller structures that make up the chart. R.N. Elliott, who in the 1930s developed the form of analysis that bears his name, viewed the chart as a complex structure of smaller waves nested within larger waves, which in turn are nested within still larger waves. In mathematics it’s called a fractal structure, where at every scale the pattern is similar to the others.

We Are Here.

These are the waves currently in progress under my principal analysis. Each line on the list shows the wave number, with the subscript in curly brackets, the traditional degree name, the starting date, the starting price of the S&P 500 E-mini futures, and the direction of the wave.

  • S&P 500 Index:
  • 5{+3} Supercycle, 7/8/1932, 4.40 (up)
  • 5{+2} Cycle, 12/9/1974, 60.96 (up)
  • 5{+1} Primary, 3/6/2009, 666.79 (up)
  • 5{0} Intermediate, 12/26/2018, 2346.58 (up)
  • S&P 500 Futures and index:
  • 4{-1} Minor, 1/4/2022, 4808.25 (down) (futures), 4818.62 (down) (index)
  • S&P 500 Futures:
  • 1{-2} Minute, 1/4/2022, 4808.25 (down)
  • 1{-3} Minuette, 1/4/2022, 4808.25 (down)
  • 1{-4} Subminuette, 1/4/2022, 4808.25 (down)
  • 1{-5} Micro, 1/4/2022, 4808.25 (down)
  • 3{-6} Submicro, 8/16/2022, 4327.50 (down)
  • 2{-7} Minuscule, 10/13/2022, 3577.75 (up)

Learning and other resources. Elliott wave analysis provides context, not prophecy. As the 20th century semanticist Alfred Korzybski put it in his book Science and Sanity (1933), “The map is not the territory … The only usefulness of a map depends on similarity of structure between the empirical world and the map.” And I would add, in the ever-changing markets, we can judge that similarity of structure only after the fact.

See the menu page Analytical Methods for a rundown on where to go for information on Elliott wave analysis.

By Tim Bovee, Portland, Oregon, June 9, 2023

Disclaimer

Tim Bovee, Private Trader tracks the analysis and trades of a private trader for his own accounts. Nothing in this blog constitutes a recommendation to buy or sell stocks, options or any other financial instrument. The only purpose of this blog is to provide education and entertainment.

No trader is ever 100 percent successful in his or her trades. Trading in the stock and option markets is risky and uncertain. Each trader must make trading decisions for his or her own account, and take responsibility for the consequences.

License
Creative Commons License

All content on Tim Bovee, Private Trader by Timothy K. Bovee is licensed under a Creative Commons Attribution-ShareAlike 4.0 International License.

Based on a work at www.timbovee.com.
Trader’s Notebook

3:30 p.m. New York time

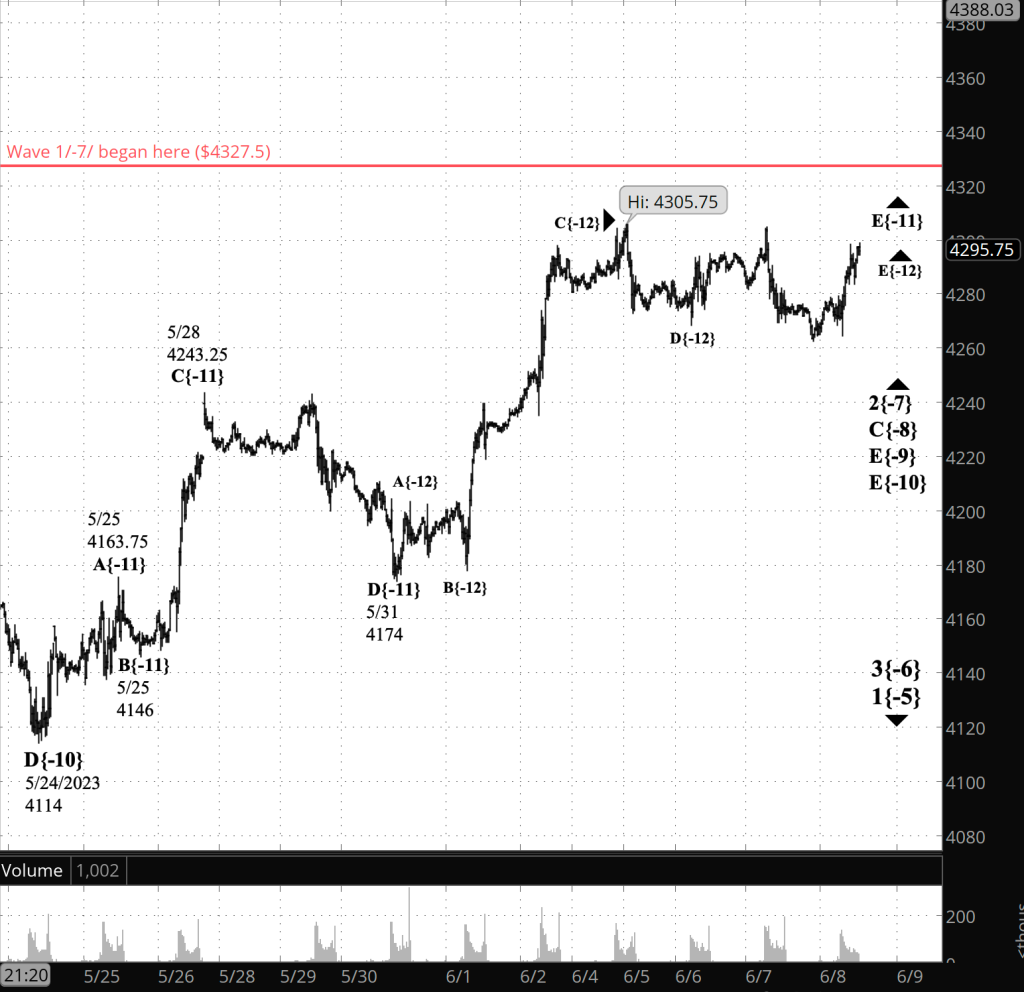
Half an hour before the closing bell. The S&P 500 futures rose into the high 4290s during the session, remaining below the upward correction high of 4305.75, reached on June 5. This morning’s analysis stands unchanged. I’ve updated the chart.

9:35 a.m. New York time

What’s happening now? The S&P 500 E-mini futures swung within the 4260s and the 4270s overnight.

What does it mean? The present upward correction, now in its 238th day, continues and is nearing its end. It will be followed by a power downtrend. This is unchanged from principal analysis that has been with us for quite some time.

What are the alternatives? There are two.

Alternative #1, correction has ended: The correction may have ended at the present high point, 4305.75.

Alternative #2, compound correction: The correction may form a compound structure. The end of the present corrective pattern won’t complete the correction. Instead, it will be followed by a declining connecting wave and then a second corrective pattern. Compound corrections can be formed from as many as three corrective patterns. If this alternative happens, it will delay the start of the downtrend.

[S&P 500 E-mini futures at 3:30 p.m., 25-minute bars, with volume]

What does Elliott wave theory say? Here are the waves that underly the analyses.

Principal analysis:

  • An upward correction, wave 2{-7}, began on October 13, 2022 and is underway.
  • The correction’s first subwave, wave A{-8}, had five subwaves, meaning the correction is taking the form of a Zigzag
  • Wave 2{-7} is in its final subwave wave, C{-8}, which began on March 13, 2023.
  • Wave C{-7} is in its final subwave, wave E{-9}.
  • Internally, wave E{-9} is in its final subwave, E{10}, which is also in its final subwave, E{-11}, which in turn is in its final subwave, E{-12}.
  • The end of wave E{-12} will cascade up the wave degrees, marking the end of waves E{-10}, E{-9}, C{-8} and of the correction, wave 2{-7}.
  • Downtrending wave 3{-7} will follow the end of the correction and will carry the price a significant distance below present levels.

Alternative #1, correction has ended:

  • Wave E{-11} may have ended at the May 5 high, 4305.75, the present high point in the correction, and if it did, then the correction, wave 2{-7}, also ended at that point.
  • Under this scenario, wave 3{-7}, a powerful downtrend, is taking its first steps.

Alternative analysis #2, compound correction:

  • The end of wave C{-8} may won’t be the end of the wave 2{-7} correction.
  • Wave 2{-7} will form a compound structure and wave C{-8} ends the first corrective pattern.
  • Wave C{-8} will be followed by a declining connector, wave X{-8}, and then by a second corrective pattern.

Reading the chart. Price movements — waves – – in Elliott wave analysis are labeled with numbers within trending waves and letters with corrective waves. The subscripts — numbers in curly brackets — designate the wave’s degree, which, in Elliott wave analysis, means the relative position of a wave within the larger and smaller structures that make up the chart. R.N. Elliott, who in the 1930s developed the form of analysis that bears his name, viewed the chart as a complex structure of smaller waves nested within larger waves, which in turn are nested within still larger waves. In mathematics it’s called a fractal structure, where at every scale the pattern is similar to the others.

We Are Here.

These are the waves currently in progress under my principal analysis. Each line on the list shows the wave number, with the subscript in curly brackets, the traditional degree name, the starting date, the starting price of the S&P 500 E-mini futures, and the direction of the wave.

  • S&P 500 Index:
  • 5{+3} Supercycle, 7/8/1932, 4.40 (up)
  • 5{+2} Cycle, 12/9/1974, 60.96 (up)
  • 5{+1} Primary, 3/6/2009, 666.79 (up)
  • 5{0} Intermediate, 12/26/2018, 2346.58 (up)
  • S&P 500 Futures and index:
  • 4{-1} Minor, 1/4/2022, 4808.25 (down) (futures), 4818.62 (down) (index)
  • S&P 500 Futures:
  • 1{-2} Minute, 1/4/2022, 4808.25 (down)
  • 1{-3} Minuette, 1/4/2022, 4808.25 (down)
  • 1{-4} Subminuette, 1/4/2022, 4808.25 (down)
  • 1{-5} Micro, 1/4/2022, 4808.25 (down)
  • 3{-6} Submicro, 8/16/2022, 4327.50 (down)
  • 2{-7} Minuscule, 10/13/2022, 3577.75 (up)

Learning and other resources. Elliott wave analysis provides context, not prophecy. As the 20th century semanticist Alfred Korzybski put it in his book Science and Sanity (1933), “The map is not the territory … The only usefulness of a map depends on similarity of structure between the empirical world and the map.” And I would add, in the ever-changing markets, we can judge that similarity of structure only after the fact.

See the menu page Analytical Methods for a rundown on where to go for information on Elliott wave analysis.

By Tim Bovee, Portland, Oregon, June 8, 2023

Disclaimer

Tim Bovee, Private Trader tracks the analysis and trades of a private trader for his own accounts. Nothing in this blog constitutes a recommendation to buy or sell stocks, options or any other financial instrument. The only purpose of this blog is to provide education and entertainment.

No trader is ever 100 percent successful in his or her trades. Trading in the stock and option markets is risky and uncertain. Each trader must make trading decisions for his or her own account, and take responsibility for the consequences.

License
Creative Commons License

All content on Tim Bovee, Private Trader by Timothy K. Bovee is licensed under a Creative Commons Attribution-ShareAlike 4.0 International License.

Based on a work at www.timbovee.com.
Trader’s Notebook

3:30 p.m. New York time

Half an hour before the closing bell. The S&P 500 futures dipped into the 4160s during the session and then rose slightly. No change in this morning’s analysis. I’ve updated the chart.

9:35 a.m. New York time

What’s happening now? The S&P 500 E-mini futures continued along its narrow path overnight, swinging between the 4080s and the 4090s. Since Monday’s high, 4305.75, the price has fallen to 4268.50 and then worked its way up to the overnight high, 4276.75.

What does it mean? By my principal analysis, the upward correction that began on October 13, 2022 is, at a very low level, on its final rise before reaching its end. A move above 4305.75 would confirm this analysis.

In Elliott wave terminology, listing from small to large, the S&P 500 is tracing wave E{-12} within wave E{-11} within wave E{-10} within wave E{-9} within wave C{-9} within the correction, wave 2{-8}. All of the waves are rising.

The end of wave E{-12} will cascade up the fractal structure, simultaneously ending the correction itself and all of its subwaves.

A rule of Elliott wave theory forbids a 2nd wave from moving above the beginning of the preceding 1st wave. In this case, the downtrending 1st wave began at 4327.50, so the upward 2nd wave doesn’t have much distance to travel before reaching its end. I’ve marked the 1st wave’s starting point on the chart with a red horizontal line.

If the price does move above 4327.50, then the analysis no longer matches the chart, and I’ll perform a reanalysis.

The 2nd wave will be followed by a powerful 3rd wave downtrend that will end all talk for now of a new bull market having begun.

What are the alternatives? There are two.

Alternative #1, correction has ended: The correction may have ended at the present high point, 4305.75.

Alternative #2, compound correction: The correction may form a compound structure. The end of the present corrective pattern won’t complete the correction. Instead, it will be followed by a declining connecting wave and then a second corrective pattern. Compound corrections can be formed from as many as three corrective patterns. If this alternative happens, it will delay the start of the downtrend.

[S&P 500 E-mini futures at 3:30 p.m., 25-minute bars, with volume]

What does Elliott wave theory say? Here are the waves that underly the analyses.

Principal analysis:

  • An upward correction, wave 2{-7}, began on October 13, 2022 and is underway.
  • The correction’s first subwave, wave A{-8}, had five subwaves, meaning the correction is taking the form of a Zigzag
  • Wave 2{-7} is in its final subwave wave, C{-8}, which began on March 13, 2023.
  • Wave C{-7} is in its final subwave, wave E{-9}.
  • Internally, wave E{-9} is in its final subwave, E{10}, which is also in its final subwave, E{-11}, which in turn is in its final subwave, E{-12}.
  • The end of wave E{-12} will cascade up the wave degrees, marking the end of waves E{-10}, E{-9}, C{-8} and of the correction, wave 2{-7}.
  • Downtrending wave 3{-7} will follow the end of the correction and will carry the price a significant distance below present levels.

Alternative #1, correction has ended:

  • Wave E{-11} may have ended at the May 5 high, 4305.75, the present high point in the correction, and if it did, then the correction, wave 2{-7}, also ended at that point.
  • Under this scenario, wave 3{-7}, a powerful downtrend, is taking its first steps.

Alternative analysis #2, compound correction:

  • The end of wave C{-8} may won’t be the end of the wave 2{-7} correction.
  • Wave 2{-7} will form a compound structure and wave C{-8} ends the first corrective pattern.
  • Wave C{-8} will be followed by a declining connector, wave X{-8}, and then by a second corrective pattern.

Reading the chart. Price movements — waves – – in Elliott wave analysis are labeled with numbers within trending waves and letters with corrective waves. The subscripts — numbers in curly brackets — designate the wave’s degree, which, in Elliott wave analysis, means the relative position of a wave within the larger and smaller structures that make up the chart. R.N. Elliott, who in the 1930s developed the form of analysis that bears his name, viewed the chart as a complex structure of smaller waves nested within larger waves, which in turn are nested within still larger waves. In mathematics it’s called a fractal structure, where at every scale the pattern is similar to the others.

We Are Here.

These are the waves currently in progress under my principal analysis. Each line on the list shows the wave number, with the subscript in curly brackets, the traditional degree name, the starting date, the starting price of the S&P 500 E-mini futures, and the direction of the wave.

  • S&P 500 Index:
  • 5{+3} Supercycle, 7/8/1932, 4.40 (up)
  • 5{+2} Cycle, 12/9/1974, 60.96 (up)
  • 5{+1} Primary, 3/6/2009, 666.79 (up)
  • 5{0} Intermediate, 12/26/2018, 2346.58 (up)
  • S&P 500 Futures and index:
  • 4{-1} Minor, 1/4/2022, 4808.25 (down) (futures), 4818.62 (down) (index)
  • S&P 500 Futures:
  • 1{-2} Minute, 1/4/2022, 4808.25 (down)
  • 1{-3} Minuette, 1/4/2022, 4808.25 (down)
  • 1{-4} Subminuette, 1/4/2022, 4808.25 (down)
  • 1{-5} Micro, 1/4/2022, 4808.25 (down)
  • 3{-6} Submicro, 8/16/2022, 4327.50 (down)
  • 2{-7} Minuscule, 10/13/2022, 3577.75 (up)

Learning and other resources. Elliott wave analysis provides context, not prophecy. As the 20th century semanticist Alfred Korzybski put it in his book Science and Sanity (1933), “The map is not the territory … The only usefulness of a map depends on similarity of structure between the empirical world and the map.” And I would add, in the ever-changing markets, we can judge that similarity of structure only after the fact.

See the menu page Analytical Methods for a rundown on where to go for information on Elliott wave analysis.

By Tim Bovee, Portland, Oregon, June 7, 2023

Disclaimer

Tim Bovee, Private Trader tracks the analysis and trades of a private trader for his own accounts. Nothing in this blog constitutes a recommendation to buy or sell stocks, options or any other financial instrument. The only purpose of this blog is to provide education and entertainment.

No trader is ever 100 percent successful in his or her trades. Trading in the stock and option markets is risky and uncertain. Each trader must make trading decisions for his or her own account, and take responsibility for the consequences.

License
Creative Commons License

All content on Tim Bovee, Private Trader by Timothy K. Bovee is licensed under a Creative Commons Attribution-ShareAlike 4.0 International License.

Based on a work at www.timbovee.com.
Trader’s Notebook

3:30 p.m. New York time

Half an hour before the closing bell. The S&P 500 futures swung between the 4260s and the 4290s during the session, tracking a net sideways path. No change in this morning’s analysis. I’ve updated the chart.

9:35 a.m. New York time

What’s happening now? After falling during the session from yesterday’s high, 4305.75, the S&P 500 E-mini futures traded sideways overnight, remaining in the 4070s and 4080s, and fell sharply into the 4060s at the opening bell.

What does it mean? The question dominating the chart is whether a high is the end of the upward correction or not. The 2nd-wave correction began on October 13, 2022 and is nearing its end. Under the rules of Elliott wave analysis, the 2nd wave can’t move beyond the start of the preceding 1st wave, which was 4327.50. Yesterday’s high was a bit less than 22 points below the 1st wave’s starting point, so the correction doesn’t have much room to the upside for a final rise.

Under the principal analysis, the correction is still underway but is very close to completion.

The end of the correction will be the start of a powerful downtrend that will carry the price far below present levels.

What are the alternatives? There are two.

Alternative #1, correction has ended: The correction may have ended at the present high point.

Alternative #2, compound correction: The correction may form a compound structure. The end of the present corrective pattern won’t complete the correction. Instead, it will be followed by a declining connecting wave and then a second corrective pattern. Compound corrections can be formed from as many as three corrective patterns. If this alternative happens, it will delay the start of the downtrend.

[S&P 500 E-mini futures at 3:30 p.m., 20-minute bars, with volume]

What does Elliott wave theory say? Here are the waves that underly the analyses.

Principal analysis:

  • An upward correction, wave 2{-7}, began on October 13, 2022 and is underway.
  • The correction’s first subwave, wave A{-8}, had five subwaves, meaning the correction is taking the form of a Zigzag
  • Wave 2{-7} is in its final subwave wave, C{-8}, which began on March 13, 2023.
  • Wave C{-7} is in its final subwave, wave E{-9}.
  • Internally, wave E{-9} is in its final subwave, E{10}, which is also in its final subwave, E{-11}.
  • The end of wave E{-11} will cascade up the wave degrees, marking the end of waves E{-10}, E{-9}, C{-8} and of the correction, wave 2{-7}.
  • Downtrending wave 3{-7} will follow the end of the correction and will carry the price a significant distance below present levels.

Alternative #1, correction has ended:

  • Wave E{-11} is the smallest wave labelled on the chart.
  • It may have ended at the present high point in the correction, and if it did, then the correction, wave 2{-7}, has also ended.
  • If so, then wave 3{-7}, a powerful downtrend, is taking its first steps.

Alternative analysis #2, compound correction:

  • The end of wave C{-8} may won’t be the end of the wave 2{-7} correction.
  • Wave 2{-7} will form a compound structure and wave C{-8} ends the first corrective pattern.
  • Wave C{-8} will be followed by a declining connector, wave X{-8}, and then by a second corrective pattern.

Reading the chart. Price movements — waves – – in Elliott wave analysis are labeled with numbers within trending waves and letters with corrective waves. The subscripts — numbers in curly brackets — designate the wave’s degree, which, in Elliott wave analysis, means the relative position of a wave within the larger and smaller structures that make up the chart. R.N. Elliott, who in the 1930s developed the form of analysis that bears his name, viewed the chart as a complex structure of smaller waves nested within larger waves, which in turn are nested within still larger waves. In mathematics it’s called a fractal structure, where at every scale the pattern is similar to the others.

We Are Here.

These are the waves currently in progress under my principal analysis. Each line on the list shows the wave number, with the subscript in curly brackets, the traditional degree name, the starting date, the starting price of the S&P 500 E-mini futures, and the direction of the wave.

  • S&P 500 Index:
  • 5{+3} Supercycle, 7/8/1932, 4.40 (up)
  • 5{+2} Cycle, 12/9/1974, 60.96 (up)
  • 5{+1} Primary, 3/6/2009, 666.79 (up)
  • 5{0} Intermediate, 12/26/2018, 2346.58 (up)
  • S&P 500 Futures and index:
  • 4{-1} Minor, 1/4/2022, 4808.25 (down) (futures), 4818.62 (down) (index)
  • S&P 500 Futures:
  • 1{-2} Minute, 1/4/2022, 4808.25 (down)
  • 1{-3} Minuette, 1/4/2022, 4808.25 (down)
  • 1{-4} Subminuette, 1/4/2022, 4808.25 (down)
  • 1{-5} Micro, 1/4/2022, 4808.25 (down)
  • 3{-6} Submicro, 8/16/2022, 4327.50 (down)
  • 2{-7} Minuscule, 10/13/2022, 3577.75 (up)

Learning and other resources. Elliott wave analysis provides context, not prophecy. As the 20th century semanticist Alfred Korzybski put it in his book Science and Sanity (1933), “The map is not the territory … The only usefulness of a map depends on similarity of structure between the empirical world and the map.” And I would add, in the ever-changing markets, we can judge that similarity of structure only after the fact.

See the menu page Analytical Methods for a rundown on where to go for information on Elliott wave analysis.

By Tim Bovee, Portland, Oregon, June 6, 2023

Disclaimer

Tim Bovee, Private Trader tracks the analysis and trades of a private trader for his own accounts. Nothing in this blog constitutes a recommendation to buy or sell stocks, options or any other financial instrument. The only purpose of this blog is to provide education and entertainment.

No trader is ever 100 percent successful in his or her trades. Trading in the stock and option markets is risky and uncertain. Each trader must make trading decisions for his or her own account, and take responsibility for the consequences.

License
Creative Commons License

All content on Tim Bovee, Private Trader by Timothy K. Bovee is licensed under a Creative Commons Attribution-ShareAlike 4.0 International License.

Based on a work at www.timbovee.com.

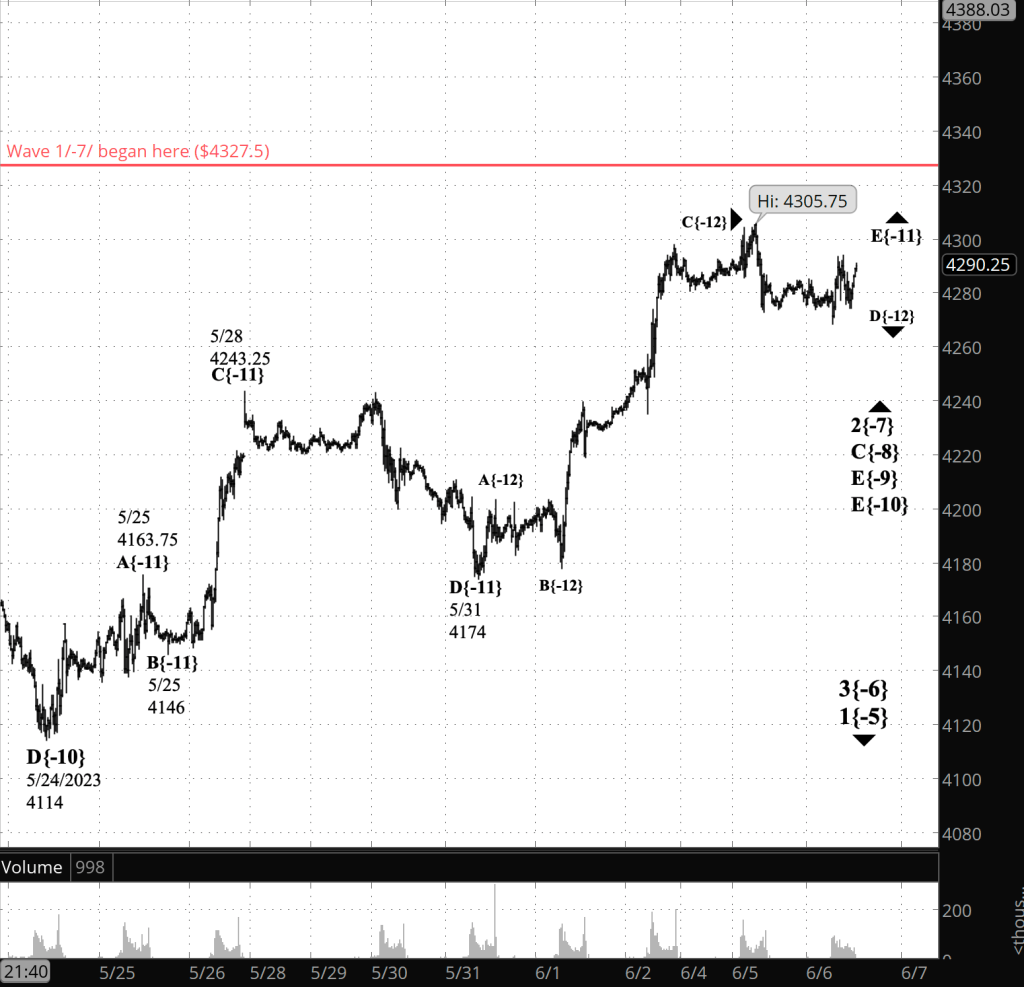
Trader’s Notebook

3:30 p.m. New York time

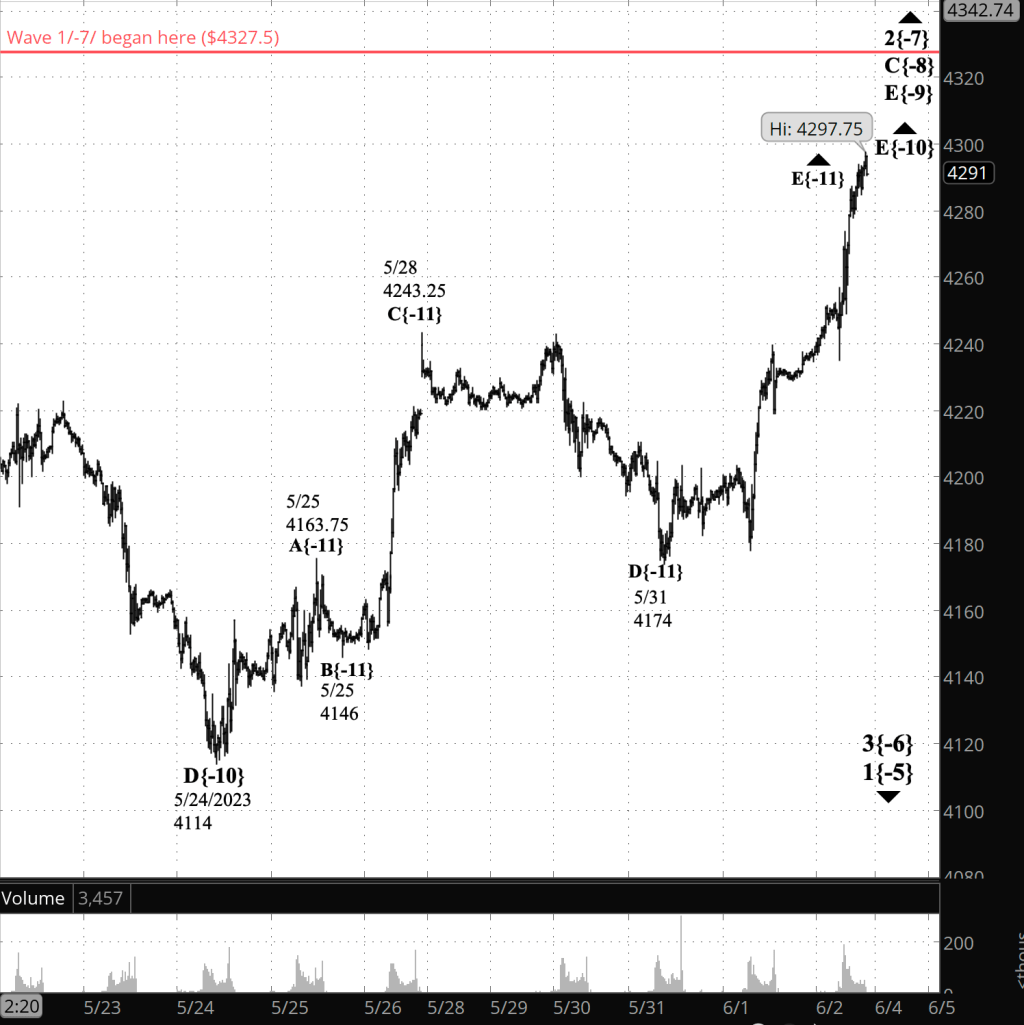
Half an hour before the closing bell. The S&P 500 futures rose during the session to 4305.75 and then declined sharply into the 4270s. The low-degree fluctuation is part of the upward correction that began on October 13 of last year.

Within that correction, the rise that began on May 31, rising wave E{-11}, is in its next-to-the-last internal wave, declining wave D{-12}, which will be followed by a final push to the upside, wave E{-12}.

The completion of wave E{-12} will cascade up the waves of increasingly larger degree, marking the end of each, all the way up to the correction itself, wave 2{-7}.

I’ve updated the upper, close-up chart of the futures and have left the lower, big picture chart of the index as it was this morning.

9:35 a.m. New York time

What’s happening now? The S&P 500 E-mini futures stayed within a narrow band, in the 4290s and 4280s after trading resumed overnight.

What does it mean? The upward correction that began on October 13, 2022 still has a short distance remaining before it reaches completion.

The correction high so far is 4297.75 on the futures. The price must remain below the starting point of the downtrending wave that preceded the correction, 4327.51. On the S&P 500 index, the correction high is 4290.67, and the downtrending wave that preceded the correction began from 4325.28.

Under the rules of Elliott wave theory, those starting points put a firm limit on how high the correction can rise. If the price does exceed those limits, then the analysis no longer matches the chart and will be redone.

When the upward correction is complete, it will be followed by an energetic downtrend that will eventually carry the price far below present levels.

What are the alternatives? There are two. A decisive move to the downside will confirm one scenario or the other, but won’t identify which one.

Alternative #1, correction has ended: The correction may have ended at the present high point.

Alternative #2, compound correction: The correction may form a compound structure. The end of the present corrective pattern won’t complete the correction. Instead, it will be followed by a declining connecting wave and then a second corrective pattern. Compound corrections can be formed from as many as three corrective patterns. If this alternative happens, it will delay the start of the downtrend.

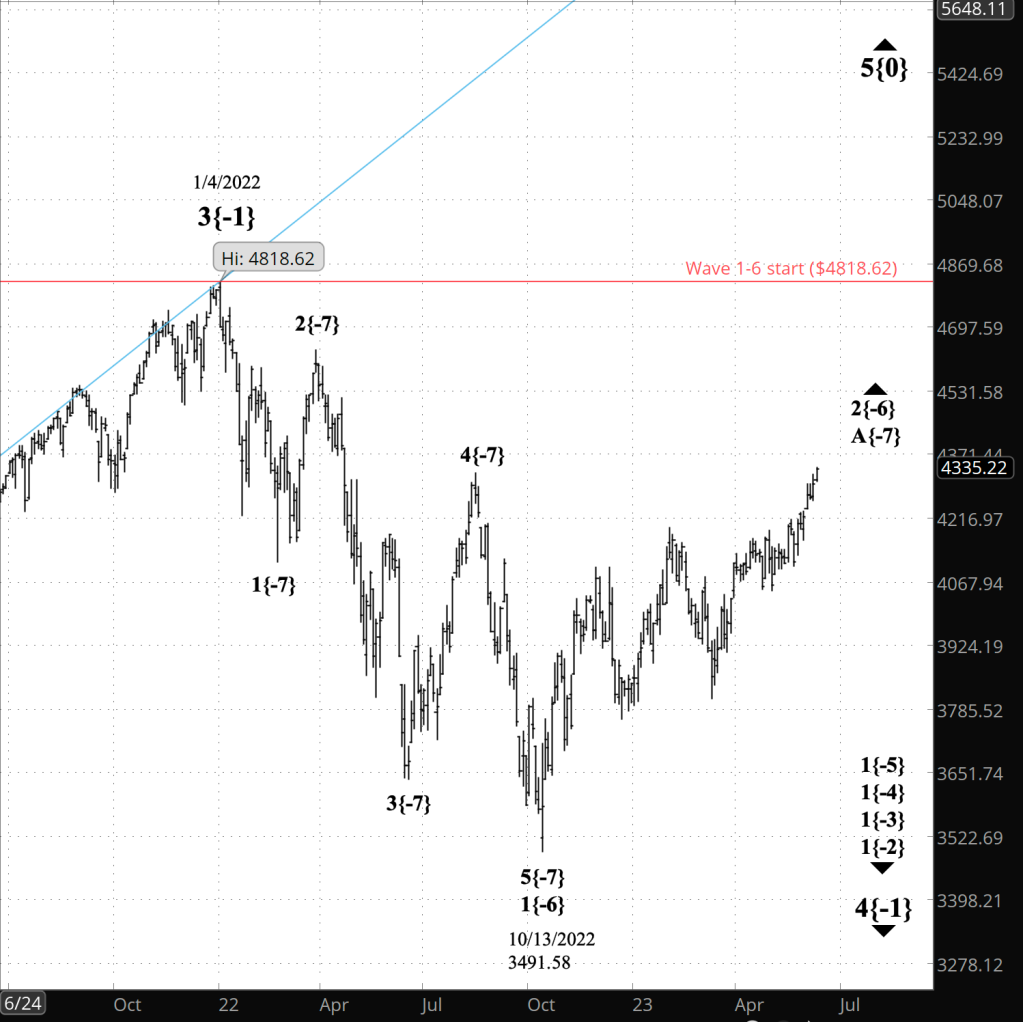
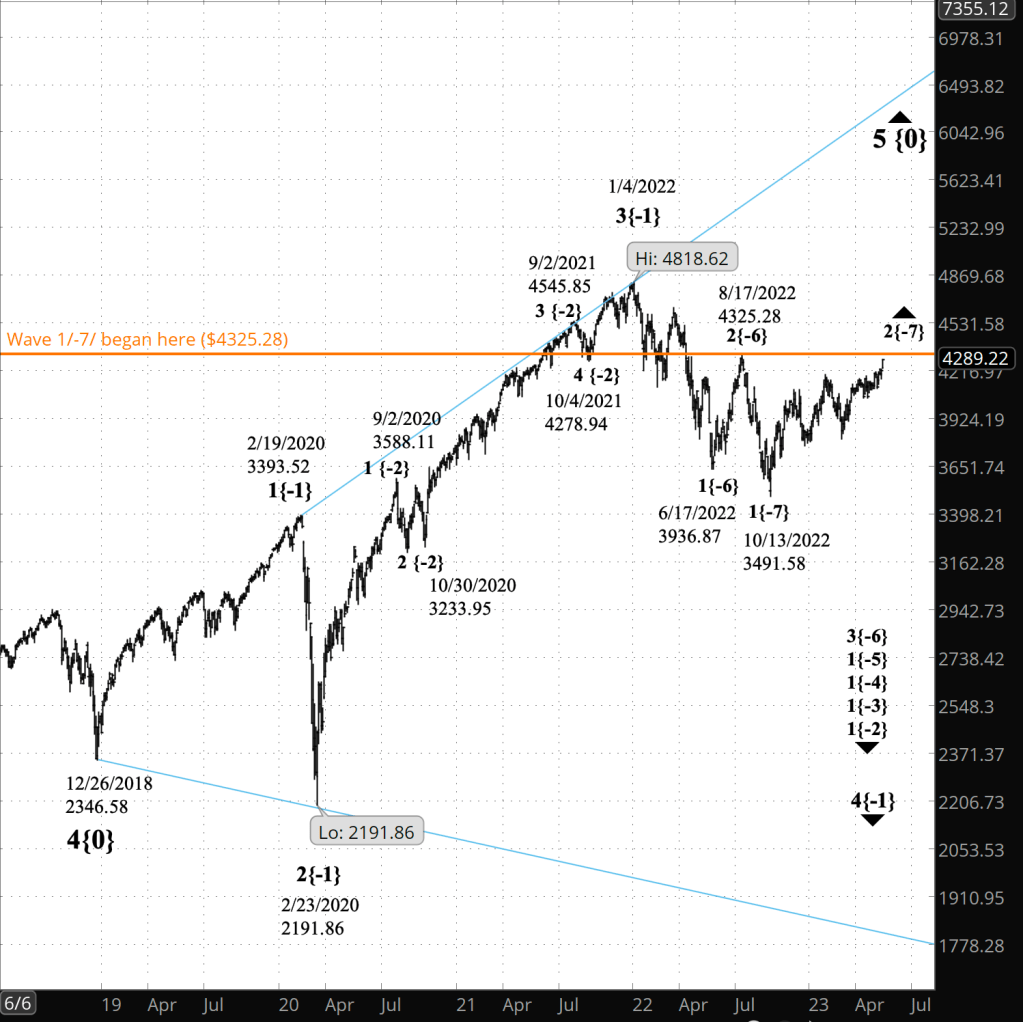
Reading the chart. I’ve posted two charts today. The upper chart shows the final rise of the upward correction, beginning on May 31. The lower chart shows the very large final wave of an uptrend that contains everything the markets have done since December 26, 2018. That final wave is taking the form of an expanding Diagonal Triangle, whose trendlines are marked in blue.

On both charts, a horizontal line in red marks the mandatory upper boundary of the upward correction under the present analysis.

Price movements — waves – – in Elliott wave analysis are labeled with numbers within trending waves and letters with corrective waves. The subscripts — numbers in curly brackets — designate the wave’s degree, which, in Elliott wave analysis, means the relative position of a wave within the larger and smaller structures that make up the chart. R.N. Elliott, who in the 1930s developed the form of analysis that bears his name, viewed the chart as a complex structure of smaller waves nested within larger waves, which in turn are nested within still larger waves. In mathematics it’s called a fractal structure, where at every scale the pattern is similar to the others.

[S&P 500 E-mini futures at 3:30 p.m., 20-minute bars, with volume]

[S&P 500 index at 9:35 a.m., 2-day bars, with volume]

What does Elliott wave theory say? Here are the waves that underly the analyses. The We Are Here section below lists the waves encompassing the upward correction, wave 2{-7}, up to the expanding Diagonal Triangle, wave 5{0}, which began on January 4, 2022, and still larger, to uptrending wave 5{-3}, which began on July 8, 1932.

Principal analysis:

  • An upward correction, wave 2{-7}, began on October 13, 2022 and is underway.
  • The correction’s first subwave, wave A{-8}, had five subwaves, meaning the correction is taking the form of a Zigzag
  • Wave 2{-7} is in its final subwave wave, C{-8}, which began on March 13, 2023.
  • Wave C{-7} is in its final subwave, wave E{-9}.
  • Internally, wave E{-9} is in its final subwave, E{10}, which is also in its final subwave, E{-11}.
  • The end of wave E{-11} will cascade up the wave degrees, marking the end of waves E{-10}, E{-9}, C{-8} and of the correction, wave 2{-7}.
  • Downtrending wave 3{-7} will follow the end of the correction and will carry the price a significant distance below present levels.

Alternative #1, correction has ended:

  • Wave E{-11} is the smallest wave labelled on the chart.
  • It may have ended at the present high point in the correction, and if it did, then the correction, wave 2{-7}, has also ended.
  • If so, then wave 3{-7}, a powerful downtrend, is taking its first steps.

Alternative analysis #2, compound correction:

  • The end of wave C{-8} may won’t be the end of the wave 2{-7} correction.
  • Wave 2{-7} will form a compound structure and wave C{-8} ends the first corrective pattern.
  • Wave C{-8} will be followed by a declining connector, wave X{-8}, and then by a second corrective pattern.

We Are Here.

These are the waves currently in progress under my principal analysis. Each line on the list shows the wave number, with the subscript in curly brackets, the traditional degree name, the starting date, the starting price of the S&P 500 E-mini futures, and the direction of the wave.

  • S&P 500 Index:
  • 5{+3} Supercycle, 7/8/1932, 4.40 (up)
  • 5{+2} Cycle, 12/9/1974, 60.96 (up)
  • 5{+1} Primary, 3/6/2009, 666.79 (up)
  • 5{0} Intermediate, 12/26/2018, 2346.58 (up)
  • S&P 500 Futures and index:
  • 4{-1} Minor, 1/4/2022, 4808.25 (down) (futures), 4818.62 (down) (index)
  • S&P 500 Futures:
  • 1{-2} Minute, 1/4/2022, 4808.25 (down)
  • 1{-3} Minuette, 1/4/2022, 4808.25 (down)
  • 1{-4} Subminuette, 1/4/2022, 4808.25 (down)
  • 1{-5} Micro, 1/4/2022, 4808.25 (down)
  • 3{-6} Submicro, 8/16/2022, 4327.50 (down)
  • 2{-7} Minuscule, 10/13/2022, 3577.75 (up)

Learning and other resources. Elliott wave analysis provides context, not prophecy. As the 20th century semanticist Alfred Korzybski put it in his book Science and Sanity (1933), “The map is not the territory … The only usefulness of a map depends on similarity of structure between the empirical world and the map.” And I would add, in the ever-changing markets, we can judge that similarity of structure only after the fact.

See the menu page Analytical Methods for a rundown on where to go for information on Elliott wave analysis.

By Tim Bovee, Portland, Oregon, June 5, 2023

Disclaimer

Tim Bovee, Private Trader tracks the analysis and trades of a private trader for his own accounts. Nothing in this blog constitutes a recommendation to buy or sell stocks, options or any other financial instrument. The only purpose of this blog is to provide education and entertainment.

No trader is ever 100 percent successful in his or her trades. Trading in the stock and option markets is risky and uncertain. Each trader must make trading decisions for his or her own account, and take responsibility for the consequences.

License
Creative Commons License

All content on Tim Bovee, Private Trader by Timothy K. Bovee is licensed under a Creative Commons Attribution-ShareAlike 4.0 International License.

Based on a work at www.timbovee.com.
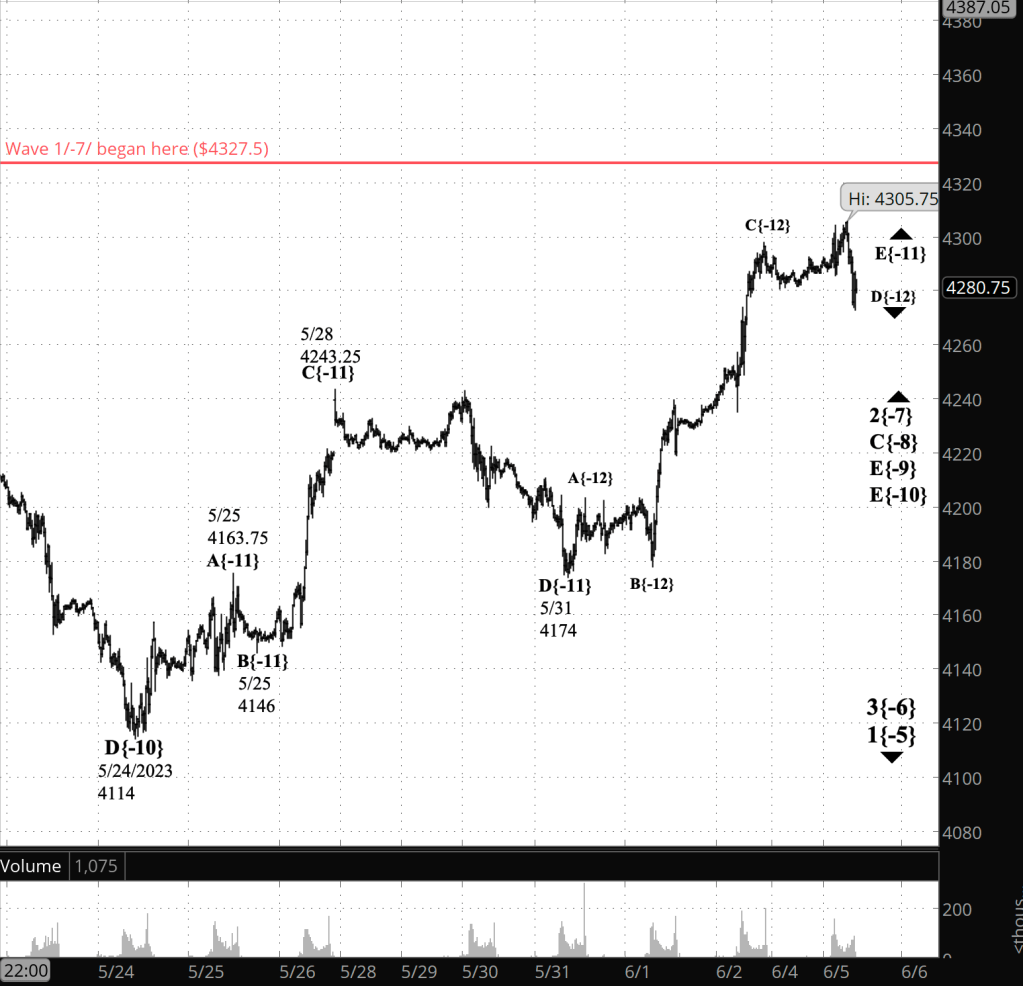
Trader’s Notebook

3:30 p.m. New York time

Half an hour before the closing bell. The S&P 500 futures continued to rise during the session, coming close to 4300. The upward correction is only a short distance from completion, restricted by an absolute rule of Elliott wave theory.

My analysis goes like this: The downtrending 1st wave that preceded the present 2nd wave correction began from 4327.50. Under the rules of Elliott wave theory, a 2nd wave cannot move beyond the start of the preceding 1st wave. So under the present analysis, the present rise, wave 2{-7} has less than 30 points to go before reaching the starting point of wave 1{-7}.

If the price does move above 4327.50, then the analysis no longer matches the chart and will be redone.

I’ve updated the chart, marking the 4327.50 level with a red line.

9:35 a.m. New York time

What’s happening now? The S&P 500 E-mini futures rose overnight, moving above the previous high within the upward correction that began last October. A whipsaw coinciding with the release of new jobs data carried the price still higher, eventually reaching to the 4260s at the opening bell.

What does it mean? The new high confirms prior analyses that a series of final waves within the upward correction are nearing their end. The upward correction has met all of the requirements of Elliott wave theory and could plausibly end with each new high. The implication is that the correction might have ended already, at the overnight high, or it may have a bit further to go.

The upward correction will be followed by a powerful downtrend that will carry the price significantly lower.

What are the alternatives? There are two.

Alternative #1, correction has ended: The correction may have ended at the present high point.

Alternative #2, compound correction: The correction may form a compound structure. The end of the present corrective pattern won’t complete the correction. Instead, it will be followed by a declining connecting wave and then a second corrective pattern. Compound corrections can be formed from as many as three corrective patterns. If this alternative happens, it will delay the start of the downtrend.

[S&P 500 E-mini futures at 3:30 p.m., 20-minute bars, with volume]

What does Elliott wave theory say? Here are the waves that underly the analyses.

Principal analysis:

  • An upward correction, wave 2{-7}, began on October 13, 2022 and is underway.
  • The correction’s first subwave, wave A{-8}, had five subwaves, meaning the correction is taking the form of a Zigzag
  • Wave 2{-7} is in its final subwave wave, C{-8}, which began on March 13, 2023.
  • Wave C{-7} is in its final subwave, wave E{-9}.
  • Internally, wave E{-9} is in its final subwave, E{10}, which is also in its final subwave, E{-11}.
  • The end of wave E{-11} will cascade up the wave degrees, marking the end of waves E{-10}, E{-9}, C{-8} and of the correction, wave 2{-7}.
  • Downtrending wave 3{-7} will follow the end of the correction and will carry the price a significant distance below present levels.

Alternative #1, correction has ended:

  • Wave E{-11} is the smallest wave labelled on the chart.
  • It may have ended at the present high point in the correction, and if it did, then the correction, wave 2{-7}, has also ended.
  • If so, then wave 3{-7}, a powerful downtrend, is taking its first steps.

Alternative analysis #2, compound correction:

  • The end of wave C{-8} may won’t be the end of the wave 2{-7} correction.
  • Wave 2{-7} will form a compound structure and wave C{-8} ends the first corrective pattern.
  • Wave C{-8} will be followed by a declining connector, wave X{-8}, and then by a second corrective pattern.

Reading the chart. Price movements — waves – – in Elliott wave analysis are labeled with numbers within trending waves and letters with corrective waves. The subscripts — numbers in curly brackets — designate the wave’s degree, which, in Elliott wave analysis, means the relative position of a wave within the larger and smaller structures that make up the chart. R.N. Elliott, who in the 1930s developed the form of analysis that bears his name, viewed the chart as a complex structure of smaller waves nested within larger waves, which in turn are nested within still larger waves. In mathematics it’s called a fractal structure, where at every scale the pattern is similar to the others.

We Are Here.

These are the waves currently in progress under my principal analysis. Each line on the list shows the wave number, with the subscript in curly brackets, the traditional degree name, the starting date, the starting price of the S&P 500 E-mini futures, and the direction of the wave.

  • S&P 500 Index:
  • 5{+3} Supercycle, 7/8/1932, 4.40 (up)
  • 5{+2} Cycle, 12/9/1974, 60.96 (up)
  • 5{+1} Primary, 3/6/2009, 666.79 (up)
  • 5{0} Intermediate, 12/26/2018, 2346.58 (up)
  • S&P 500 Futures and index:
  • 4{-1} Minor, 1/4/2022, 4808.25 (down) (futures), 4818.62 (down) (index)
  • S&P 500 Futures:
  • 1{-2} Minute, 1/4/2022, 4808.25 (down)
  • 1{-3} Minuette, 1/4/2022, 4808.25 (down)
  • 1{-4} Subminuette, 1/4/2022, 4808.25 (down)
  • 1{-5} Micro, 1/4/2022, 4808.25 (down)
  • 3{-6} Submicro, 8/16/2022, 4327.50 (down)
  • 2{-7} Minuscule, 10/13/2022, 3577.75 (up)

Learning and other resources. Elliott wave analysis provides context, not prophecy. As the 20th century semanticist Alfred Korzybski put it in his book Science and Sanity (1933), “The map is not the territory … The only usefulness of a map depends on similarity of structure between the empirical world and the map.” And I would add, in the ever-changing markets, we can judge that similarity of structure only after the fact.

See the menu page Analytical Methods for a rundown on where to go for information on Elliott wave analysis.

By Tim Bovee, Portland, Oregon, June 2, 2023

Disclaimer

Tim Bovee, Private Trader tracks the analysis and trades of a private trader for his own accounts. Nothing in this blog constitutes a recommendation to buy or sell stocks, options or any other financial instrument. The only purpose of this blog is to provide education and entertainment.

No trader is ever 100 percent successful in his or her trades. Trading in the stock and option markets is risky and uncertain. Each trader must make trading decisions for his or her own account, and take responsibility for the consequences.

License
Creative Commons License

All content on Tim Bovee, Private Trader by Timothy K. Bovee is licensed under a Creative Commons Attribution-ShareAlike 4.0 International License.

Based on a work at www.timbovee.com.
Trader’s Notebook

3:30 p.m. New York time

Half an hour before the closing bell. The S&P 500 futures rose during the session, coming within four points of the high set so far by the upward correction that began on October 13, 2022.

The correction, wave 2{-7}, is in a series of final waves internally: Wave E{-11} within E{-10} with E{-9} within C{-8}. When wave E{-11} ends, all the rest in then nested sequence will also end, including wave 2{-7}, the upward correction. A powerful downtrend will follow, wave 3{-7}, carrying the price far below its present level.

The rapid rise today lends credence to this morning’s principal analysis, and also to Alternative #2, the compound correction scenario. Alternative #1, which has the correction ending on May 28 at 4243.25, has become less likely and will be taken off the table if the present rise moves above 4243.25.

I’ve updated the chart.

9:35 a.m. New York time

What’s happening now? The S&P 500 E-mini futures swung between the 4180s and just above 4200 overnight.

What does it mean? The movement did nothing to change the analysis. The upward correction that began on October 13, 2022 continues and is working through its endgame. At a small degree, four levels down within the correction, the final upward wave is underway. When that small wave is complete, the entire correction will be complete. It will be followed by a power downtrend.

What are the alternatives? There are two.

Alternative #1, correction ended. Under this scenario, the upward correction ended on May 28 at 4243.25 and the downtrend has begun. Although my principal analysis sees the correction as still being underway, the wave structure since May 28 is also consistent with the early stages of a downtrend.

Alternative #2, compound correction. The correction may form a compound structure. The end of the present corrective pattern won’t complete the correction. Instead, it will be followed by a declining connecting wave and then a second corrective pattern. Compound corrections can be formed from as many as three corrective patterns. If this alternative happens, it will delay the start of the downtrend.

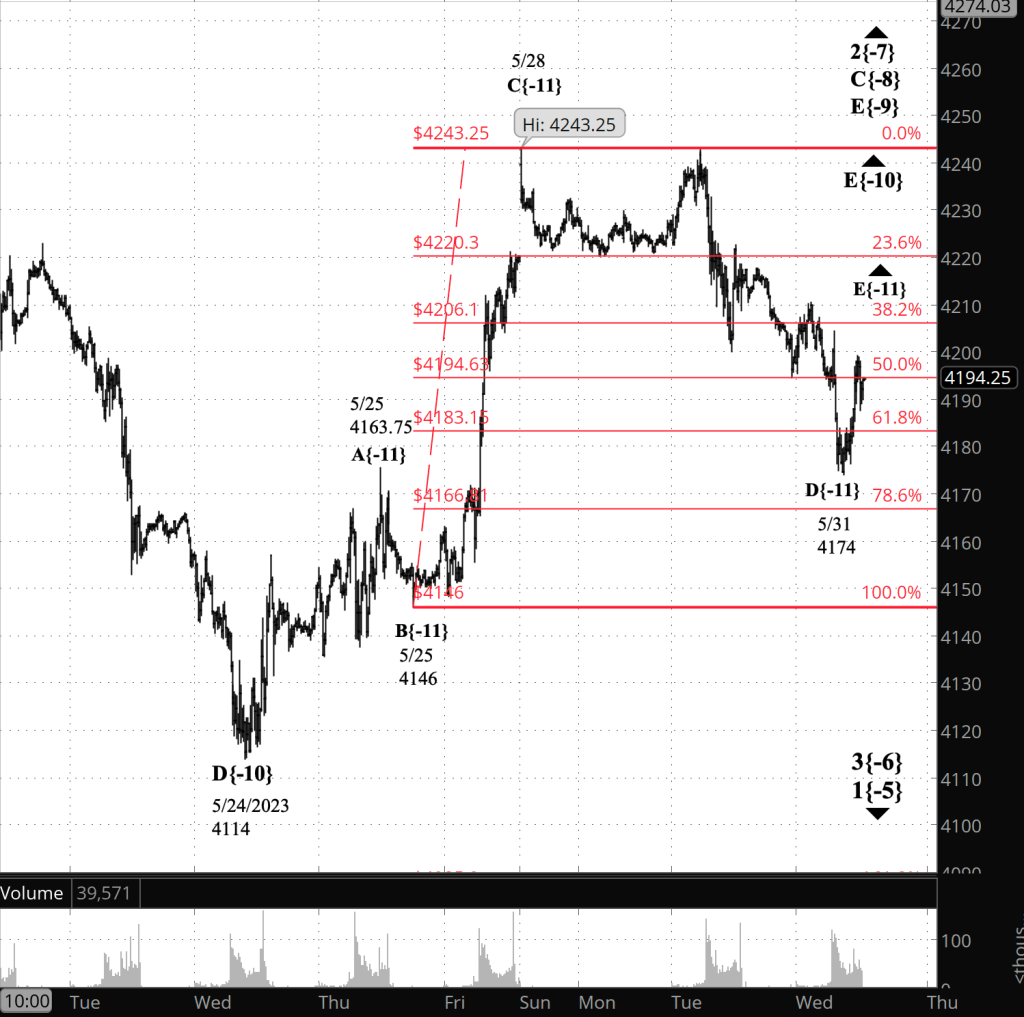
Reading the chart. I’ve added a Fibonacci retracement ladder, in red, comparing the decline that began on May 28 with the ride that preceded it.

Price movements — waves – – in Elliott wave analysis are labeled with numbers within trending waves and letters with corrective waves. The subscripts — numbers in curly brackets — designate the wave’s degree, which, in Elliott wave analysis, means the relative position of a wave within the larger and smaller structures that make up the chart. R.N. Elliott, who in the 1930s developed the form of analysis that bears his name, viewed the chart as a complex structure of smaller waves nested within larger waves, which in turn are nested within still larger waves. In mathematics it’s called a fractal structure, where at every scale the pattern is similar to the others.

[S&P 500 E-mini futures at 3:30 p.m., 15-minute bars, with volume]

What does Elliott wave theory say? Here are the waves that underly the analyses.

Principal analysis:

  • An upward correction, wave 2{-7}, began on October 13, 2022 and is underway.
  • The correction’s first subwave, wave A{-8}, had five subwaves, meaning the correction is taking the form of a Zigzag
  • Wave 2{-7} is in its final subwave wave, C{-8}, which began on March 13, 2023.
  • Wave C{-7} is in its final subwave, wave E{-9}.
  • Internally, wave E{-9} is in its final subwave, E{10}, which is also in its final subwave, E{-11}
  • The end of wave E{-11} will cascade up the wave degrees, marking the end of waves E{-10}, E{-9}, C{-8} and of the correction, wave 2{-7}.
  • Downtrending wave 3{-7} will follow the end of the correction and will carry the price a significant distance below present levels.

Alternative analysis #1, correction ended:

  • What is marked as wave C{-11} on the chart should be marked as the end of wave E{-11}, and of all the larger waves in the fractal structure, including wave 2{-7}, which is the correction itself.
  • The subsequent decline is the early stage of a downtrend, wave 3{-7}.

Alternative analysis #2, compound correction:

  • The end of wave C{-8} may won’t be the end of the wave 2{-7} correction.
  • Wave 2{-7} will form a compound structure and wave C{-8} ends the first corrective pattern.
  • Wave C{-8} will be followed by a declining connector, wave X{-8}, and then by a second corrective pattern.

We Are Here.

These are the waves currently in progress under my principal analysis. Each line on the list shows the wave number, with the subscript in curly brackets, the traditional degree name, the starting date, the starting price of the S&P 500 E-mini futures, and the direction of the wave.

  • S&P 500 Index:
  • 5{+3} Supercycle, 7/8/1932, 4.40 (up)
  • 5{+2} Cycle, 12/9/1974, 60.96 (up)
  • 5{+1} Primary, 3/6/2009, 666.79 (up)
  • 5{0} Intermediate, 12/26/2018, 2346.58 (up)
  • S&P 500 Futures and index:
  • 4{-1} Minor, 1/4/2022, 4808.25 (down) (futures), 4818.62 (down) (index)
  • S&P 500 Futures:
  • 1{-2} Minute, 1/4/2022, 4808.25 (down)
  • 1{-3} Minuette, 1/4/2022, 4808.25 (down)
  • 1{-4} Subminuette, 1/4/2022, 4808.25 (down)
  • 1{-5} Micro, 1/4/2022, 4808.25 (down)
  • 3{-6} Submicro, 8/16/2022, 4327.50 (down)
  • 2{-7} Minuscule, 10/13/2022, 3577.75 (up)

Learning and other resources. Elliott wave analysis provides context, not prophecy. As the 20th century semanticist Alfred Korzybski put it in his book Science and Sanity (1933), “The map is not the territory … The only usefulness of a map depends on similarity of structure between the empirical world and the map.” And I would add, in the ever-changing markets, we can judge that similarity of structure only after the fact.

See the menu page Analytical Methods for a rundown on where to go for information on Elliott wave analysis.

By Tim Bovee, Portland, Oregon, June 1, 2023

Disclaimer

Tim Bovee, Private Trader tracks the analysis and trades of a private trader for his own accounts. Nothing in this blog constitutes a recommendation to buy or sell stocks, options or any other financial instrument. The only purpose of this blog is to provide education and entertainment.

No trader is ever 100 percent successful in his or her trades. Trading in the stock and option markets is risky and uncertain. Each trader must make trading decisions for his or her own account, and take responsibility for the consequences.

License
Creative Commons License

All content on Tim Bovee, Private Trader by Timothy K. Bovee is licensed under a Creative Commons Attribution-ShareAlike 4.0 International License.

Based on a work at www.timbovee.com.
Trader’s Notebook

3:30 p.m. New York time

Half an hour before the closing bell. The S&P 500 futures fell during the session, reaching 4174 and then beginning to climb again. The decline carried the price below a Fibonacci 61.8% retracement of the preceding upward movement.

Rather than updating this morning’s chart, I’ve added a close-up to give a better view of the smallest waves that I’m tracking. On it, I’ve marked a possible analysis, although it is one that I’m uncertain about. In it, declining wave D{-11} as ended at today’s low, 4174, and rising wave E{-11} has begun. When wave E{-11} is complete, it will be the end of the correction. If the decline reverses and falls below 4174, then wave D{-11} is still underway.

[S&P 500 E-mini futures at 3:30 p.m., 15-minute bars, with volume]

9:35 a.m. New York time

What’s happening now? The S&P 500 E-mini futures fell slightly overnight, reaching into the 4190s.

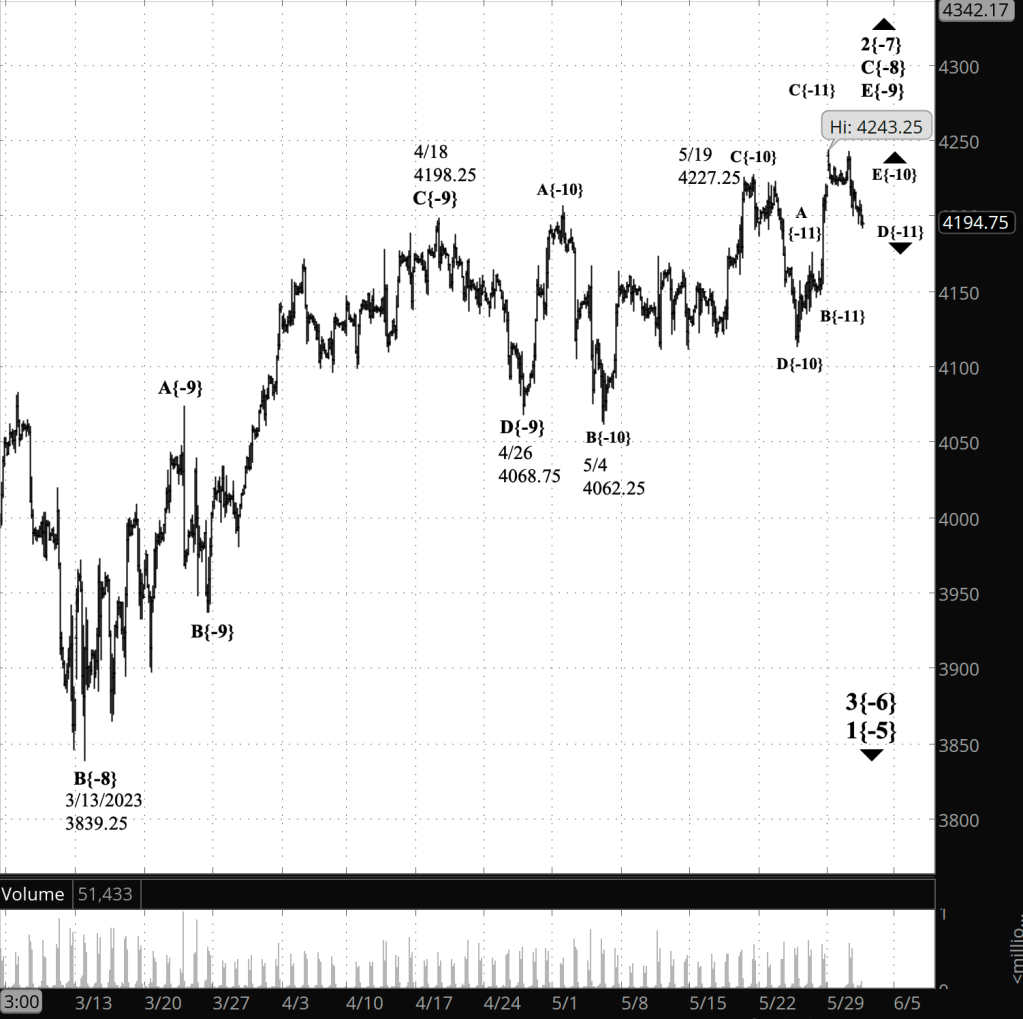
What does it mean? The upward correction that began last October is nearing its end. The present small decline from 4132.75 will be followed by a final push upward, and when that is complete, the correction will also be complete. The next step will be a powerful downtrend that will carry the price below the corrections starting point, 3577.75, and almost certainly significantly below that level.

What are the alternatives? The correction may form a compound structure. The end of the present corrective pattern won’t complete the correction. Instead, it will be followed by a declining connecting wave and then a second corrective pattern. Compound corrections can be formed from as many as three corrective patterns. If this alternative happens, it will delay the start of the downtrend.

[S&P 500 E-mini futures at 9:35 a.m., 150-minute bars, with volume]

What does Elliott wave theory say? Here are the waves that underly the analyses.

Principal analysis:

  • An upward correction, wave 2{-7}, began on October 13, 2022 and is underway.
  • The correction’s first subwave, wave A{-8}, had five subwaves, meaning the correction is taking the form of a Zigzag
  • Wave 2{-7} is in its final subwave wave, C{-8}, which began on March 13, 2023.
  • Wave C{-7} is in its final subwave, wave E{-9}.
  • Internally, wave E{-9} is in its final subwave, E{-10}, which is in its next-to-the-last subwave, D{-11}.
  • The end of wave E{-10} will cascade up the wave degrees, marking the end of waves C{-8} and of the correction, wave 2{-7}.
  • Downtrending wave 3{-7} will follow the end of the correction and will carry the price a significant distance below present levels.

Alternative analysis:

  • The end of wave C{-8} may won’t be the end of the wave 2{-7} correction.
  • Wave 2{-7} will form a compound structure and wave C{-8} ends the first corrective pattern.
  • Wave C{-8} will be followed by a declining connector, wave X{-8}, and then by a second corrective pattern.

Reading the chart. Price movements — waves – – in Elliott wave analysis are labeled with numbers within trending waves and letters with corrective waves. The subscripts — numbers in curly brackets — designate the wave’s degree, which, in Elliott wave analysis, means the relative position of a wave within the larger and smaller structures that make up the chart. R.N. Elliott, who in the 1930s developed the form of analysis that bears his name, viewed the chart as a complex structure of smaller waves nested within larger waves, which in turn are nested within still larger waves. In mathematics it’s called a fractal structure, where at every scale the pattern is similar to the others.

We Are Here.

These are the waves currently in progress under my principal analysis. Each line on the list shows the wave number, with the subscript in curly brackets, the traditional degree name, the starting date, the starting price of the S&P 500 E-mini futures, and the direction of the wave.

  • S&P 500 Index:
  • 5{+3} Supercycle, 7/8/1932, 4.40 (up)
  • 5{+2} Cycle, 12/9/1974, 60.96 (up)
  • 5{+1} Primary, 3/6/2009, 666.79 (up)
  • 5{0} Intermediate, 12/26/2018, 2346.58 (up)
  • S&P 500 Futures and index:
  • 4{-1} Minor, 1/4/2022, 4808.25 (down) (futures), 4818.62 (down) (index)
  • S&P 500 Futures:
  • 1{-2} Minute, 1/4/2022, 4808.25 (down)
  • 1{-3} Minuette, 1/4/2022, 4808.25 (down)
  • 1{-4} Subminuette, 1/4/2022, 4808.25 (down)
  • 1{-5} Micro, 1/4/2022, 4808.25 (down)
  • 3{-6} Submicro, 8/16/2022, 4327.50 (down)
  • 2{-7} Minuscule, 10/13/2022, 3577.75 (up)

Learning and other resources. Elliott wave analysis provides context, not prophecy. As the 20th century semanticist Alfred Korzybski put it in his book Science and Sanity (1933), “The map is not the territory … The only usefulness of a map depends on similarity of structure between the empirical world and the map.” And I would add, in the ever-changing markets, we can judge that similarity of structure only after the fact.

See the menu page Analytical Methods for a rundown on where to go for information on Elliott wave analysis.

By Tim Bovee, Portland, Oregon, May 31, 2023

Disclaimer

Tim Bovee, Private Trader tracks the analysis and trades of a private trader for his own accounts. Nothing in this blog constitutes a recommendation to buy or sell stocks, options or any other financial instrument. The only purpose of this blog is to provide education and entertainment.

No trader is ever 100 percent successful in his or her trades. Trading in the stock and option markets is risky and uncertain. Each trader must make trading decisions for his or her own account, and take responsibility for the consequences.

License
Creative Commons License

All content on Tim Bovee, Private Trader by Timothy K. Bovee is licensed under a Creative Commons Attribution-ShareAlike 4.0 International License.

Based on a work at www.timbovee.com.