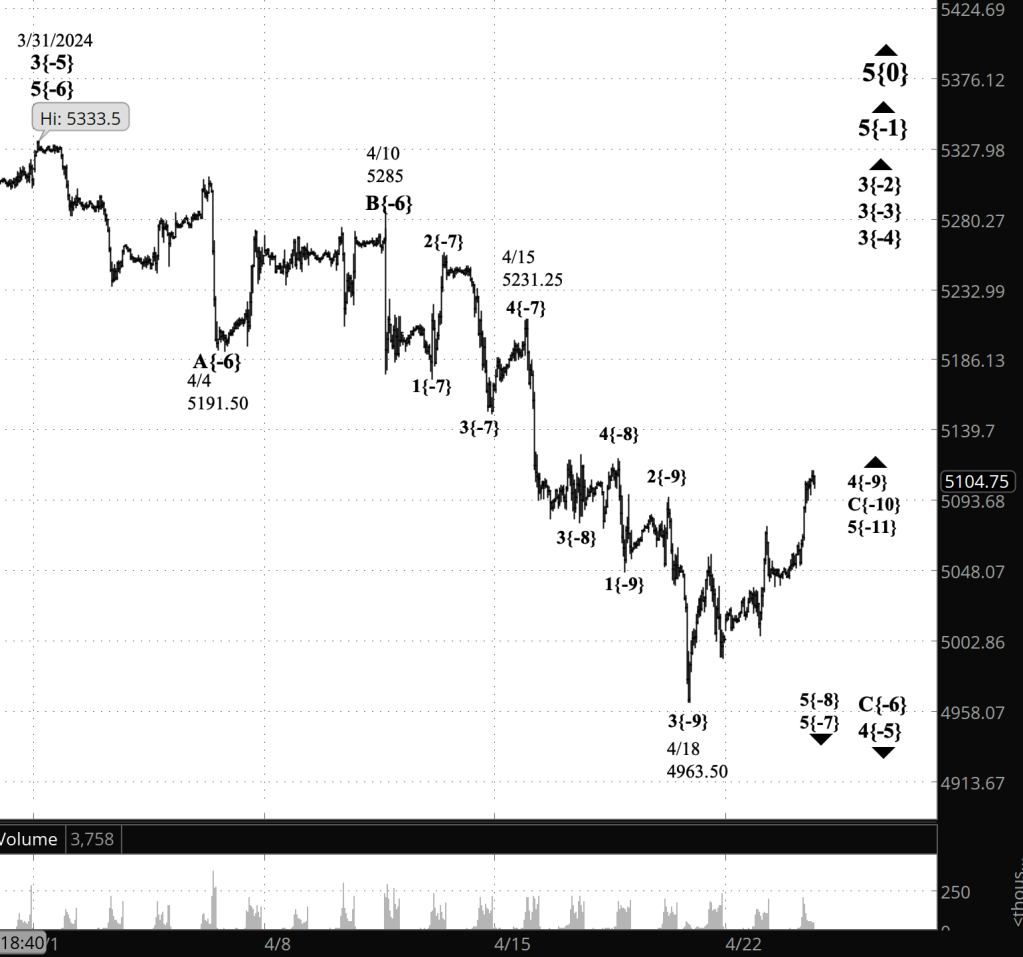
3:30 p.m. New York time
Half an hour before the closing bell. The S&P 500 futures continued to rise during the session, reaching into the 5140s. Elliott Wave Theory: The middle subwave — wave B — is continuing within the 4th-wave downward correction that began on April 23.
I’ve updated the chart.
9:35 a.m. New York time
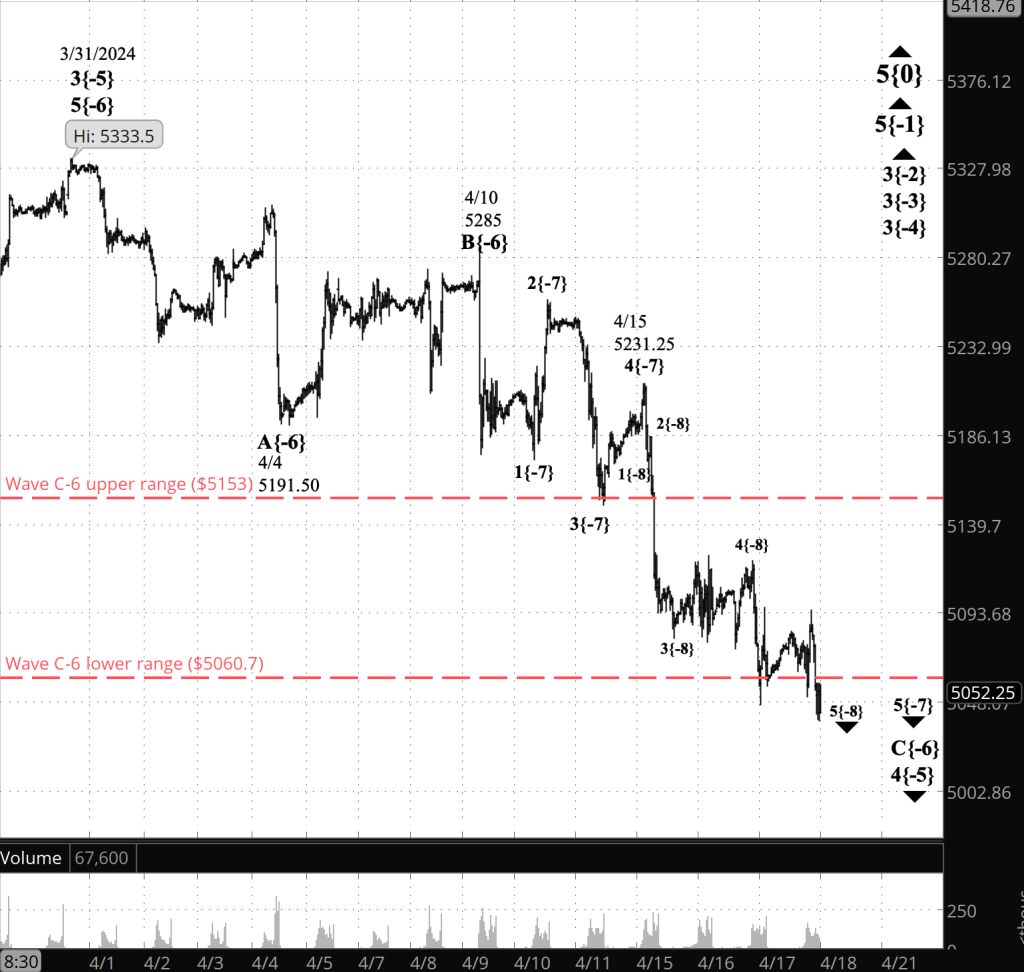
What’s happening now? The S&P 500 E-mini futures traded sideways with a downward lean, reaching into the 5110s, until the PCE price index was released, and then shot up to the 5140s in the span of two minutes, subsequently retreating back to the 5120s.
What does it mean? In Elliott Wave Theory, the rise that began on April 25 is a B wave, the middle wave of a 4th-wave downward correction that began on April 23. What does the rapid rise mean?
It depends. If the A wave that began on April 23 has three subwaves, then the 4th-wave correction is taking the form of a Flat and the extent of the B wave’s retracement of the A wave is normal behavior. If it has five subwaves, the correction is taking the form of a Zigzag and the outsized retracement beyond the start of the A wave violates a rule of Elliott Wave Theory, requiring that the analysis be revised.
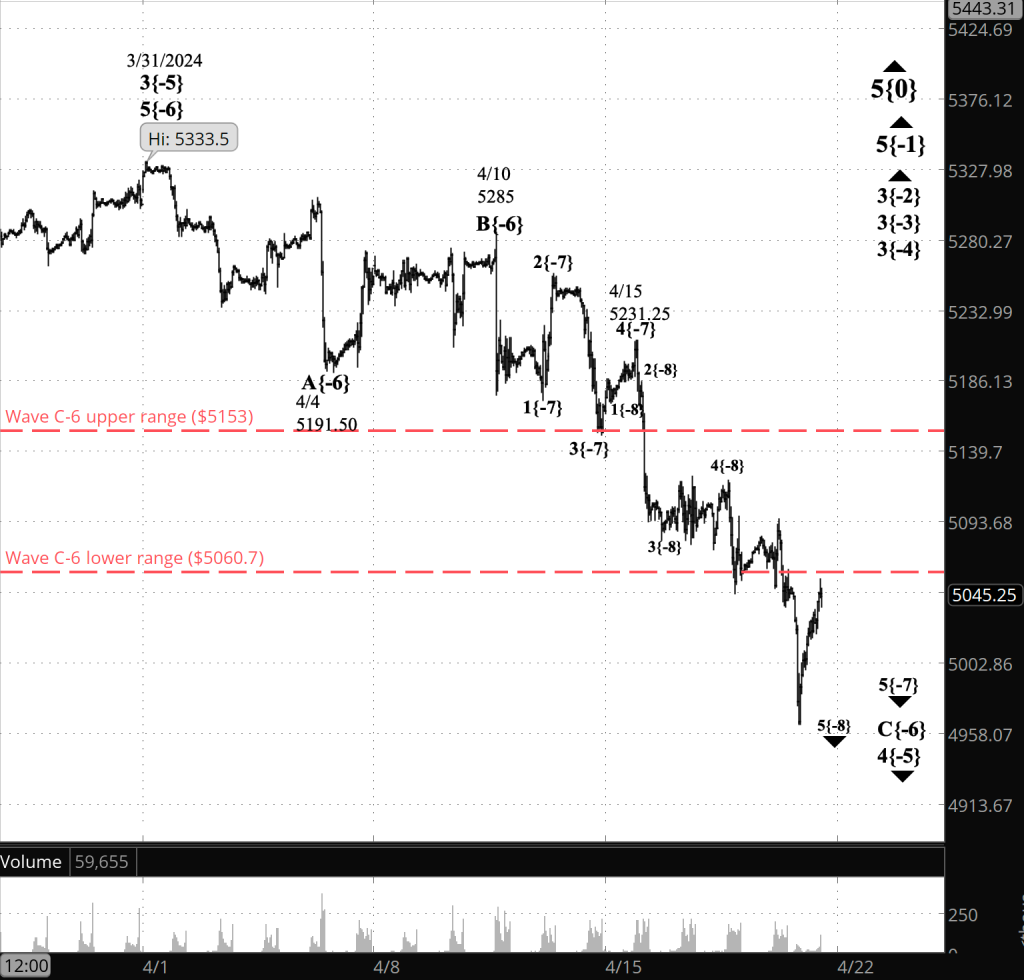
The table below provides a close-up of the correction so far,, with the two A-wave analyses, in green for the Flat scenario and red for the Zigzag scenario.
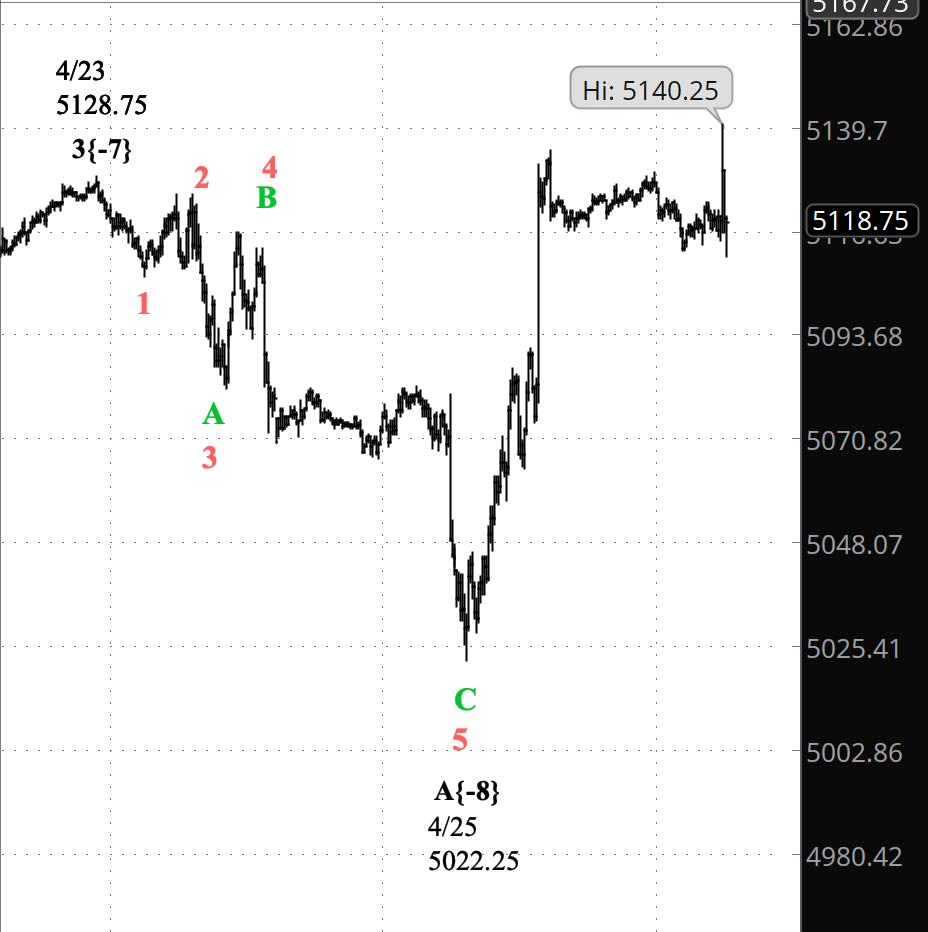
[S&P 500 E-mini futures at 9 a.m., 10-minute bars, with volume]
If the Flat scenario turns out to be the best match to the reality of the chart, then the principal analysis is unchanged from yesterday: Wave 4 is in its middle subwave, wave B. If the Zigzag scenario turns out to be the best match, then the new principal analysis will be that the 4th-wave downward correction ended on April 25 and a 5th-wave uptrend began.
For now I’m staying with the Flat correction scenario (the green marking on the chart). If the rising wave that began on April 25 turns out to have three subwaves, then that was the right call: Wave 4 is still underway. If rising wave has five subwaves, then Wave 4 ended on April 25 and wave 5 is underway.
What are the alternatives? The main ambiguity is covered in the discussion above.
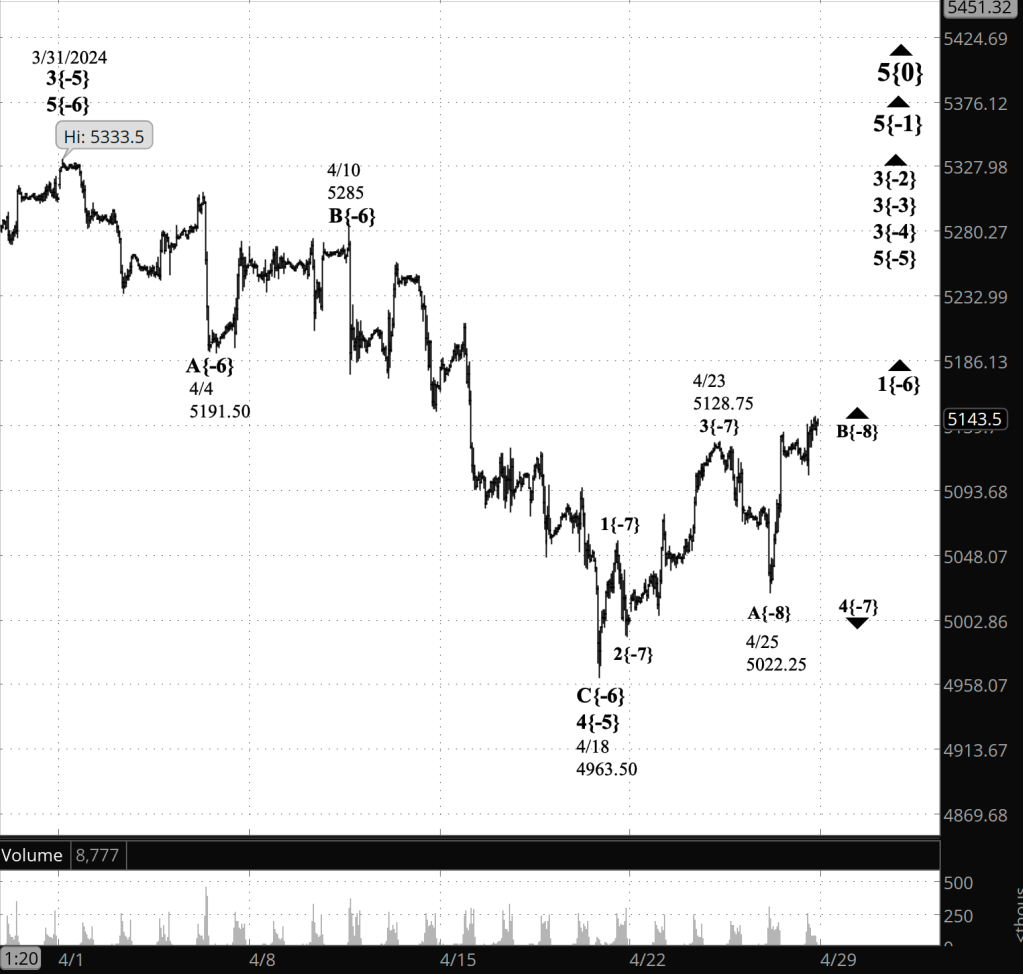
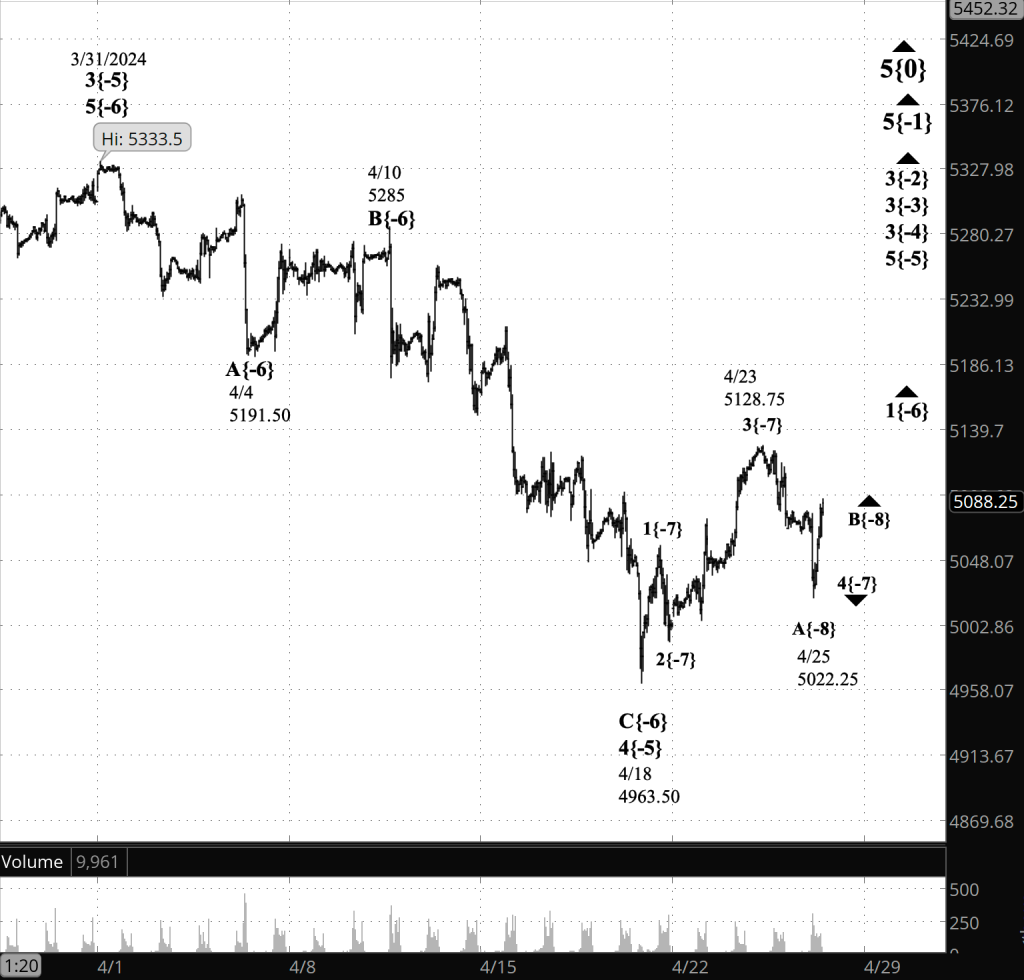
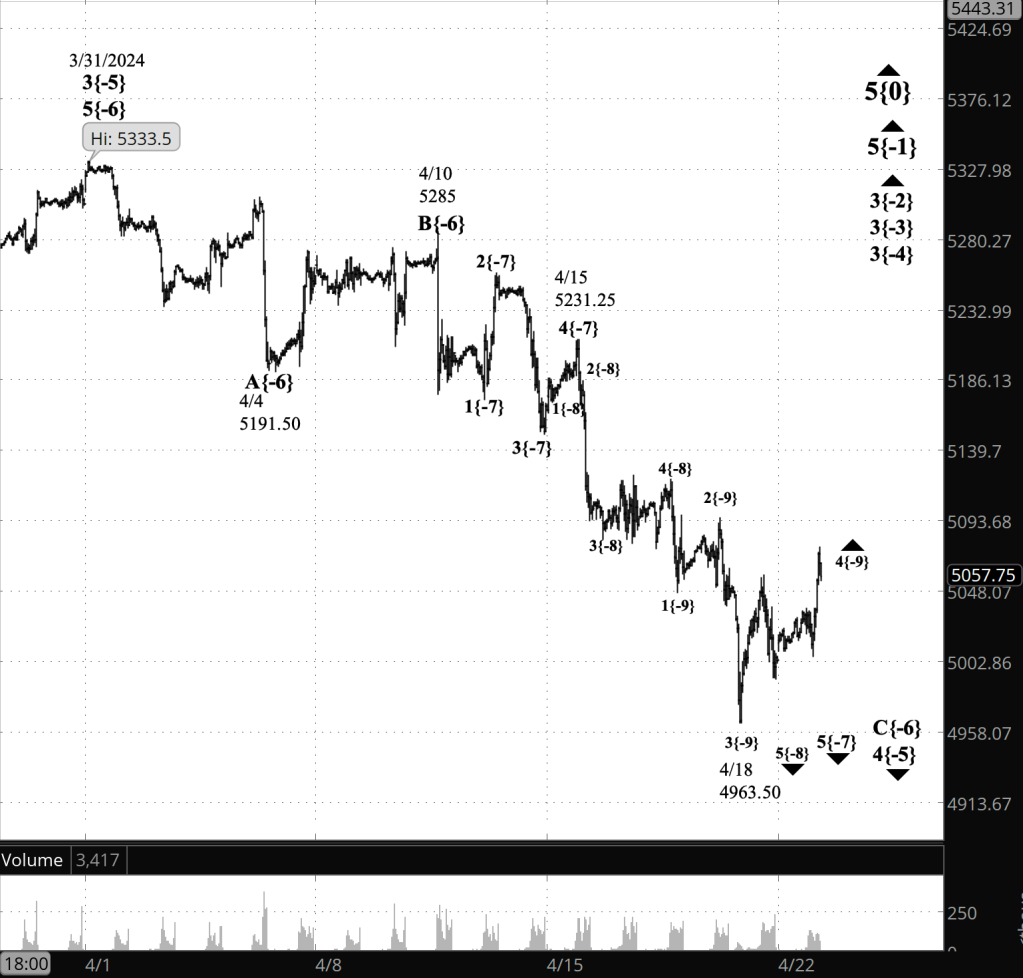
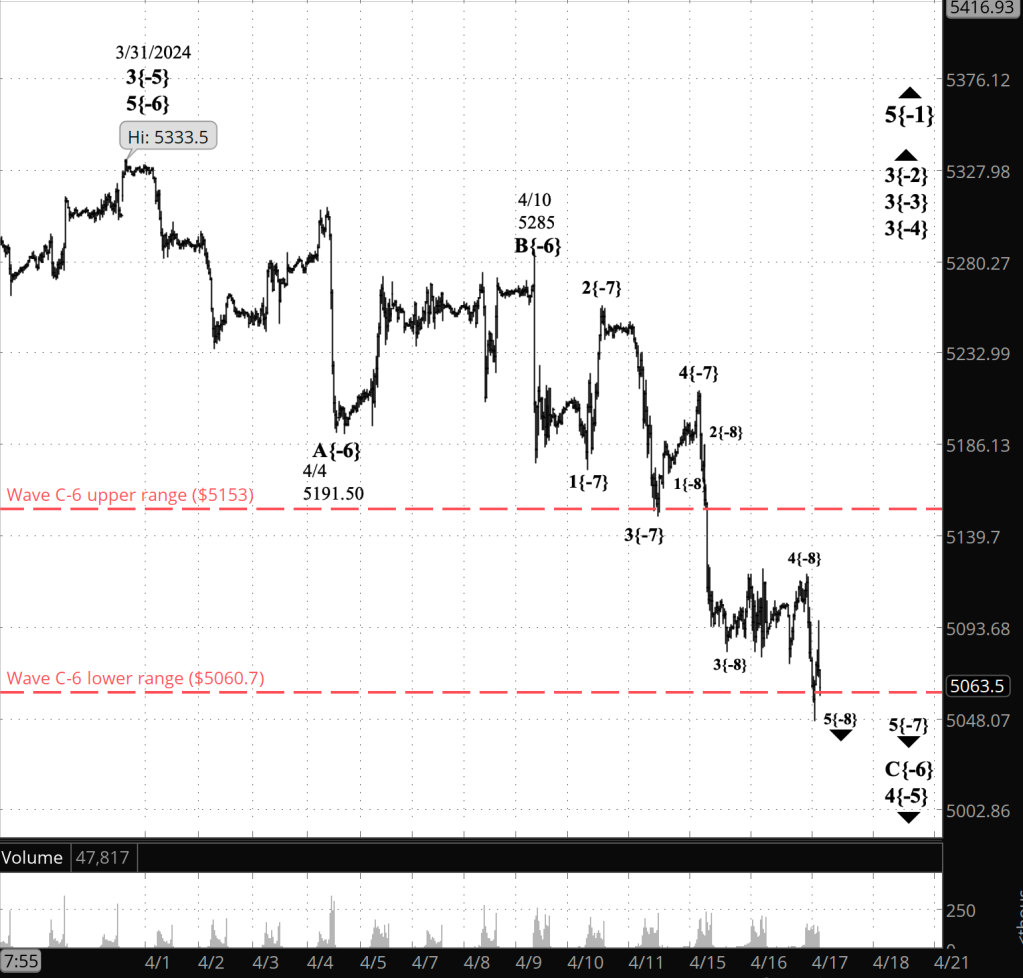
[S&P 500 E-mini futures at 3:30 p.m., 50-minute bars, with volume]
What does Elliott wave theory say? Here are the waves that underly the analyses.
Principal Analysis:
- Rising wave 5{0} is underway. It is a wave of Intermediate Degree that began in December 2018.
- It is in its final subwave, wave 5{-1}
- Within wave 5{-1}, rising waves 3{-2}, 3{-3} and 3{-4} are underway, as is wave 5{-5}.
- Uptrending wave 5{-5} is in its initial subwave, rising wave 1{-6}, which is in a declining subwave, wave 4{-7}.
- Wave 4{-7} is in its middle subwave, wave B{-8}
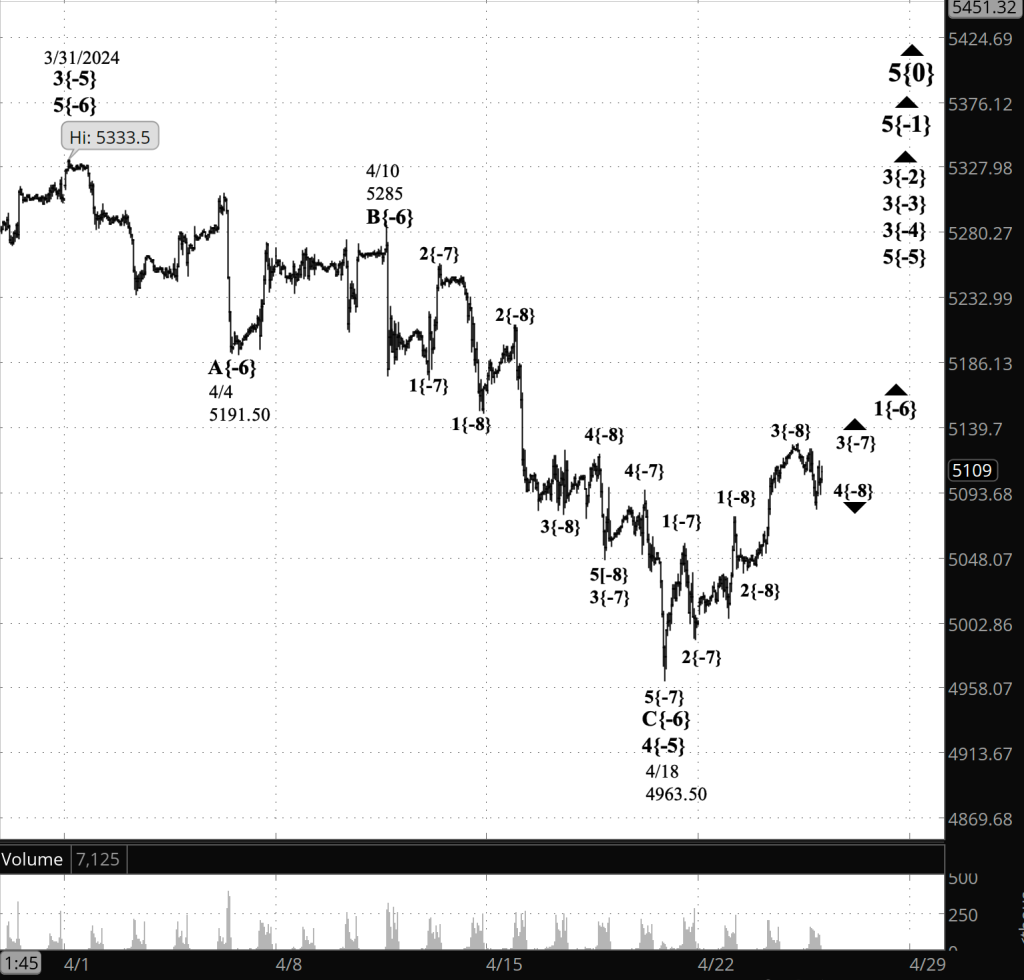
Alternative Analysis:
- Uptrending wave 5{-5} is in its initial subwave, rising wave 1{-6}, which is in an uptrend, wave 5{-7}.
Reading the chart. Price movements — waves – – in Elliott wave analysis are labeled with numbers within trending waves and letters with corrective waves. The subscripts — numbers in curly brackets — designate the wave’s degree, which, in Elliott wave analysis, means the relative position of a wave within the larger and smaller structures that make up the chart. R.N. Elliott, who in the 1930s developed the form of analysis that bears his name, viewed the chart as a complex structure of smaller waves nested within larger waves, which in turn are nested within still larger waves. In mathematics it’s called a fractal structure, where at every scale the pattern is similar to the others.
Learning and other resources. Elliott wave analysis provides context, not prophecy. As the 20th century semanticist Alfred Korzybski put it in his book Science and Sanity (1933), “The map is not the territory … The only usefulness of a map depends on similarity of structure between the empirical world and the map.” And I would add, in the ever-changing markets, we can judge that similarity of structure only after the fact.
See the menu page Analytical Methods for a rundown on where to go for information on Elliott wave analysis.
By Tim Bovee, Portland, Oregon, April 26, 2024
Disclaimer
Tim Bovee, Private Trader tracks the analysis and trades of a private trader for his own accounts. Nothing in this blog constitutes a recommendation to buy or sell stocks, options or any other financial instrument. The only purpose of this blog is to provide education and entertainment.
No trader is ever 100 percent successful in his or her trades. Trading in the stock and option markets is risky and uncertain. Each trader must make trading decisions for his or her own account, and take responsibility for the consequences.
License
All content on Tim Bovee, Private Trader by Timothy K. Bovee is licensed under a Creative Commons Attribution-ShareAlike 4.0 International License.
Based on a work at www.timbovee.com.

You must be logged in to post a comment.