11::10 a.m. New York time
I have re-worked my Elliott Wave analysis of the SPY chart to take of the issue that arose a couple of days ago, as described in the Live post of Aug. 21.
The SPY chart below covers one year with daily bars.
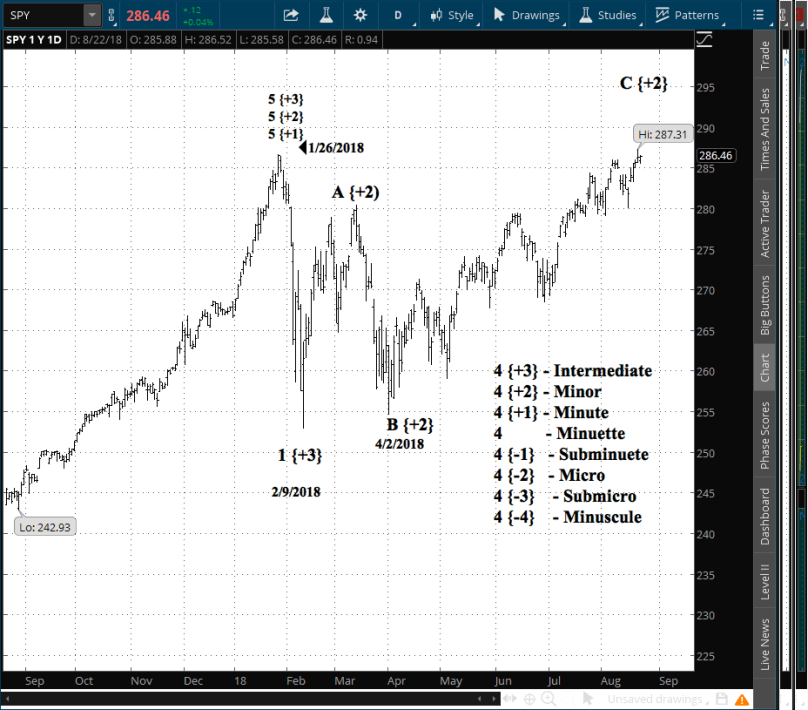
The difficulty came because I had counted the corrected since the bear market began on Jan. 26 as being a Zig-Zag — a directional correction with a 5-wave, 3-wave, 5-wave pattern. As it turns out out, the correction now analyzes as a Flat — a sieways correction — with a 3-wave, 3-wave, 5-wave pattern.
In my experience 2nd wave corrections, like this one, tend to be Zig-Zags. But it’s not a rule, and this one is marching to the beat of its own drummer.
Even so, my conclusion that the C wave is near an end remains intact. Also, my decision to exit yesterday is supported by the new wave count; the C wave may be nearing an end, but it could still have a good distance to go.
Or not. There’s no way to say.
I anticipate no trades today.
By Tim Bovee, Portland, Oregon, Aug. 22, 2018
Tim Bovee, Private Trader tracks the analysis and trades of a private trader for his own accounts. Nothing in this blog constitutes a recommendation to buy or sell stocks, options or any other financial instrument. The only purpose of this blog is to provide education and entertainment.
No trader is ever 100 percent successful in his or her trades. Trading in the stock and option markets is risky and uncertain. Each trader must make trading decisions for his or her own account, and take responsibility for the consequences.
License

All content on Tim Bovee, Private Trader by Timothy K. Bovee is licensed under a Creative Commons Attribution-ShareAlike 4.0 International License.
Based on a work at www.timbovee.com.L

[…] If that wraps up the countertrend correction then that is also the end of the 4th wave and we are now pushing upward on the 5th and final wave of the C wave of Minute degree that began in April. (See the chart posted yesterday.) […]
LikeLike