7:20 p.m. New York time
After the Fall
Given the magnitude of today’s events, I’m taking an analytical look at the S&P 500 now, freeing up my time for trading on Thursday.
The markets took a dramatic fall today, and the market news reports are filled with all sorts of reasons why. Which I ignore entirely. I focus on the charts and the options, and leave the news — always a trailing indicator — to others.
All of the major indexes took a tumble, although in the general scheme of things, it wasn’t The End of the World As We Know It — 3% plus change.
Today’s Book
Talking to My Daughter About the Economy: or How Capitalism Works — and How It Fails
by Yanis Varoufakis
World renowned economist, Greek parliamentarian, Minister of Finance of Greece — Yanis Varoufakis steps down from his Renaissance person resumé to the role of father, as he teaches his 13-year-old daughter about the core questions of our age: How the economy works, how things fall apart. Fundamentally, his topic is, How the World works. My first contact with Varoufakis in his economist role was The Global Minotaur, his 2015 discussion of the Great Recession, and what came before and after. I found it to be one of clearest and most insightful explanations I had read. Much has happened since. Such a lucky daughter! And lucky us, to have a chance to eavesdrop on their father-daughter conversation.
I’m going to show two charts. Both are Elliott wave analysis — big picture first and then up close second. The Elliott wave charts are for active traders, like me.
The first chart is a one-year chart of SPY, the S&P 500 exchange-traded fund, with a bar for each trading day.
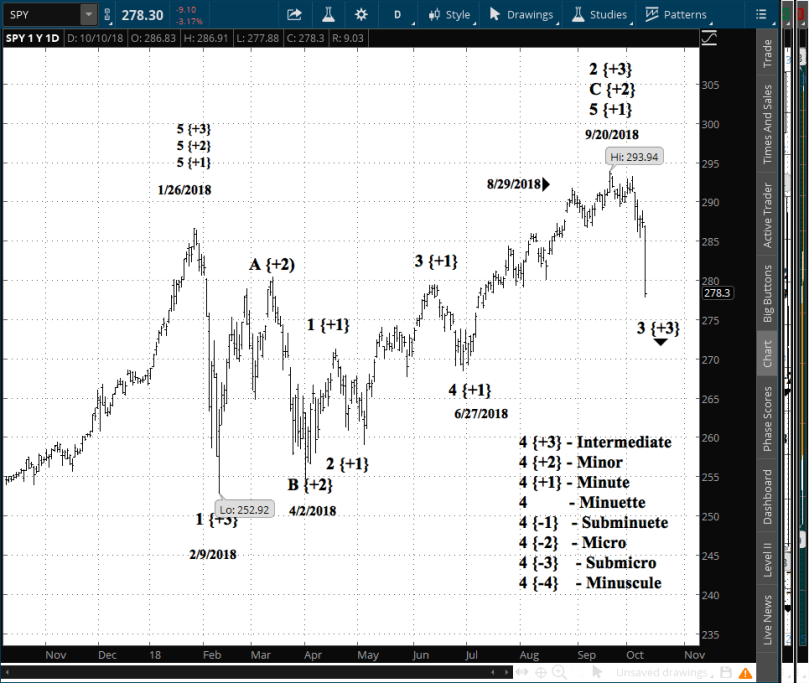
I’m happy to say that my analysis has stood up to the actual course of prices. This chart is unchanged from the last time I posted it, on Oct. 4. By this analysis, the decline from the peak on Sept. 20 is the beginning of a major downturn that will last a long time and cover a lot of distance, with the usual upward corrections to keep things interesting.
This is a 3rd wave of the Intermediate degree {+3}, which means it will typically be a very active wave that will cover lots of territory. The 2nd wave of the Intermediate last seven months, which shows the order of magnitude were looking at. The actually can vary significantly from that, especially if the 3rd wave shows an extended pattern.
The second chart, also of SPY and covering 30 days with 10-minute bars, shows the detail of what has happened since the Sept. 20 peak.
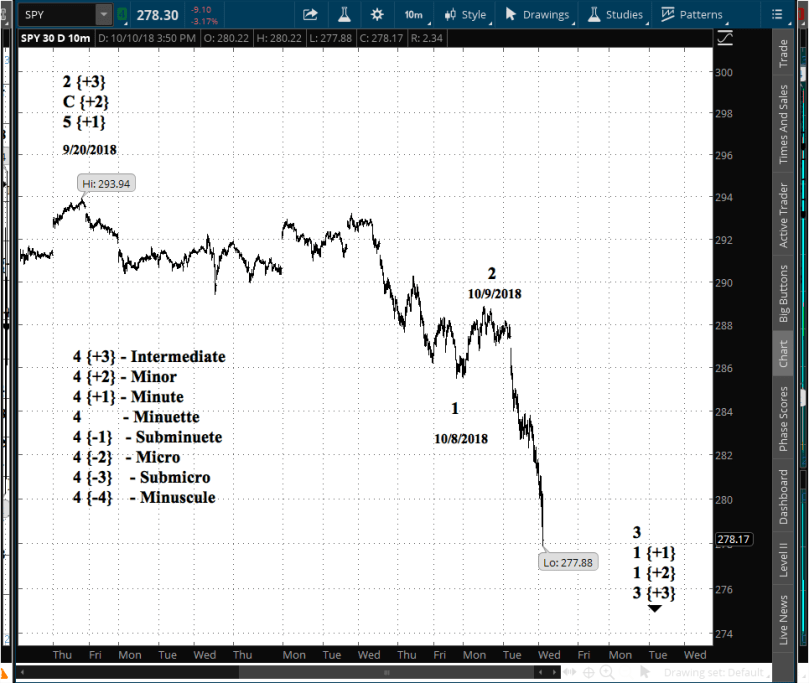
The chart shows that SPY has moved into a 3rd wave of a lower degree. I’ve labelled it as the Minuette degree, but it could be lower still. Time will tell.
The small degree 3rd wave could be almost complete, but it could also go lower still. Hard to tell this early in the game.
1:40 p.m. New York time
I have updated SPY with results.
1:20 p.m. New York time
I have exited SPY for a profit. The debit was $1.17, or 62% of maximum potential profit.
11:15 a.m. New York time
I have entered a short iron fly position on WBA. My plan was to enter one position today, and having done so, I shall pass on the other prospect, DAL, without further analysis.
10 a.m. New York time
I have two prospective earnings plays on my desk this morning: DAL and WBA. Both have similar implied volatility ranks, a bit above 50%. My intent is to select one for a trade. WBA is the larger company, so I’ll analyze it first.
No exits in sight among my options positions. SPY is closest at 39% of maximum potential profit; the exit target is 50% of max.
| sym | option debit | share price | curr % max profit | net prft/shr $ | option days left |
| EWZ | 1.12 | 38.76 | (30.2) | (0.26) | 37 |
| JBL | 2.03 | 24.56 | (48.2) | (0.66) | 9 |
| LEN | 3.27 | 44.49 | (1.2) | (0.04) | 37 |
| SPY | 1.87 | 285.99 | 39.1 | 1.20 | 37 |
| STZ | 10.55 | 226.30 | (25.6) | (2.15) | 37 |
Here’s how my shares positions stand.
| sym | share price | net result % | net profit $ | days held |
| AAPL | 225.04 | 0.5% | 1.08 | 26 |
| CHK | 4.80 | 20.0% | 0.80 | 26 |
| FXI | 40.30 | -2.2% | (0.91) | 26 |
| SPXU | 33.85 | -16.5% | (6.71) | 148 |
| TSLA | 258.53 | -15.2% | (46.46) | 9 |
| VNQI | 54.11 | -4.8% | (2.70) | 27 |
By Tim Bovee, Portland, Oregon, Oct. 10, 2018
Tim Bovee, Private Trader tracks the analysis and trades of a private trader for his own accounts. Nothing in this blog constitutes a recommendation to buy or sell stocks, options or any other financial instrument. The only purpose of this blog is to provide education and entertainment.
No trader is ever 100 percent successful in his or her trades. Trading in the stock and option markets is risky and uncertain. Each trader must make trading decisions for his or her own account, and take responsibility for the consequences.
License

All content on Tim Bovee, Private Trader by Timothy K. Bovee is licensed under a Creative Commons Attribution-ShareAlike 4.0 International License.
Based on a work at www.timbovee.com.L

[…] an update to Wednesday’s Live feed, I posted an analysis of the S&P 500 last night, in the wake of a sharp one-day decline in the markets. I concluded […]
LikeLike