9:35 a.m. New York time
What’s happening now? The S&P 500 reversed at 2885, the new peak of the present uptrend, and began to decline.
What does it mean? It’s unclear. There is no certainty that the upward correction that began March 22 is complete. Nor is there any indication that it’s not complete. What is clear is that once the correction is complete, the S&P 500 will resume the decline to below 2174, where the correction began, and perhaps significantly below that point.
What does Elliott wave theory say? The Intermediate C wave’s rise from March 22 carried the S&P 500 to a 61.8% retracement of the preceding A wave. The price shot slightly above that Fibonacci level, dithered there for a couple of days, and then before the closing bell today declined in — so far — three waves. All of this is happening within the Primary 2nd wave to the upside of the Cycle 1st wave to the downside.
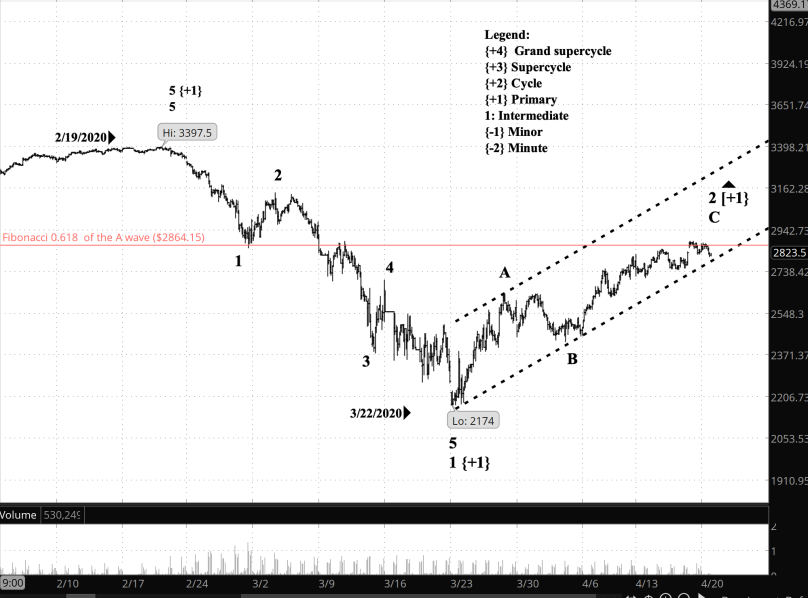
I had counted the C wave as a nine-wave extension, and I think that’s unnecessary at best, incorrect at the worst. (The chart can be seen in Friday’s post.) It will count nicely as the common five-wave pattern, and applying Occam’s razor, that’s how I shall count it. That places the price in the Minor 5th wave of the Intermediate C, which means that the correction, if C is part of a zigzag pattern, is nearing its end. A zigzag is common in 2nd waves. The Fibonacci 61.8% retracement is a not uncommon ending point for a 2nd wave. The C wave has satisfied all of its requirements — five subwaves, 3rd wave not the shortest — and so today’s early decline may be the beginning of the Primary 3rd wave to the downside.
What is the alternative?
The 2nd wave channel suggests that there may be more upside to come. The C wave has yet to return to the channel’s upper boundary, which would be at 3272 today, rising about 40 points each subsequent day. There’s no requirement that a rising wave end at the upper boundary, but it often does, or at least approaches it, and the 5th wave is quite a distance from the top of the channel. A decisive break below the channel boundary, about 2790 today, would suggest that the Primary 3rd wave has begun, and a fall below 2174 would confirm it.
What about my trades? Time is not my friend with these short bear call options spreads on SPY: Lots 12, 13 and 14. They all expire May 15, which is 25 days away. The day to manage winners — 21 days before expiration — comes on Friday, and after that date my in-the-money options have a greater chance of involuntary assignment, complicating my record-keeping a bit. At this point the positions are about half a percent above maximum loss at expiration, so it is in my interest to hang on them and see what happens. (The lot numbers link to the entry analyses.)
Terminology. Here are some links to information about some of the technical jargon I use.
By Tim Bovee, Portland, Oregon, April 20, 2020
Disclaimer
Tim Bovee, Private Trader tracks the analysis and trades of a private trader for his own accounts. Nothing in this blog constitutes a recommendation to buy or sell stocks, options or any other financial instrument. The only purpose of this blog is to provide education and entertainment.
No trader is ever 100 percent successful in his or her trades. Trading in the stock and option markets is risky and uncertain. Each trader must make trading decisions for his or her own account, and take responsibility for the consequences.
License

All content on Tim Bovee, Private Trader by Timothy K. Bovee is licensed under a Creative Commons Attribution-ShareAlike 4.0 International License.
Based on a work at www.timbovee.com.

You must be logged in to post a comment.