10:55 a.m. New York time
What’s happening now? The S&P 500 pierced 2885, the prior high, attained on April 16, within its correction to the upside within a larger downtrend that began February 19. After peaking at 2913.50, it then reversed and moved back below the level of the prior high. (The piercing is marked with a yellow oval.)
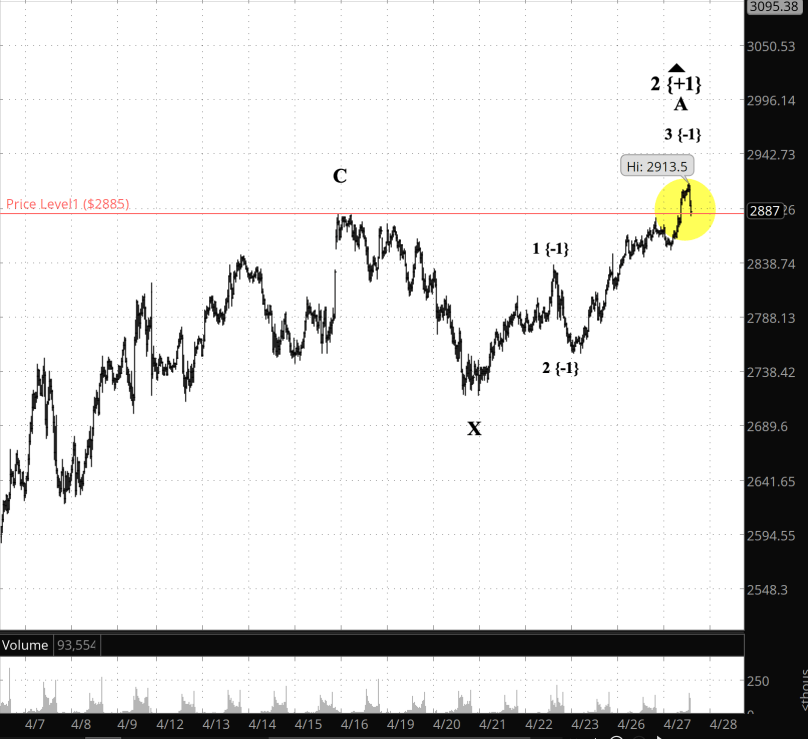
What does it mean? The upward correction is extending. The first portion took 24 days to complete, and although it is not guaranteed, the second portion will likely take a similar period to complete its work.
What does Elliott wave theory say? The piercing of 2885 broke a firm rule in Elliott wave theory: A second wave cannot move beyond the beginning of the 1st wave that preceded it. Since it was pierced, then the hypothesis that the 3rd wave of Primary degree to the downside is underway has been discredited. The Primary 2nd wave has developed into a combination. The first portion — A, B, C — of Intermediate degree was followed by a rather shallow X wave, which separates the portions, and will likely be followed by either a Flat or another Zigzag. Within the current movement, the count of the Intermediate A wave is complete, and the pullback suggests the possibility that a B wave to the downside has begun. Wave B will be followed by a wave C.
What is the alternative? I’ve got nothing at this point. The piercing of the 2885 level makes the preferred count quite clear.
What about my trades? I hold three short bear call options spread positions on SPY: Lots 12, 13 and 14, all expiring May 15. (The lot numbers link to the entry analyses.) The development of a combination pattern within the 2nd wave correction guarantees that the positions will produce losses.
My best bet will be to exit at the end of wave B. Wave A began at 2717.25. If the present pattern is a Zigzag, then a move below 2717.25 will violate a rule of Elliott wave analysis, and something other than a Zigzag is developing. If the price fails to retrace 90% or more of wave A, down around 2730, then it is a Zigzag. So a Flat will give me the best chance to mitigate my losses, and a Zigzag could well give me some good mitigation.
Holding on here. Waiting is.
Terminology. Here are some links to information about some of the technical jargon I use.
On the charts, waves have a subscript showing the degree above or below the Intermediate degree. Here are the subscripts and the degree each represents:
- {+3} Supercycle
- {+2} Cycle
- {+1} Primary
- No subscript: Intermediate
- {-1} Minor
- {-2} Minute
- {-3} Minuette
By Tim Bovee, Portland, Oregon, April 28, 2020
Disclaimer
Tim Bovee, Private Trader tracks the analysis and trades of a private trader for his own accounts. Nothing in this blog constitutes a recommendation to buy or sell stocks, options or any other financial instrument. The only purpose of this blog is to provide education and entertainment.
No trader is ever 100 percent successful in his or her trades. Trading in the stock and option markets is risky and uncertain. Each trader must make trading decisions for his or her own account, and take responsibility for the consequences.
License

All content on Tim Bovee, Private Trader by Timothy K. Bovee is licensed under a Creative Commons Attribution-ShareAlike 4.0 International License.
Based on a work at www.timbovee.com.

You must be logged in to post a comment.