9:55 a.m. New York time
What’s happening now? The S&P 500 bumped against the Fibonacci 61.8% retracement of its fall that began February 19. The index peak in the rise beginning March 22 is 2926.75, just below the 2930.12 Fibonacci point.
What does it mean? The 61.8% retracement level is often a place where market movements pause or reverse. I have long considered
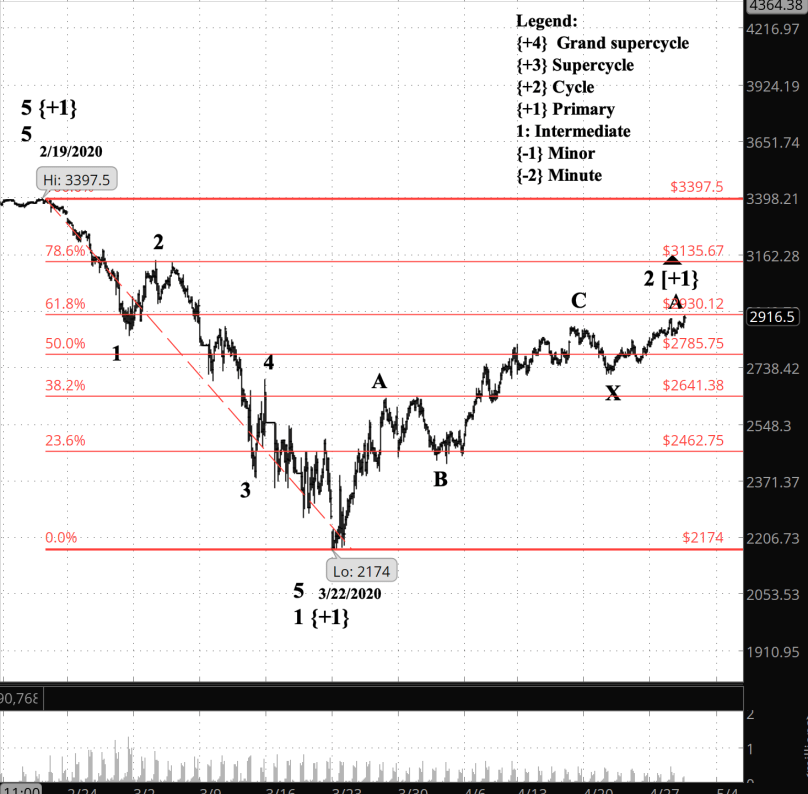
What does Elliott wave theory say? The rise is wave 2 of Primary degree within wave 1 of cycle degree. Structurally, it is part of a complex upward correction within the larger downtrend. The first part of the correction had a Zigzag form. If the present leg up — Intermediate wave A within Primary wave 2 — peaks around the 61.8% retracement level, then it will have a Flat form. Once the present A wave is followed by B and C waves, it may mark the end of the upward correction, or it the movement could extend yet again.
In my experience this sort of complexity is a bit unusual in 2nd waves. Not unheard of, but 2nd waves tend to be simple Zigzags, leaving the fancy morphologies to 4th waves.
What is the alternative? A move beyond the start of Primary wave 1, at 3397.50, would mean that we aren’t in Primary wave 2 and something else is happening. It would demand a major recount.
What about my trades? It is 16 days before my three short bear call options spread positions on SPY expire: Lots 12, 13 and 14, all expiring May 15. (The lot numbers link to the entry analyses.) Their current status ranges from 12% to 17% above maximum potential loss. So what makes sense is to hold until they either fall below or expire for 100% of maximum loss.
Learning and other resources. Elliott Wave International has long been the leading analytical house based on Elliott wave theory. They make available a number of free educational materials and other resources, in addition to their for-pay subscriptions.
Terminology. Here are some links to information about some of the technical jargon I use.
Charts. On my charts, waves have a subscript showing the degree above or below the Intermediate degree. Here are the subscripts and the degree each represents:
- {+3} Supercycle
- {+2} Cycle
- {+1} Primary
- No subscript: Intermediate
- {-1} Minor
- {-2} Minute
- {-3} Minuette
By Tim Bovee, Portland, Oregon, April 29, 2020
Disclaimer
Tim Bovee, Private Trader tracks the analysis and trades of a private trader for his own accounts. Nothing in this blog constitutes a recommendation to buy or sell stocks, options or any other financial instrument. The only purpose of this blog is to provide education and entertainment.
No trader is ever 100 percent successful in his or her trades. Trading in the stock and option markets is risky and uncertain. Each trader must make trading decisions for his or her own account, and take responsibility for the consequences.
License

All content on Tim Bovee, Private Trader by Timothy K. Bovee is licensed under a Creative Commons Attribution-ShareAlike 4.0 International License.
Based on a work at www.timbovee.com.

You must be logged in to post a comment.