10 a.m. New York time
What’s happening now? My focus today is be on the rise of the S&P 500 from May 14 that may have ended on May 19. For a broader view, see Tuesday’s Live post.
What does it mean? The internal count of the rise from May 14 shows that it has traced the minimum steps required for me to declare it complete. That assessment will stand as long as the price remains below the May 19 high, 2976.25.
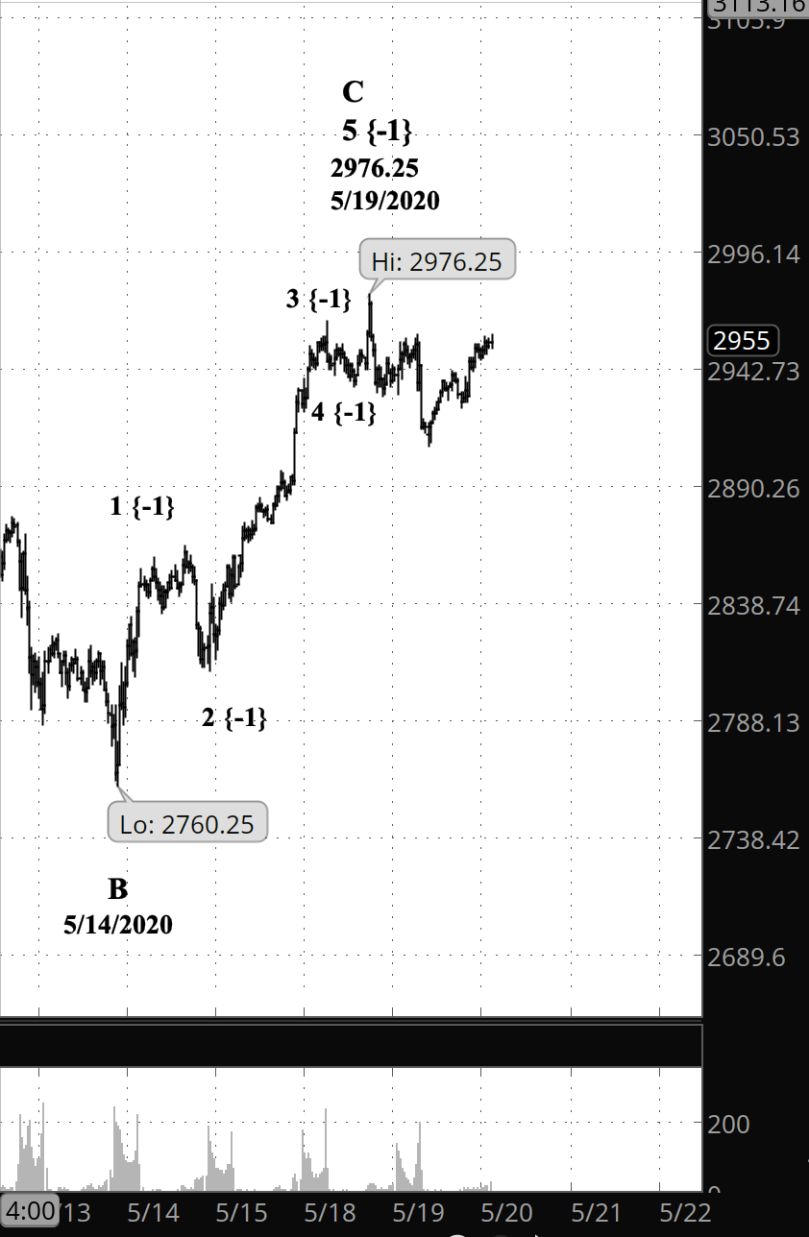
What does Elliott wave theory say? The rise from May 14 to May 19 is a C wave of Intermediate degree, with five subwaves, suggesting that the next move will be down.
What is the alternative? A rise above 2976.25 means wave C is still underway. A decline means that either declining wave 3 of Primary degree has begun, or a declining wave X of Intermediate degree is a prelude to a third component of the present 2nd wave combination structure.
What about my trades? I’m holding my shares of SDS, which profit when the market falls, until the end of Intermediate wave 3 to the downside. My overall goal is to exit before Primary wave 2 to the upside begins.
Learning and other resources. Elliott Wave International has long been the leading analytical house based on Elliott wave theory. They make available a number of free educational materials and other resources, in addition to their for-pay subscriptions.
I recommend two books, both by people associated with EWI.
First, Elliott Wave Principle by Robert Prechter and A.J. Frost is the book that, along with Prechter’s analyses, that created the revival of Elliott wave theory. I first read it in 1984, and it has had a profound influenced on my thinking about markets ever since.
Second, I’ve found Visual Guide to Elliott Wave Trading by Wayne Gorman and Jeffrey Kennedy, both of EWI, to be a useful book that relates Elliott wave theory to practical trading. The authors are hands-on Elliotticians, and for an active trader, that’s exactly what’s needed — less theory and more how-to. The first chapter of the book gives a very nice thumbnail run down of what Elliott wave theory is all about.
Terminology. Here are some links to information about some of the technical jargon I use.
Charts. On my charts, waves have a subscript showing the degree above or below the Intermediate degree. Here are the subscripts and the degree each represents:
- {+3} Supercycle
- {+2} Cycle
- {+1} Primary
- No subscript: Intermediate
- {-1} Minor
- {-2} Minute
- {-3} Minuette
By Tim Bovee, Portland, Oregon, May 20, 2020
Disclaimer
Tim Bovee, Private Trader tracks the analysis and trades of a private trader for his own accounts. Nothing in this blog constitutes a recommendation to buy or sell stocks, options or any other financial instrument. The only purpose of this blog is to provide education and entertainment.
No trader is ever 100 percent successful in his or her trades. Trading in the stock and option markets is risky and uncertain. Each trader must make trading decisions for his or her own account, and take responsibility for the consequences.
License

All content on Tim Bovee, Private Trader by Timothy K. Bovee is licensed under a Creative Commons Attribution-ShareAlike 4.0 International License.
Based on a work at www.timbovee.com.

You must be logged in to post a comment.