11:35 a.m. New York time
What’s happening now? I will confess, the little sideways track of the E-mini S&P 500 futures, looking like a snail’s trail, has left me in analytical uncertainty. So let’s pull back to what we do know. The S&P 500 has one more push to the upside before the correction has run its course.
What does it mean? The unknown is the form the rest of the correction will take. It has already stretched out over time, and the upward push could be followed by more of the correction, or a significant decline that will drop below the starting point of the correction, 2174, on March 22. In any case, the price will remain below 3997.50, the level that saw the beginning of the crash on February 19.
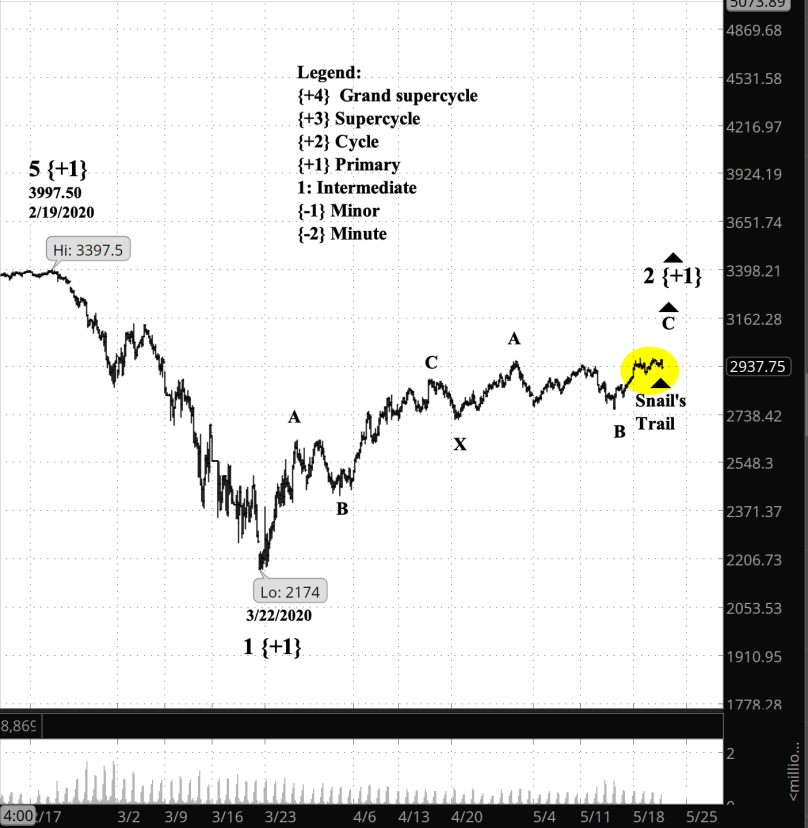
What does Elliott wave theory say? The present correction is wave 2 of Primary degree and, unusually for a 2nd wave, it has traced a combination, composed of a Zigzag followed by a Flat. Completion of the present wave C of Intermediate degree will either mark the end of Primary 2, which means the start of Primary 3 and powerful decline, or extend the correction with yet another corrective pattern, which means more upside. Can’t say which at this point.
What is the alternative? The third possibility comes into play if the unthinkable happens, and the present Primary 2nd wave moves above the start of the Primary 1st. As my cheatsheet of Elliott rules puts it, “If the wave moves beyond the start of wave 1, then it’s not wave 2”. That’s not guidance but an unbreakable reality of Elliott. So in that case, the entire adventure from February 19 down to the March 22 low was a lower degree correction to the higher degree uptrend that has been with us for eight decades.
What about my trades? No options are in my account at present. My shares in SDS profit when the S&P 500 goes down and loses when it rises.
Learning and other resources. Elliott Wave International has long been the leading analytical house based on Elliott wave theory. They make available a number of free educational materials and other resources, in addition to their for-pay subscriptions.
I recommend two books, both by people associated with EWI.
First, Elliott Wave Principle by Robert Prechter and A.J. Frost is the book that, along with Prechter’s analyses, that created the revival of Elliott wave theory. I first read it in 1984, and it has had a profound influenced on my thinking about markets ever since.
Second, I’ve found Visual Guide to Elliott Wave Trading by Wayne Gorman and Jeffrey Kennedy, both of EWI, to be a useful book that relates Elliott wave theory to practical trading. The authors are hands-on Elliotticians, and for an active trader, that’s exactly what’s needed — less theory and more how-to. The first chapter of the book gives a very nice thumbnail run down of what Elliott wave theory is all about.
Terminology. Here are some links to information about some of the technical jargon I use.
Charts. On my charts, waves have a subscript showing the degree above or below the Intermediate degree. Here are the subscripts and the degree each represents:
- {+3} Supercycle
- {+2} Cycle
- {+1} Primary
- No subscript: Intermediate
- {-1} Minor
- {-2} Minute
- {-3} Minuette
By Tim Bovee, Portland, Oregon, May 21, 2020
Disclaimer
Tim Bovee, Private Trader tracks the analysis and trades of a private trader for his own accounts. Nothing in this blog constitutes a recommendation to buy or sell stocks, options or any other financial instrument. The only purpose of this blog is to provide education and entertainment.
No trader is ever 100 percent successful in his or her trades. Trading in the stock and option markets is risky and uncertain. Each trader must make trading decisions for his or her own account, and take responsibility for the consequences.
License

All content on Tim Bovee, Private Trader by Timothy K. Bovee is licensed under a Creative Commons Attribution-ShareAlike 4.0 International License.
Based on a work at www.timbovee.com.

You must be logged in to post a comment.