10:10 a.m. New York time
What’s happening now? The S&P 500 E-mini futures peaked overnight at 3035 and then began an energetic decline.
What does it mean? It could be that 3035 marks the end of the correction that began on March 22. Maybe. There are still some ambiguities.
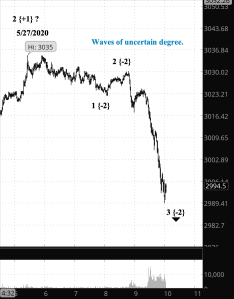
What does Elliott wave theory say? The possibly final leg of Primary wave 2 to the upside appears to have met the requirements, with sufficient ambiguity for me to add a question mark. If the 3035 high indeed is the end of Primary wave 2, then the subsequent decline is the very early stage, at the Minute or perhaps Minuette degrees, of a powerful Primary 3 decline. The final Intermediate wave C of Primary wave 2 covered 131.25 points, or 4.5%.
What is the alternative? I’m uncertain whether the peak is a 3rd wave or a 5th terminus. If 5th, then the correction is likely over. If 3rd, then there’s more upside to go.
What about my trades? No options are in my account at present. My shares in SDS profit when the S&P 500 goes down and loses when it rises.
Learning and other resources. Elliott Wave International has long been the leading analytical house based on Elliott wave theory. They make available a number of free educational materials and other resources, in addition to their for-pay subscriptions.
I recommend two books, both by people associated with EWI.
First, Elliott Wave Principle by Robert Prechter and A.J. Frost is the book that, along with Prechter’s analyses, that created the revival of Elliott wave theory. I first read it in 1984, and it has had a profound influenced on my thinking about markets ever since.
Second, I’ve found Visual Guide to Elliott Wave Trading by Wayne Gorman and Jeffrey Kennedy, both of EWI, to be a useful book that relates Elliott wave theory to practical trading. The authors are hands-on Elliotticians, and for an active trader, that’s exactly what’s needed — less theory and more how-to. The first chapter of the book gives a very nice thumbnail run down of what Elliott wave theory is all about.
Terminology. Here are some links to information about some of the technical jargon I use.
Charts. On my charts, waves have a subscript showing the degree above or below the Intermediate degree. Here are the subscripts and the degree each represents:
- {+3} Supercycle
- {+2} Cycle
- {+1} Primary
- No subscript: Intermediate
- {-1} Minor
- {-2} Minute
- {-3} Minuette
By Tim Bovee, Portland, Oregon, May 27, 2020
Disclaimer
Tim Bovee, Private Trader tracks the analysis and trades of a private trader for his own accounts. Nothing in this blog constitutes a recommendation to buy or sell stocks, options or any other financial instrument. The only purpose of this blog is to provide education and entertainment.
No trader is ever 100 percent successful in his or her trades. Trading in the stock and option markets is risky and uncertain. Each trader must make trading decisions for his or her own account, and take responsibility for the consequences.
License

All content on Tim Bovee, Private Trader by Timothy K. Bovee is licensed under a Creative Commons Attribution-ShareAlike 4.0 International License.
Based on a work at www.timbovee.com.

You must be logged in to post a comment.