11:35 a.m. New York time
The S&P 500 E-mini futures traded briefly this morning, despite the stock and bond market holiday in observation of the U.S. Independence Day. So, let’s analyze.
What’s happening now? The S&P 500 E-mini futures completed their corrective within the downtrend that resumed on June 8. The correction peak was 3156.50, attained on July 2.
What does it mean? I expect the resumption of the decline to be of significant scale. Today the impact would be described as shaking the confidence of the markets. Back in the day traders would have thought it in more color terms: “It’ll scare the bejesus out of the markets. It’ll scare their pants off”.
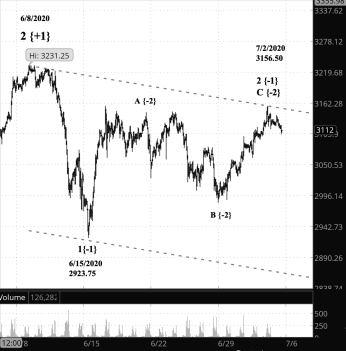
What does Elliott wave theory say? The decline that began June 8 is Intermediate wave 1 within Primary wave 3. The rise that began on June 15 from 2923.75 is Minor wave 2 within Primary 3. And the peak of July 2 marks the beginning of Minor wave 3 within Primary wave 3. A 3rd of 3rd tends to be powerful.
All of this is happening within the 1st wave down of Cycle degree. So there’s a lot of down that lies ahead of us.
The channel, based on the start points of Minor waves 1 and 3, suggests that the Minor degree decline will carry the price down to the 2850 level or lower.
What is the alternative? It’s possible that the drop after the July 2 peak is a head fake, a whipsaw, an event loathed by all traders. If it is, then Minor wave 2 is still underway. A decline below 2923.75 will confirm that Minor wave 3 is truly underway.
What about my trades? I’m already positioned on my stocks, an inverse S&P 500 exchange traded fund with the ticker SDS. It possible that Minor wave 3 will be playable with options, as short bear call spreads. I’ll take a look at it after the holiday.
Learning and other resources. Elliott Wave International has long been the leading analytical house based on Elliott wave theory. They make available a number of free educational materials and other resources, in addition to their for-pay subscriptions.
I recommend two books, both by people associated with EWI.
First, Elliott Wave Principle by Robert Prechter and A.J. Frost is the book that, along with Prechter’s analyses, that created the revival of Elliott wave theory. I first read it in 1984, and it has had a profound influenced on my thinking about markets ever since.
Second, I’ve found Visual Guide to Elliott Wave Trading by Wayne Gorman and Jeffrey Kennedy, both of EWI, to be a useful book that relates Elliott wave theory to practical trading. The authors are hands-on Elliotticians, and for an active trader, that’s exactly what’s needed — less theory and more how-to. The first chapter of the book gives a very nice thumbnail run down of what Elliott wave theory is all about.
Terminology. Here are some links to information about some of the technical jargon I use.
Charts. On my charts, waves have a subscript showing the degree above or below the Intermediate degree. Here are the subscripts and the degree each represents:
- {+3} Supercycle
- {+2} Cycle
- {+1} Primary
- No subscript: Intermediate
- {-1} Minor
- {-2} Minute
- {-3} Minuette
By Tim Bovee, Portland, Oregon, July 3, 2020
Disclaimer
Tim Bovee, Private Trader tracks the analysis and trades of a private trader for his own accounts. Nothing in this blog constitutes a recommendation to buy or sell stocks, options or any other financial instrument. The only purpose of this blog is to provide education and entertainment.
No trader is ever 100 percent successful in his or her trades. Trading in the stock and option markets is risky and uncertain. Each trader must make trading decisions for his or her own account, and take responsibility for the consequences.
License

All content on Tim Bovee, Private Trader by Timothy K. Bovee is licensed under a Creative Commons Attribution-ShareAlike 4.0 International License.
Based on a work at www.timbovee.com.

[…] happening now? Contrary to my conclusion on Friday, the S&P 500 E-mini futures still had some upside left, by about 16 […]
LikeLike