4:30 p.m. New York time
December 1974 wasn’t an exciting month. Sen. Gerald Ford had taken his oath as president four months earlier, upon the resignation of Pres. Richard Nixon. The year whose end was drawing near would see an inflation rate of 11.1%. It seemed high, and it was high, eight times higher than it had been a decade earlier. No then new that the time would come, only a few years later, when that figure would be surpassed by a large margin.
Nixon three years earlier, on August 13, 1971 suspended the conversion of the dollar into gold at a fixed rate, turning the U.S. currency into fiat money, which had value only because the government said it did. In 1974 some of older folks still grumbled, blaming the higher cost of living on the transformation of the mighty greenback into “funny money”. And who’s to say they were wrong?
The unemployment rate in 1971 peaked at 7.2%, and that seemed high, too. It had been rising for 14 months, beginning at 4.6%.
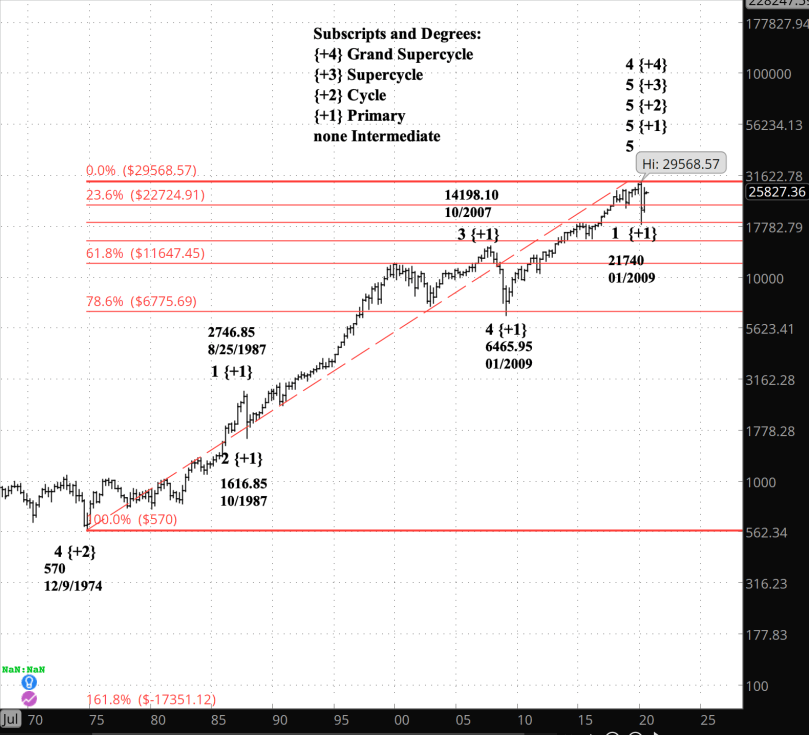
But also in 1974, something happened so quietly that it escaped all notice. The stock market — as measured by the Dow Jones Industrial Average — on December 9 ticked above its low point for years of 570, and began rising. It rose all of the next year, 1975, and then paused in January 1976, thereafter meandering until 1982, when it began to rise again.
And Dow kept on rising, with trips and stumbles along the way. But it never again returned to its starting of 570, and continued to rise, in a series of higher highs and higher lows, until February 13, 2020, when it reached a high of 29,568.57.
Then the crash came, along with a pandemic that in its first few months killed more than 132,000 Americans, one quarter of the deaths globally as of Independence Day 2020.
Since the crash I’ve interpreted the decline as the beginning of a major trend change. The upward trend since December 1974 is at last spent, and a downward trend of similar magnitude has begun. In the discussion that follows, I shall make a case for the new downtrend interpretation. I have money on the table, in that my trading is based on that interpretation. If I’m wrong, it’s going to be painful.
One of my mentors once told me, “You don’t need the fancy analytics. You can see the trend without them. A series of higher highs and higher lows is an uptrend. A series of lower higher and lower lows is a down trend. It’s that simple.”
Look over to the far right of the chart, the final two bars, and the Crash of 2020 doesn’t seem like much. True, it’s deeper than any of the other four lower lows since 1974, three times lower or more. So that suggests that someone other than the run-of-the-mill correction is going on.
On the other hand, there’s nothing that excludes the possibility of an exceptionally deep correction within an uptrend. We a model that provides a more nuanced view than that of my mentor. Elliott Wave Theory is an answer.
Elliott wave analysis uses a collection of market patterns to how far advanced a trend is. Behind all the jargon, it is simply a way of placing a “You Are Here” sign on the chart. Elliott distinguishes between the primary trend and the countertrend, breaking each trend into a series of waves. Movements in the direction of the primary trend are called “motive waves”; those in the direction of the counter are “corrective waves”.
In Elliott terminology, the question I must answer in order to understand this market is whether the decline is a motive wave or a corrective wave.
Each wave, whether motive or corrective, contains its own motive and corrective waves within it. A stock chart is the perfect model of a fractal design. Elliott wave analysis deals with the fractal nature of the chart by labeling waves according to their degree, what might be considered their level. The rise from 1974 to the February 2020 peak is a wave of Cycle degree. Each major subwave within it is one degree down, the Primary degree, and down one further is the Intermediate degree.
Since February by my count we have seen one wave of Primary degree to the downside within one wave of Cycle degree, also downtrending.
A motive wave internally has five waves, three motive waves and two corrective waves, alternating. The motive wave labels are numbers, with 1, 3 and 5 being motive waves, and 2 and 4 being corrective waves.
A corrective wave internally has three waves, labelled A, B and C — A and C being the direction of the countertrend and B being in direction of the larger trend.
Corrective waves have a lot more variation in the ways they play out. Motive waves, by contrast, are pure simplicity. That’s one reason why I trade only motive waves; there are fewer surprises, and as a trader, I hate surprises.
Back to the chart. In order to know whether the rise from 1974 is complete, we have to know how many motive waves it has completed. The Elliott wave numbering is fairly clear across that period, and by my count it has traced five waves. Having met that requirement, there is no barrier to declaring the rise since 1974 to be over. The deeper the decline, the less any doubt that the trend has changed.
How far down can it go in these early stages?
I’ve superimposed a Fibonacci retracement grid showing the common stopping points in a retracement. The levels within the grid aren’t equidistant because they’re based on percentage change rather than point change, a necessity when charting over a long span of time. It can give some some idea of the scale of decline we can expect during Cycle this wave 1 decline.
Cycle 1 to date has take back 38.2% of the rise since 1974, all of it due to its first subwave, Primary wave 1. It then traded an upward correction in the 2nd wave of Primary degree, taking back 86% of the initial decline. to 18,213.65,
How does that compare to the previous Primary wave 1 up, which began its rise in December 1974? First, the old 1st wave was long, It lasted more than 12 years and carried the price up more than 380%. The Primary wave 2 down, which began last February, lasted for nine days and declined by 36%. That’s not just my count. After I published my assessment, the leading Elliott wave analysts in the business published theirs, and we agreed. That sort of difference doesn’t break the rules that R.N. Elliott formulated. However, it certainly gives me pause, and perhaps should inspire a degree of skepticism in any trader using the Elliott Wave Theory.
As always with Elliott wave analysis, time will resolve all ambiguities, in such a way that the trader can know exactly how the ambiguity was resolved and what that means for the future course of prices. No other analytical technique provides that density of information.
The reality is that we can’t yet put a lower boundary on Cycle wave 1. All we can say is that it will stay below 29,568.57, the peak of the prior uptrend from 1974. If the price breaks above that level, then we are not in a new major downtrend but a correction within Cycle wave 5 to the upside.
There’s no rule saying how far down a 1st wave can go. So we have an upper limit that can make-or-break the interpretation of decline since February as being the start of a downtrend of Cycle degree or larger, and very little downside information at all.
Of the downside all we can say is that if this is indeed a new downtrend of high degree, then the 570 level from which the Cycle degree rise began eventually will be pierced by one of the two remaining motive waves , either the 3rd or the 5th.
Learning and other resources. Elliott Wave International has long been the leading analytical house based on Elliott wave theory. They make available a number of free educational materials and other resources, in addition to their for-pay subscriptions.
I recommend two books, both by people associated with EWI.
First, Elliott Wave Principle by Robert Prechter and A.J. Frost is the book that, along with Prechter’s analyses, that created the revival of Elliott wave theory. I first read it in 1984, and it has had a profound influenced on my thinking about markets ever since.
Second, I’ve found Visual Guide to Elliott Wave Trading by Wayne Gorman and Jeffrey Kennedy, both of EWI, to be a useful book that relates Elliott wave theory to practical trading. The authors are hands-on Elliotticians, and for an active trader, that’s exactly what’s needed — less theory and more how-to. The first chapter of the book gives a very nice thumbnail run down of what Elliott wave theory is all about.
Terminology. Here are some links to information about some of the technical jargon I use.
Charts. On my charts, waves have a subscript showing the degree above or below the Intermediate degree. Here are the subscripts and the degree each represents:
- {+3} Supercycle
- {+2} Cycle
- {+1} Primary
- No subscript: Intermediate
- {-1} Minor
- {-2} Minute
- {-3} Minuette
By Tim Bovee, Portland, Oregon, July 4, 2020
Disclaimer
Tim Bovee, Private Trader tracks the analysis and trades of a private trader for his own accounts. Nothing in this blog constitutes a recommendation to buy or sell stocks, options or any other financial instrument. The only purpose of this blog is to provide education and entertainment.
No trader is ever 100 percent successful in his or her trades. Trading in the stock and option markets is risky and uncertain. Each trader must make trading decisions for his or her own account, and take responsibility for the consequences.
License

All content on Tim Bovee, Private Trader by Timothy K. Bovee is licensed under a Creative Commons Attribution-ShareAlike 4.0 International License.
Based on a work at www.timbovee.com.

[…] look of the market uptrend from 1974 that got us to the February peak. The essay, “How We Got Here“, attempts to make a case for the February decline being a major reversal to a high-magnitude […]
LikeLike