10:05 a.m. New York time
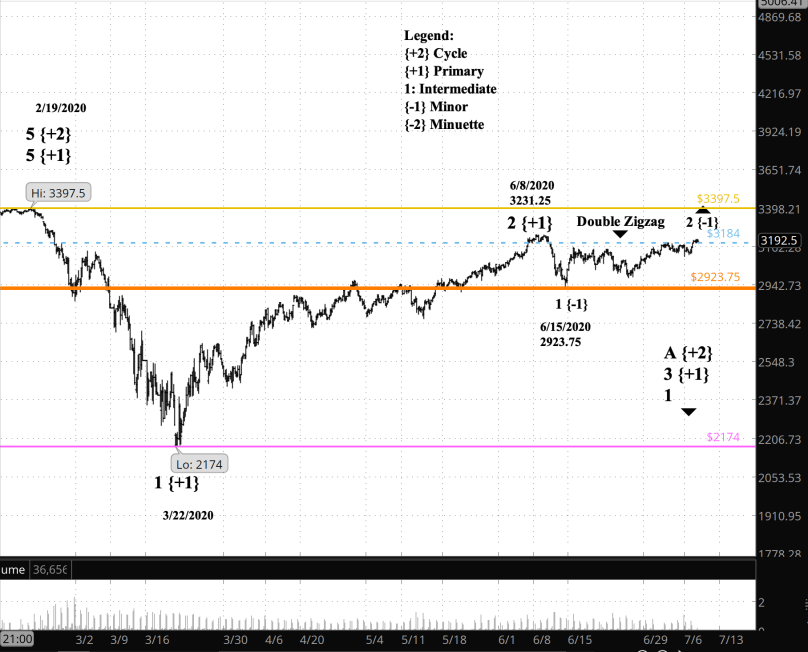
What’s happening now? The S&P 500 E-mini futures on Sunday joined the index and the exchange-traded fund SPY in breaking above the peak of July 6 (The dotted blue line on the chart; see “A Funny Thing Happened“, posted Saturday).
What does it mean? The break above that shows that the correction that began June 15 is continuing, although its upside potential is severely limited. A push above the start of the major decline that began February 19, at 3397.50 (tan line), would mean that the major decline was over, having proven less major than my analysis at its outset had shown. Should that occur, then I would expect to see a continuation, in a very late stage, of the market rise that began in December 1974.
What does Elliott wave theory say? The breakout past the peak of what I had labeled as the Minor wave of 2nd degree means that Minor 2 is tracing a double zigzag pattern, a common sight in 2nd waves. By my count, internally the price is tracing the Minuette C wave — the final wave — of the second zigzag. From there, the next step is either a continuation of the correction as a triple zigzag, or the end of the correction and the beginning of Minor wave 3 to the downside.
The end of Minor 3 will be followed by a Minor 4 upward correction and then a Minor wave 5 to the downside, which at its terminus will signal the end of Intermediate wave 1, a degree higher.
What is the alternative? The break-out above the June 15 peak has resolved the ambiguities for now. I see no alternatives.
What about my trades? Patiently awaiting Intermediate wave 3, or possibly Minor wave 3, depending upon the timing of things at it relates to the options calendar.
Learning and other resources. Elliott Wave International has long been the leading analytical house based on Elliott wave theory. They make available a number of free educational materials and other resources, in addition to their for-pay subscriptions.
I recommend two books, both by people associated with EWI.
First, Elliott Wave Principle by Robert Prechter and A.J. Frost is the book that, along with Prechter’s analyses, that created the revival of Elliott wave theory. I first read it in 1984, and it has had a profound influenced on my thinking about markets ever since.
Second, I’ve found Visual Guide to Elliott Wave Trading by Wayne Gorman and Jeffrey Kennedy, both of EWI, to be a useful book that relates Elliott wave theory to practical trading. The authors are hands-on Elliotticians, and for an active trader, that’s exactly what’s needed — less theory and more how-to. The first chapter of the book gives a very nice thumbnail run down of what Elliott wave theory is all about.
Terminology. Here are some links to information about some of the technical jargon I use.
Charts. On my charts, waves have a subscript showing the degree above or below the Intermediate degree. Here are the subscripts and the degree each represents:
- {+3} Supercycle
- {+2} Cycle
- {+1} Primary
- No subscript: Intermediate
- {-1} Minor
- {-2} Minute
- {-3} Minuette
By Tim Bovee, Portland, Oregon, July 13, 2020
Disclaimer
Tim Bovee, Private Trader tracks the analysis and trades of a private trader for his own accounts. Nothing in this blog constitutes a recommendation to buy or sell stocks, options or any other financial instrument. The only purpose of this blog is to provide education and entertainment.
No trader is ever 100 percent successful in his or her trades. Trading in the stock and option markets is risky and uncertain. Each trader must make trading decisions for his or her own account, and take responsibility for the consequences.
License

All content on Tim Bovee, Private Trader by Timothy K. Bovee is licensed under a Creative Commons Attribution-ShareAlike 4.0 International License.
Based on a work at www.timbovee.com.

You must be logged in to post a comment.